

Welcome to this week’s plan. Inside, you’ll find a quick review of last week’s price action, key economic events, market structure, context for the week ahead, and the levels I’ll be focusing on. Let’s get prepared.
Contents
Last Week in Review
Economic & Earnings Calendar
Market Structure
Contextual Analysis & Plan
Key Levels of Interest
Last Week in Review
Last week’s plan:

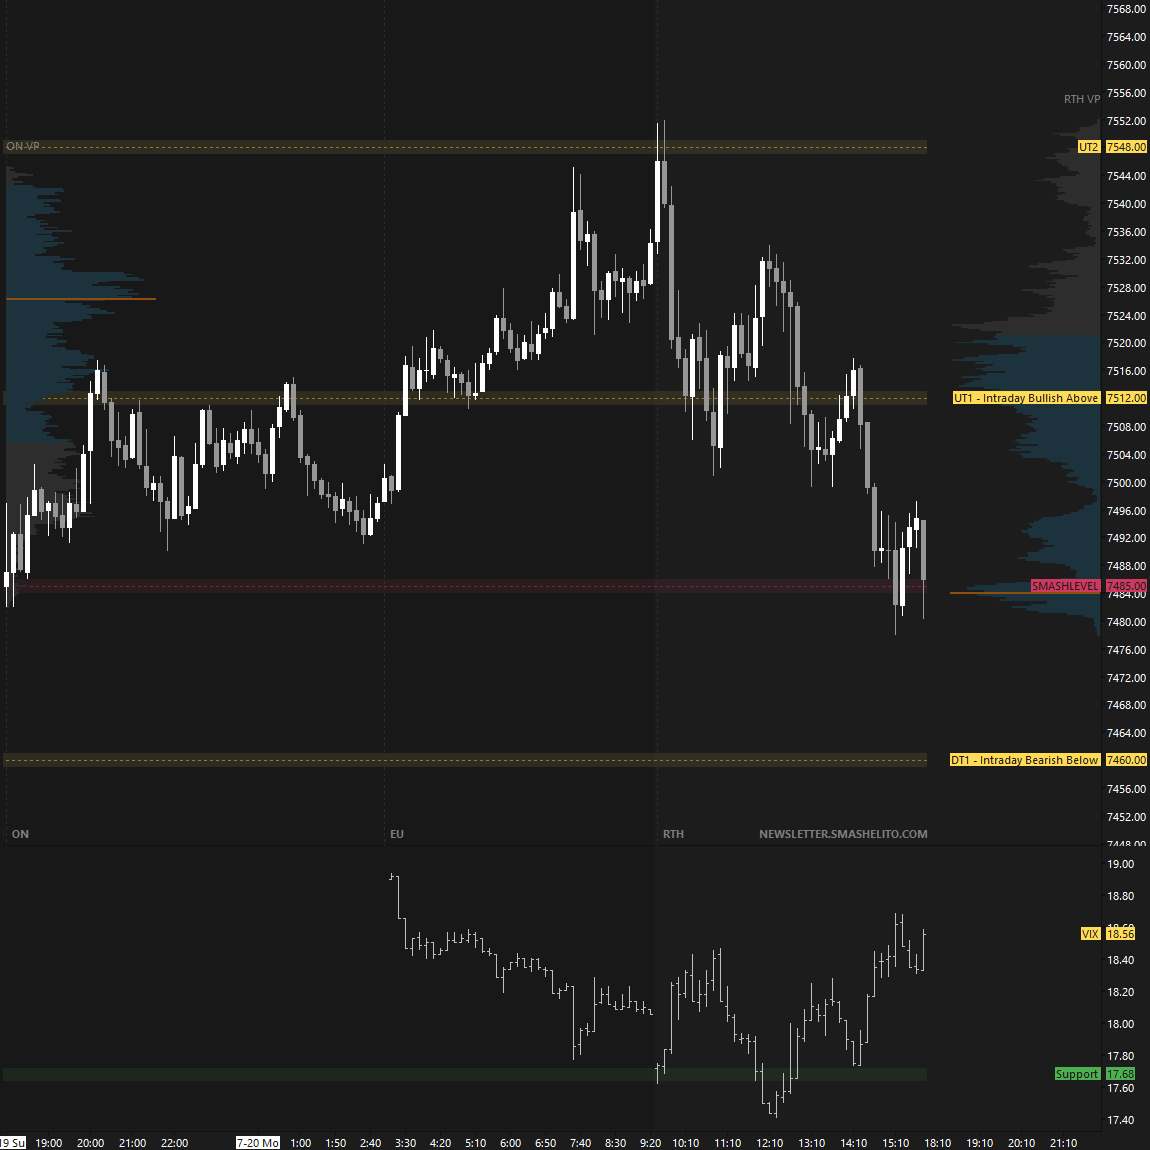
Last week kicked off with responsive buyers at the key 7485 level on Monday. This ultimately led to a fill of the gap at 7548.25, where sellers stepped in, resulting in a classic gap-fill reversal (see Figure 1). A double distribution profile was established as the auction rotated back to the 7485 level.
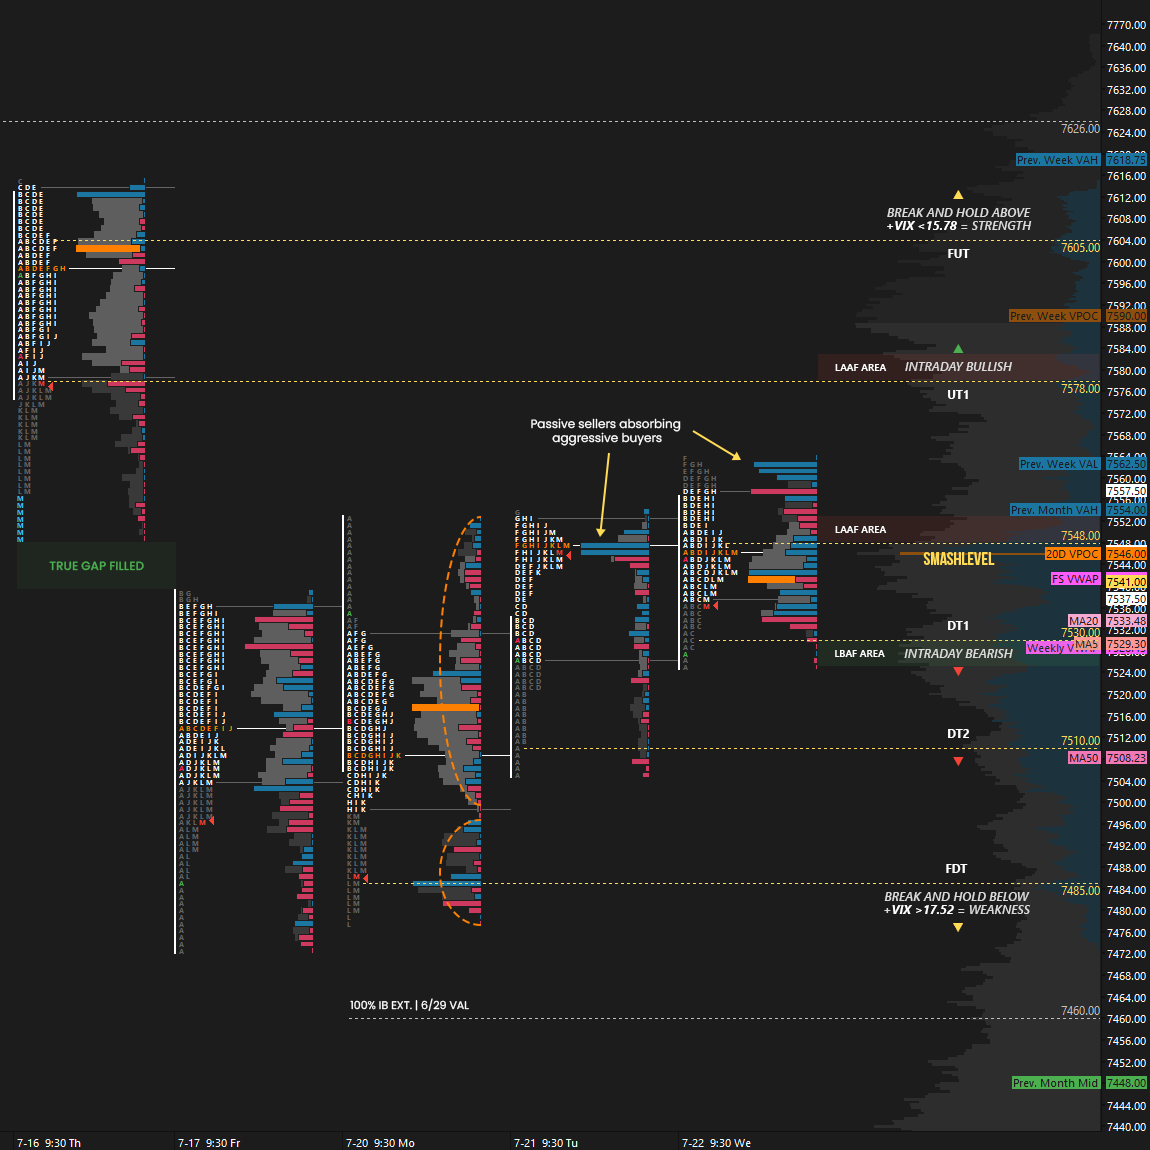
Monday’s trend day was rejected on Tuesday, and buyers attempted to gain acceptance back above the key 7548 level on both Tuesday and Wednesday, but without meaningful success. By monitoring order flow, we could observe consistent absorption as aggressive buyers were absorbed by passive sellers above 7548 during both sessions (see Figure 2).
Change took place on Thursday as the auction established a true gap down after rejecting the 7548 level overnight. Downside momentum stalled at the 7420 level, a composite high volume node, but sellers had once again initiated a directional move. The key heading into Friday’s session was whether the move would gain acceptance or be rejected.
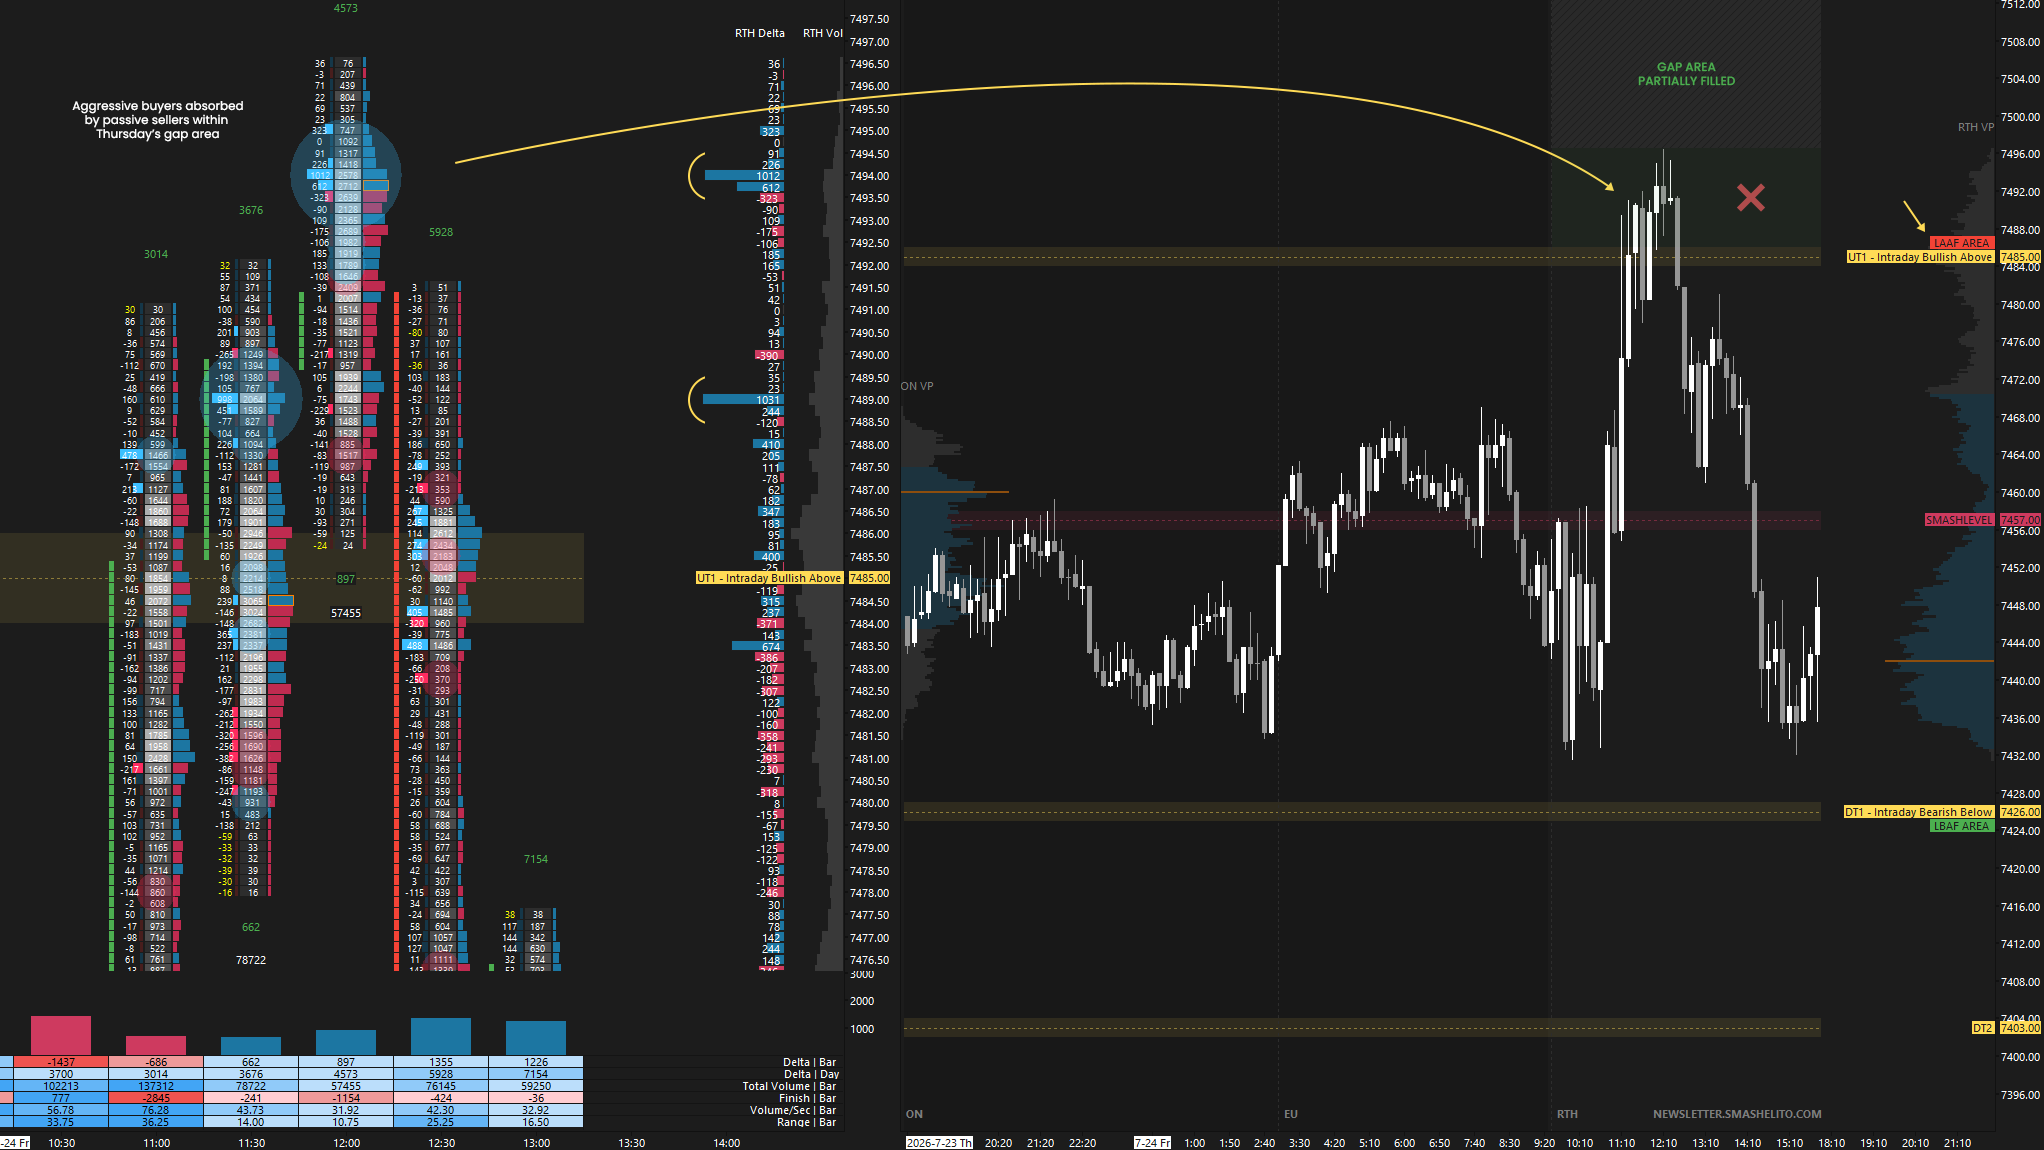
Friday kicked off with responsive buyers, partially filling Thursday’s gap before running into passive sellers. Aggressive buyers lacked the size needed to push through the passive liquidity, resulting in a reversal and a close at session lows (see Figure 3).
The auction has established a 2-day balance, now of short-term interest. The key question is whether sellers can continue to accept lower prices following Thursday’s gap lower and maintain downside pressure.
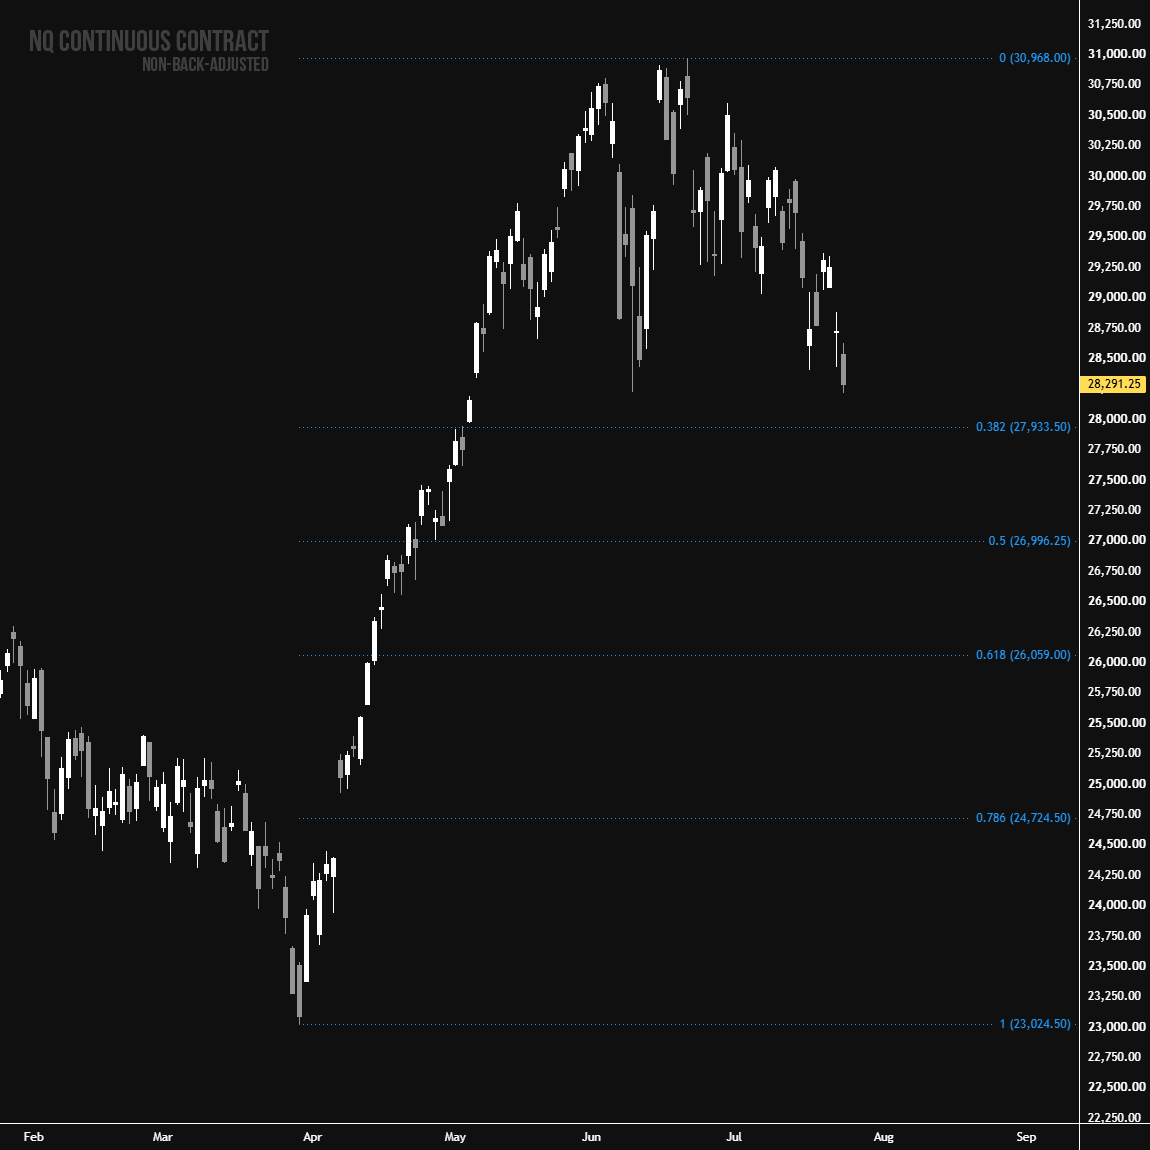
If you are trading NQ, the relative weakness is evident, as NQ has already reached its June 9 lows. It’s worth monitoring how NQ behaves around its multi-week balance low, as this could provide directional clues for ES.
Additionally, I shared an HTF level for NQ a while ago at 27930. Notably, it aligns closely with the 38.2% Fibonacci retracement level (see Figure 4), making it a level worth monitoring should it be tested.
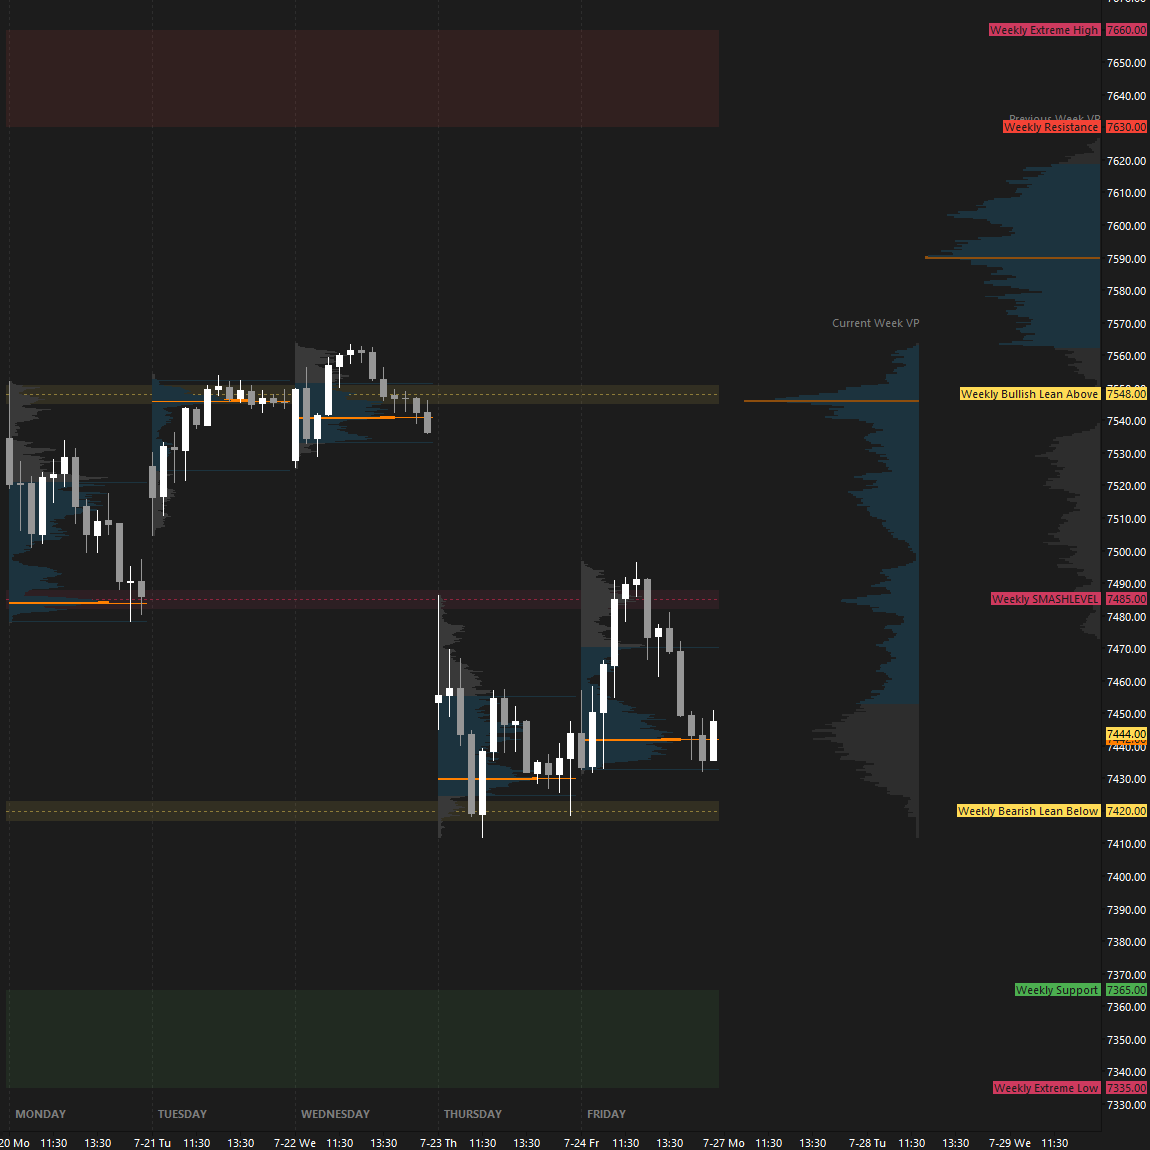
Weekly Levels in Review
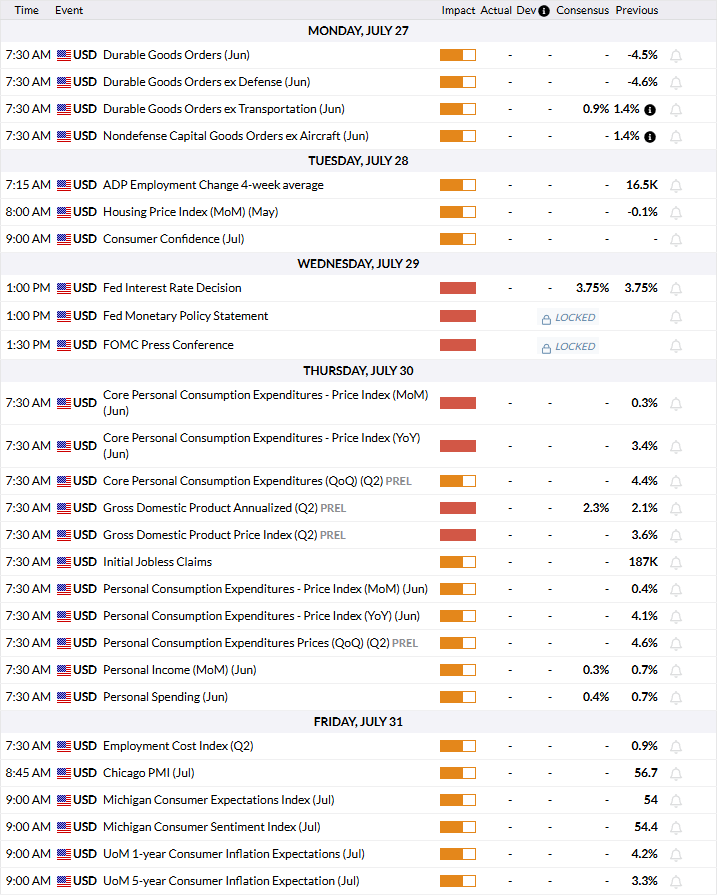
Economic & Earnings Calendar
Central Standard Time
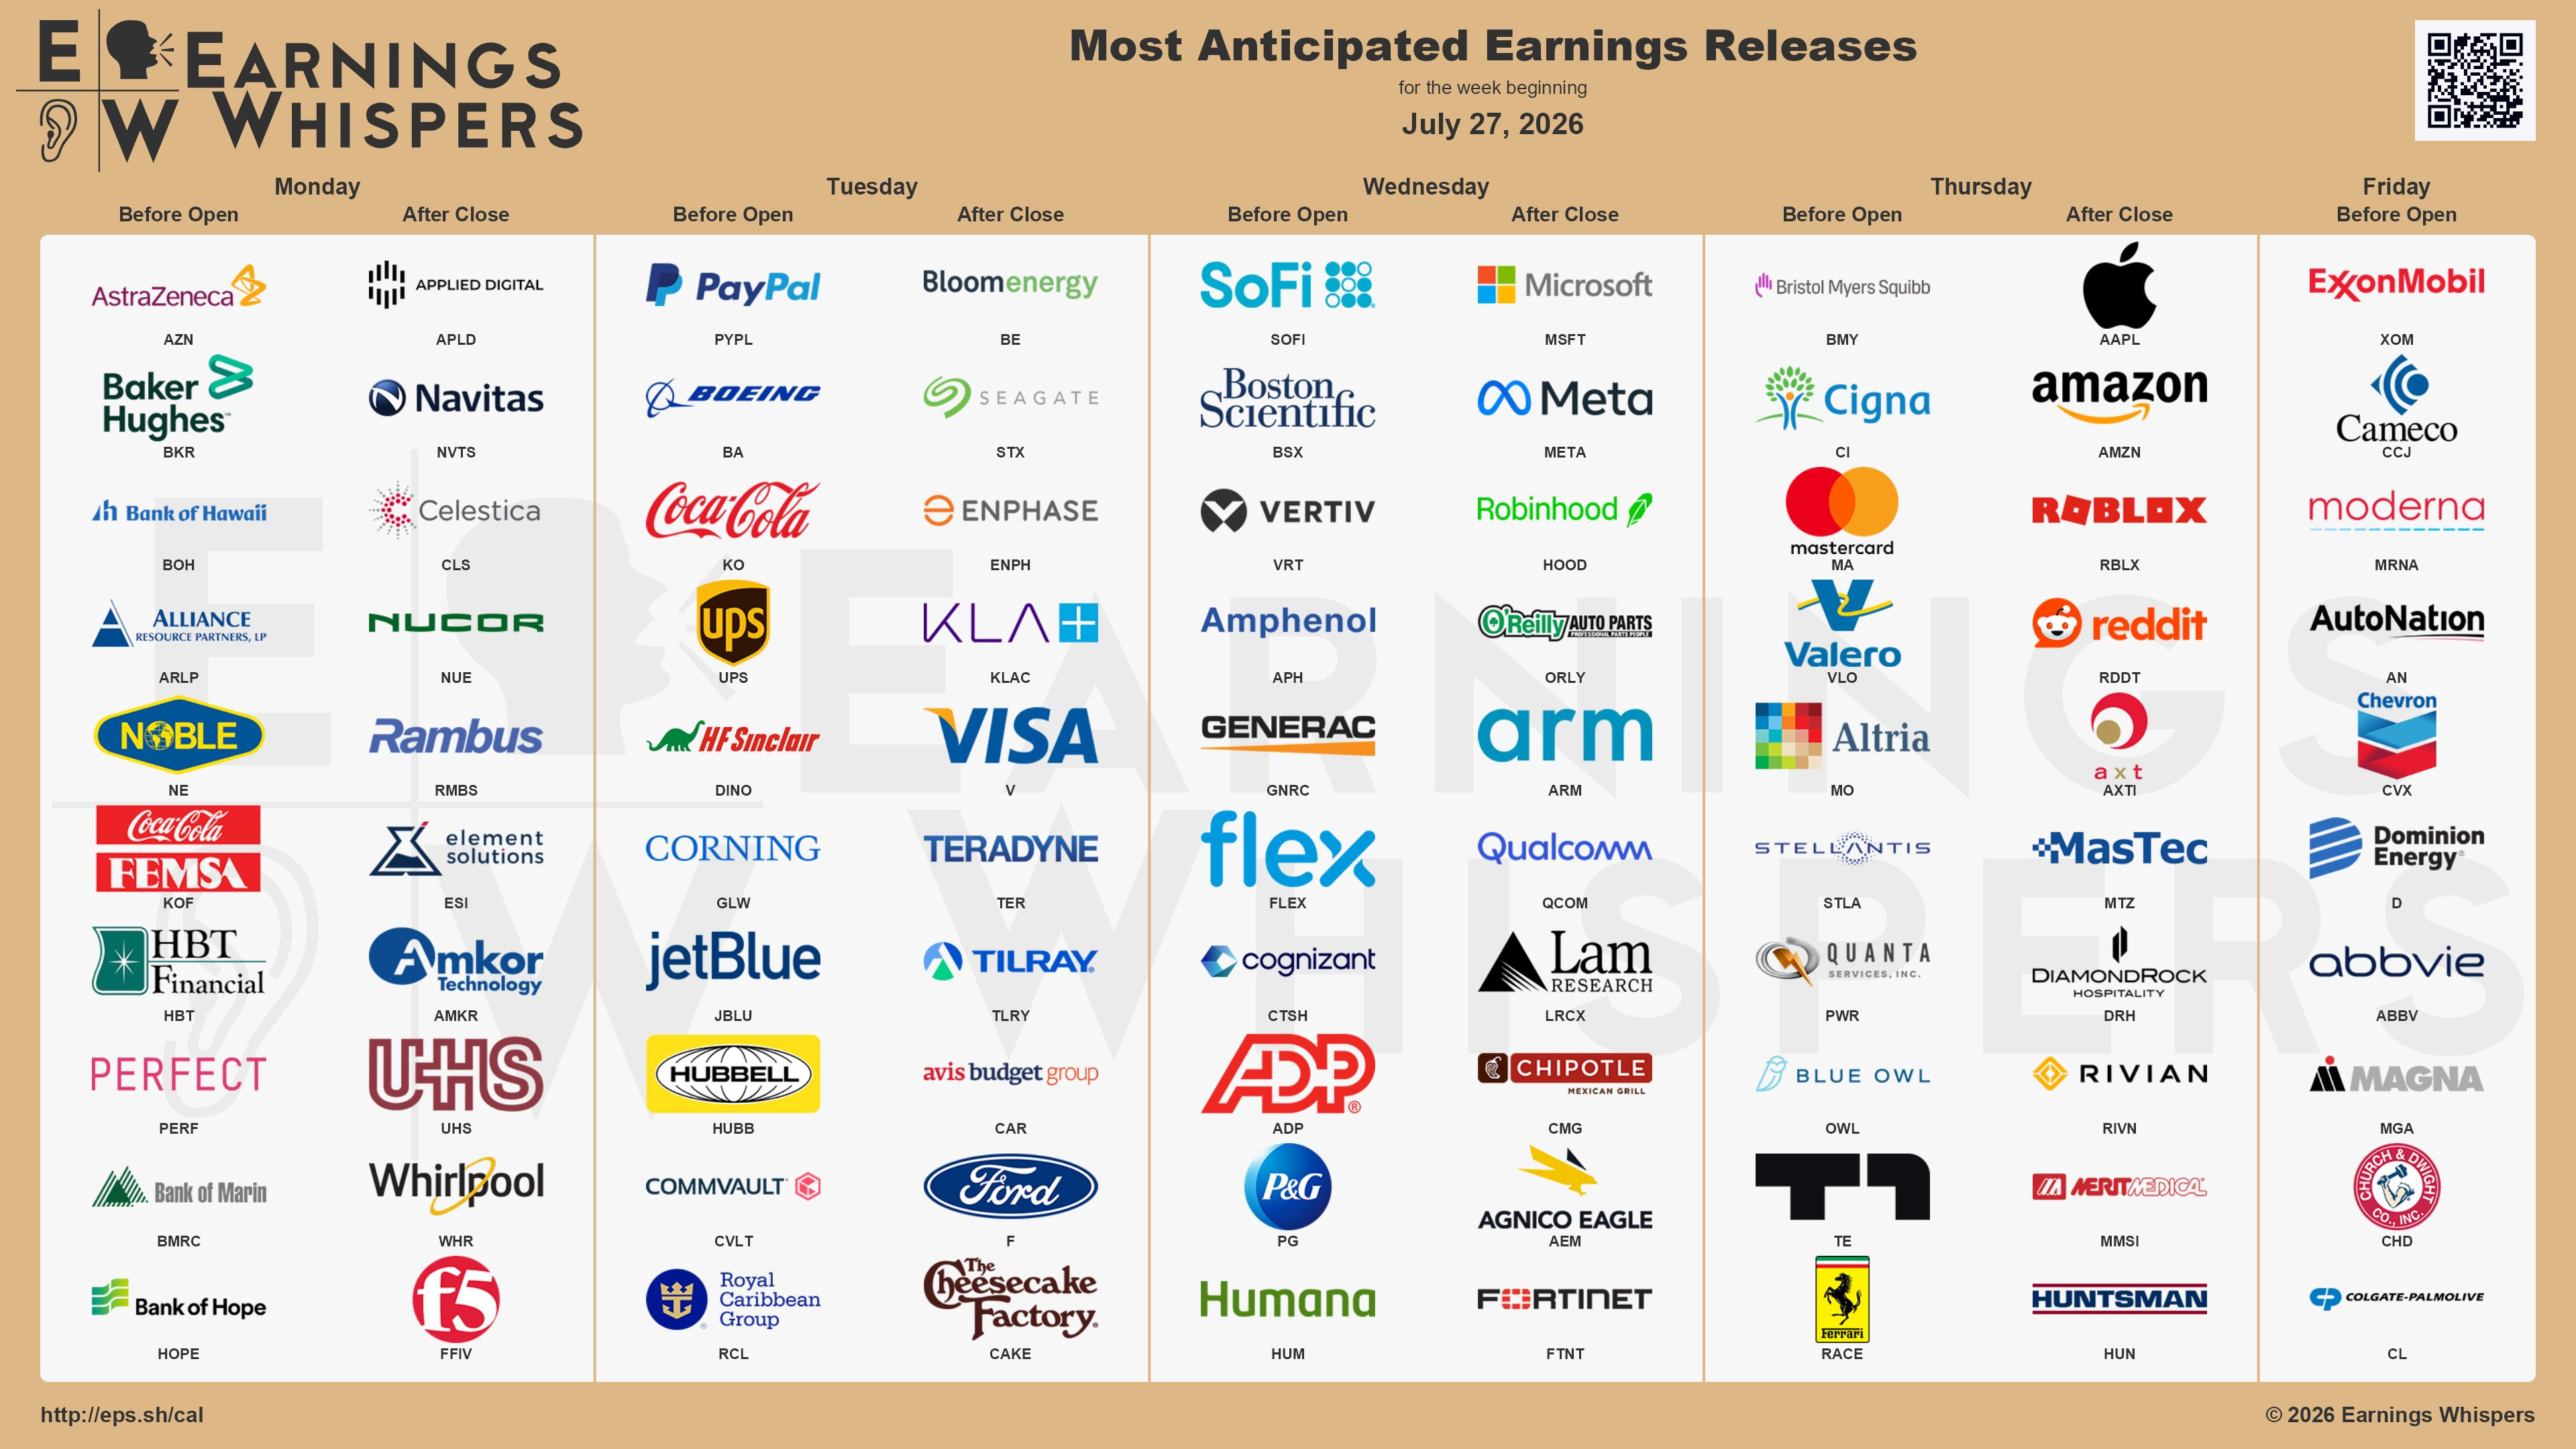
Earnings Whispers
Market Structure
🟨 Daily: BALANCE → 2-day → High: 7496.50 / Low: 7411.75
🟨 Weekly: BALANCE → 11-week → High: 7648.75 / Low: 7247.25
🟩 Monthly: OTFU → Ends at: 7247.25
Balance: A market condition where price consolidates within a defined range, reflecting indecision as the market awaits more market-generated information. We apply balance guidelines, favoring fade trades at range extremes (highs/lows) and preparing for breakout setups if balance resolves.
One-Time Framing Up (OTFU): A market condition where each subsequent bar forms a higher low, signaling a strong upward trend.
One-Time Framing Down (OTFD): A market condition where each subsequent bar forms a lower high, signaling a strong downward trend.
Contextual Analysis & Plan
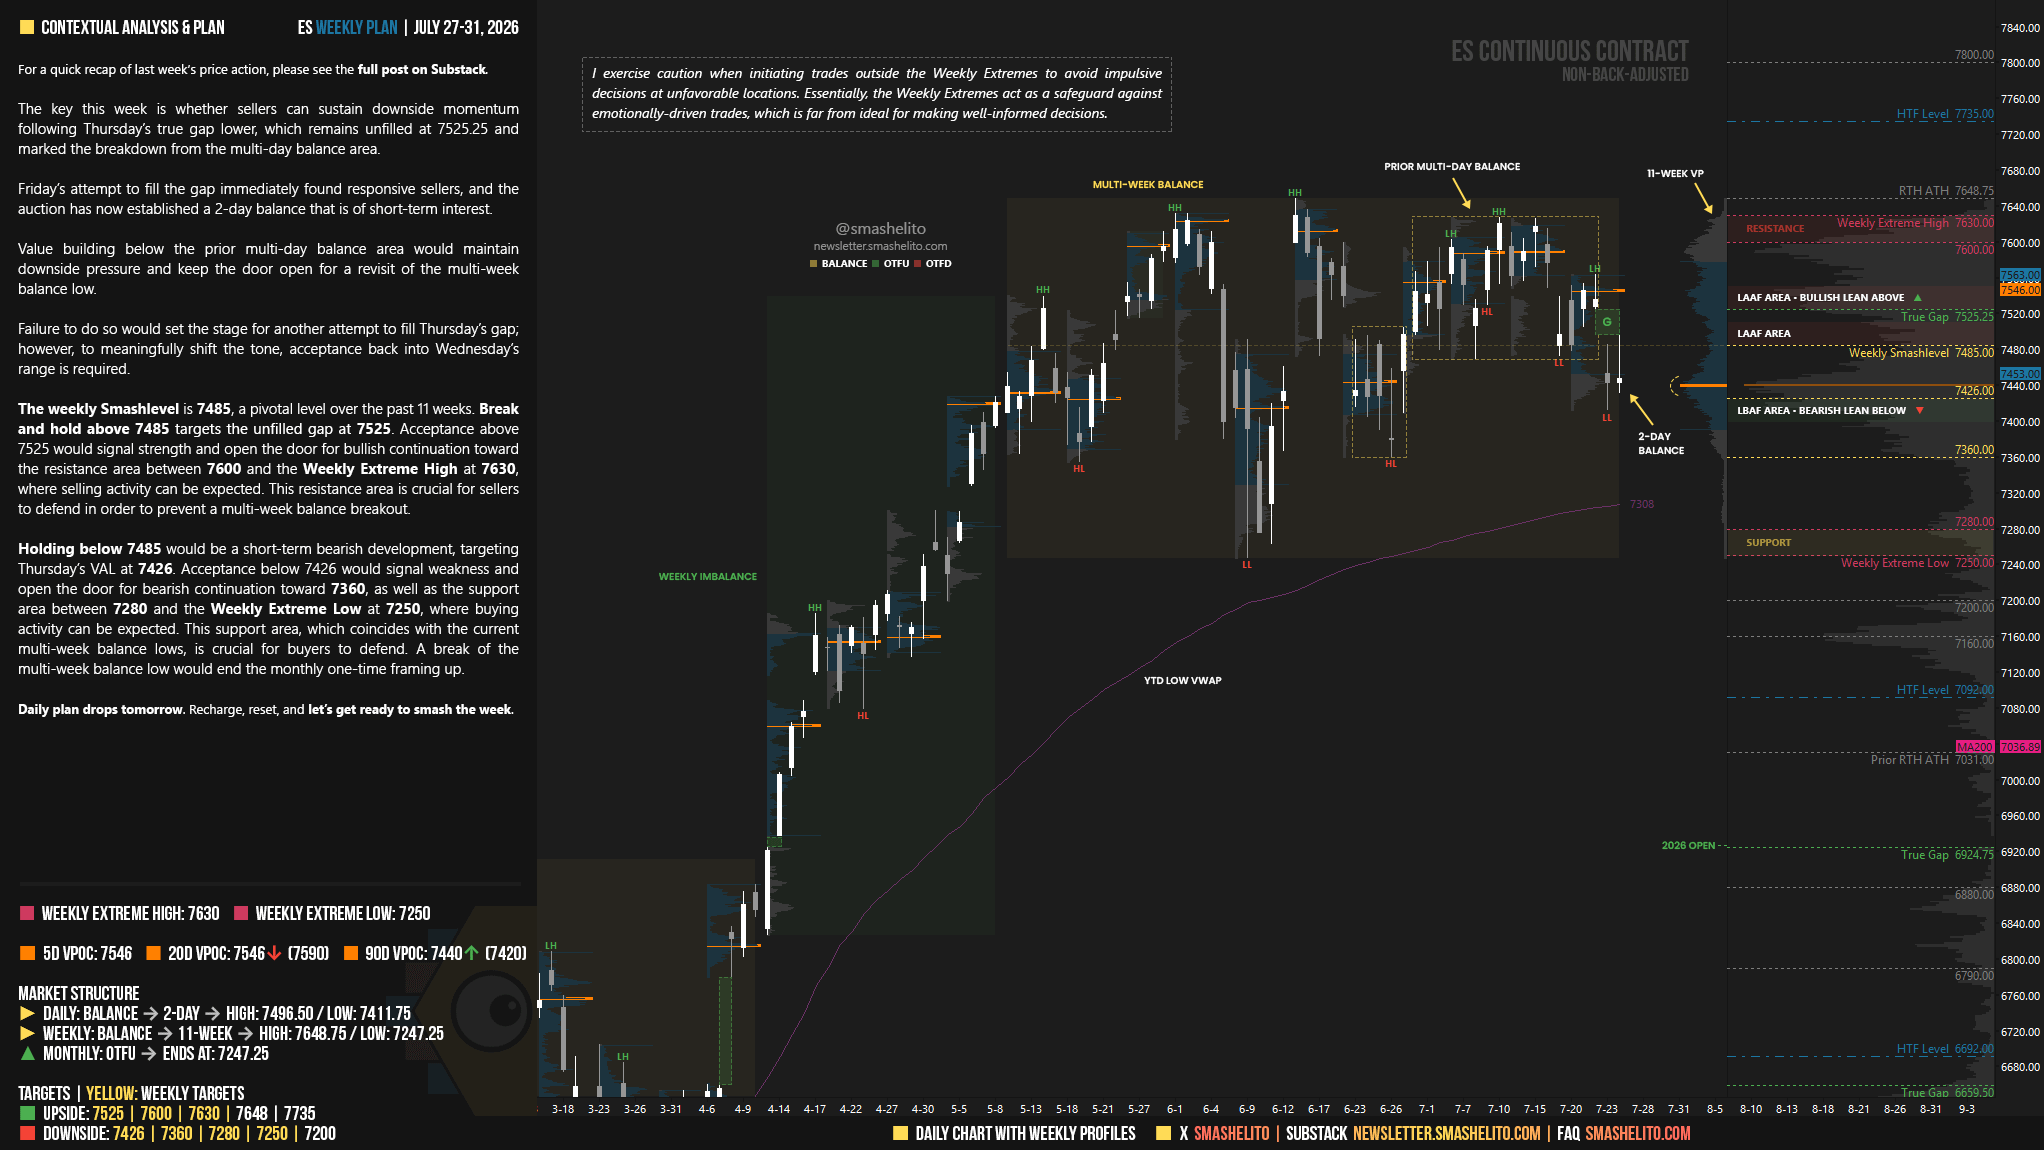
The key this week is whether sellers can sustain downside momentum following Thursday’s true gap lower, which remains unfilled at 7525.25 and marked the breakdown from the multi-day balance area.
Friday’s attempt to fill the gap immediately found responsive sellers, and the auction has now established a 2-day balance that is of short-term interest.
Value building below the prior multi-day balance area would maintain downside pressure and keep the door open for a revisit of the multi-week balance low.
Failure to do so would set the stage for another attempt to fill Thursday’s gap; however, to meaningfully shift the tone, acceptance back into Wednesday’s range is required.
The weekly Smashlevel is 7485, a pivotal level over the past 11 weeks. Break and hold above 7485 targets the unfilled gap at 7525. Acceptance above 7525 would signal strength and open the door for bullish continuation toward the resistance area between 7600 and the Weekly Extreme High at 7630, where selling activity can be expected.
This resistance area is crucial for sellers to defend in order to prevent a multi-week balance breakout.
Holding below 7485 would be a short-term bearish development, targeting Thursday’s VAL at 7426. Acceptance below 7426 would signal weakness and open the door for bearish continuation toward 7360, as well as the support area between 7280 and the Weekly Extreme Low at 7250, where buying activity can be expected.
This support area, which coincides with the current multi-week balance lows, is crucial for buyers to defend. A break of the multi-week balance low would end the monthly one-time framing up.
Visual Representation
Key Levels of Interest
In the upcoming week, I will closely observe the behavior around 7485.
Break and hold above 7485 would target 7525 / 7600 / 7630* / 7648 / 7735
Holding below 7485 would target 7426 / 7360 / 7280 / 7250* / 7200
*Weekly Extremes (defined by proprietary models). I exercise caution when initiating trades outside the Weekly Extremes to avoid impulsive decisions at unfavorable locations. Essentially, the Weekly Extremes act as a safeguard against emotionally-driven trades, which is far from ideal for making well-informed decisions.
Daily plan drops tomorrow. Recharge, reset, and let’s get ready to smash the week.
Another smash hit, as always… thanks Smash-elite-o
Thanks smash, have a great week