

Welcome to this week’s plan. Inside, you’ll find a quick review of last week’s price action, key economic events, market structure, context for the week ahead, and the levels I’ll be focusing on. Let’s get prepared.
Contents
Last Week in Review
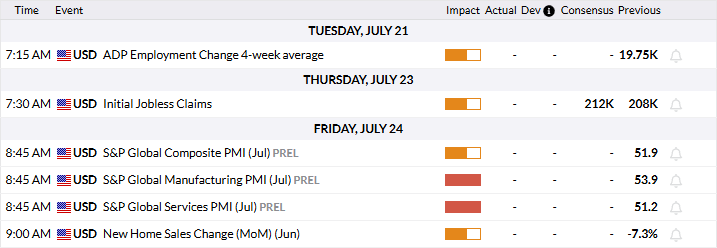
Economic & Earnings Calendar
Market Structure
Contextual Analysis & Plan
Key Levels of Interest
Last Week in Review
Last week’s plan:

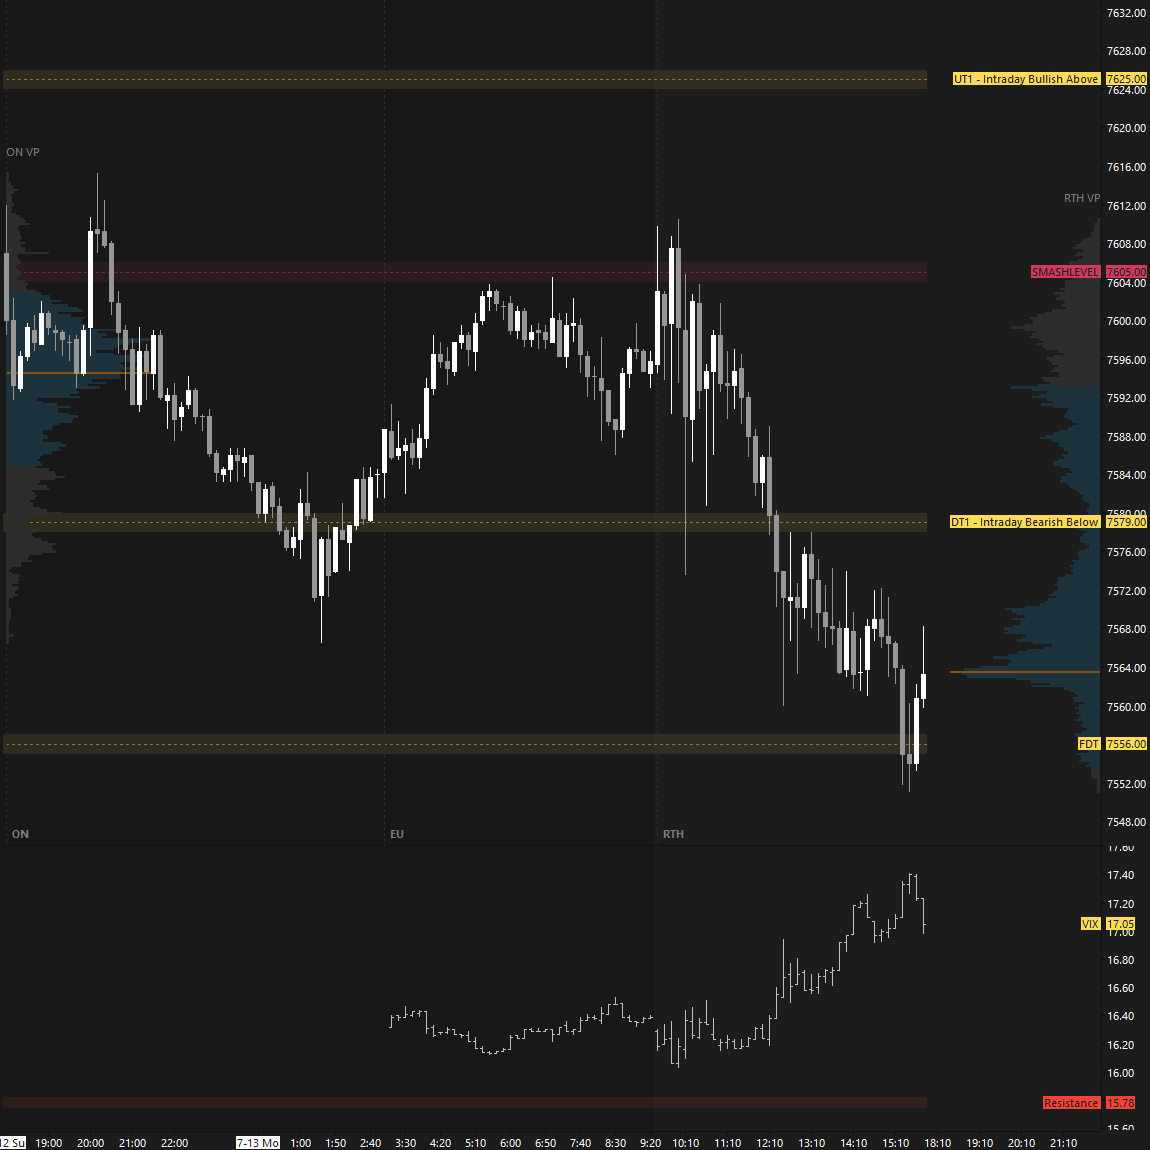
Last week kicked off with weakness on Monday, as buyers were unable to build value above the prior week’s VAH at 7605, failing to confirm the breakout attempt from Friday, July 10. The 7605 level provided an short opportunities both overnight and during the RTH session (see Figure 1). The daily timeframe shifted from one-time framing up back into balance heading into Tuesday.
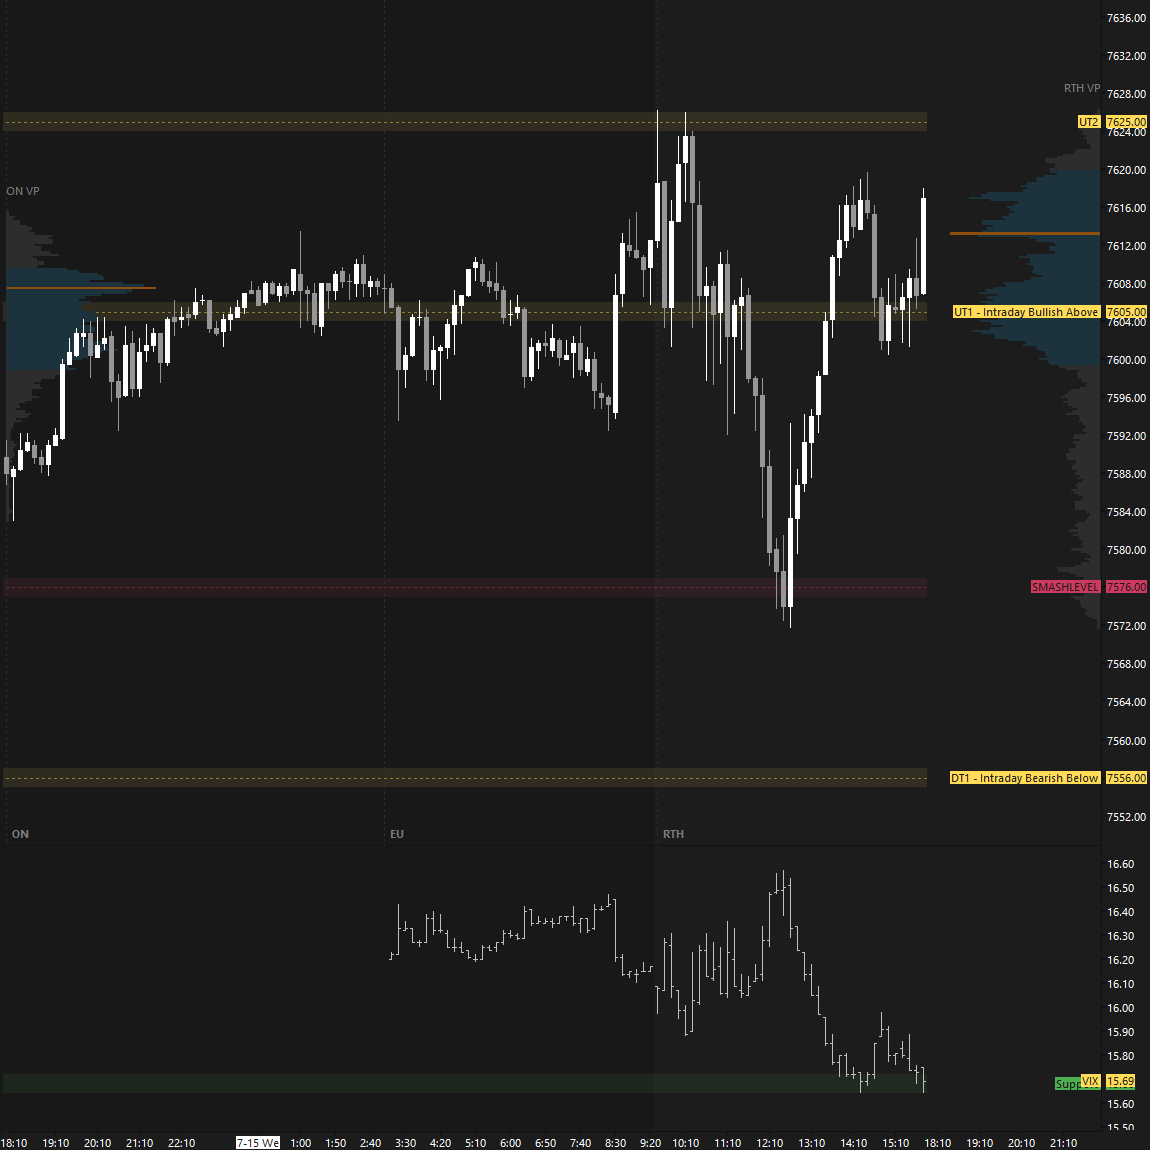
Tuesday’s session established an inside day, suggesting that little had changed from a contextual standpoint. On Wednesday, buyers reclaimed 7605 and established value above the level, signaling strength and opening the door to a breakout attempt. The Smashlevel for the session at 7576 proved pivotal, marking the point from which a strong intraday reversal unfolded (see Figure 2).
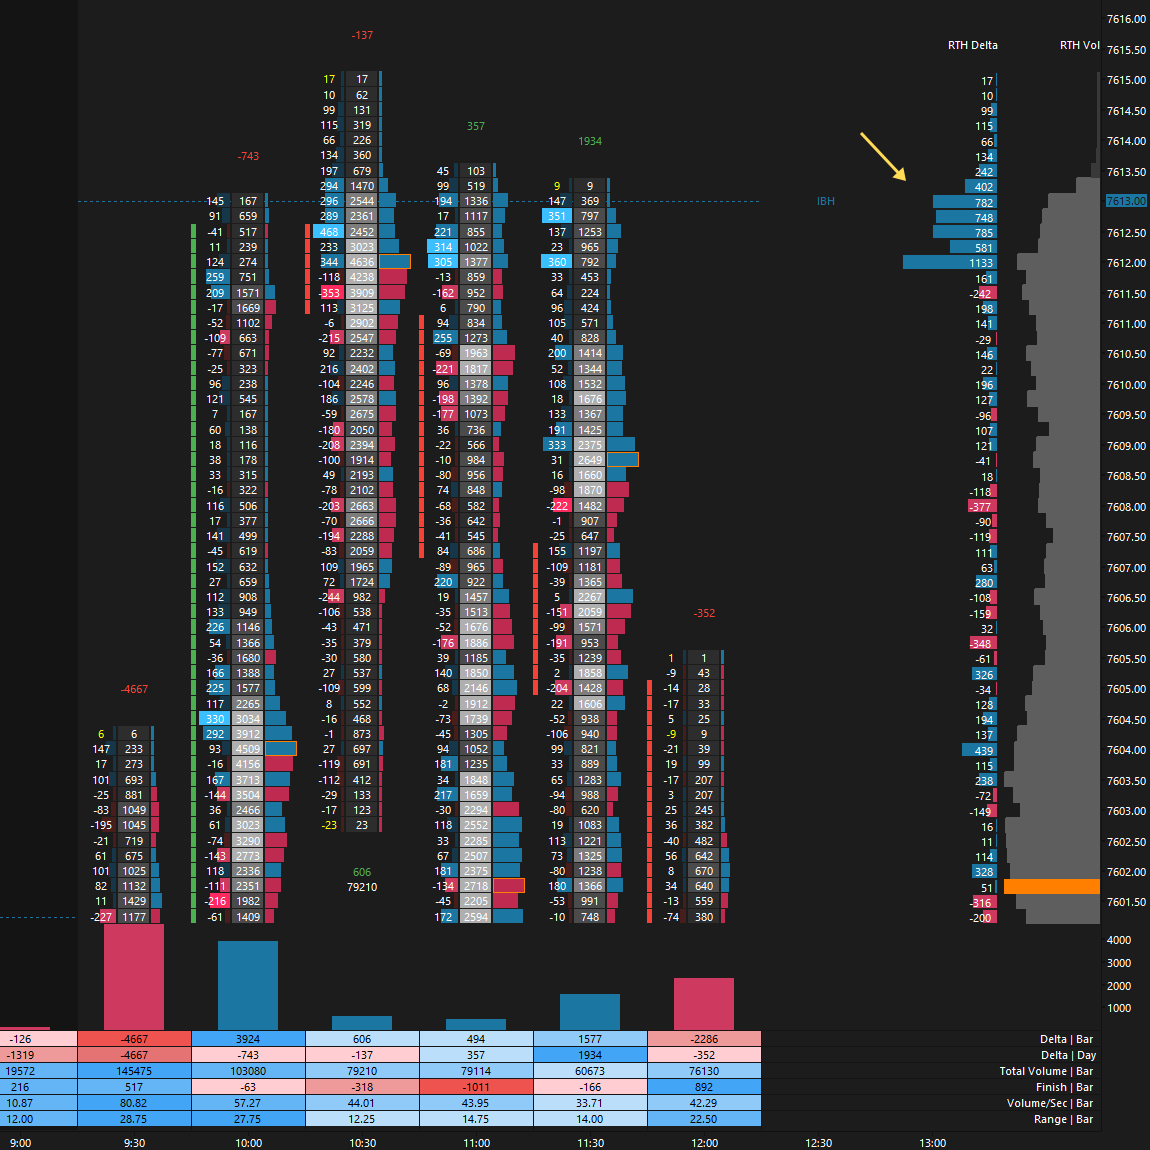
On Thursday, a failed breakout attempt developed overnight, triggering weakness and leading buyers to lose control of the key 7605 level. During the RTH session, an interesting absorption sequence played out when buyers attempted to reclaim 7605. Notable aggressive buying was absorbed by passive sellers around 7612 (see Figure 3).
Heading into Friday, the auction had developed a 12-day balance area, within which a 5-day balance had formed. On Friday, a breakdown from the 5-day balance was initiated overnight, triggering a test of the lower end of the larger balance, where responsive buyers stepped in (see Figure 4).
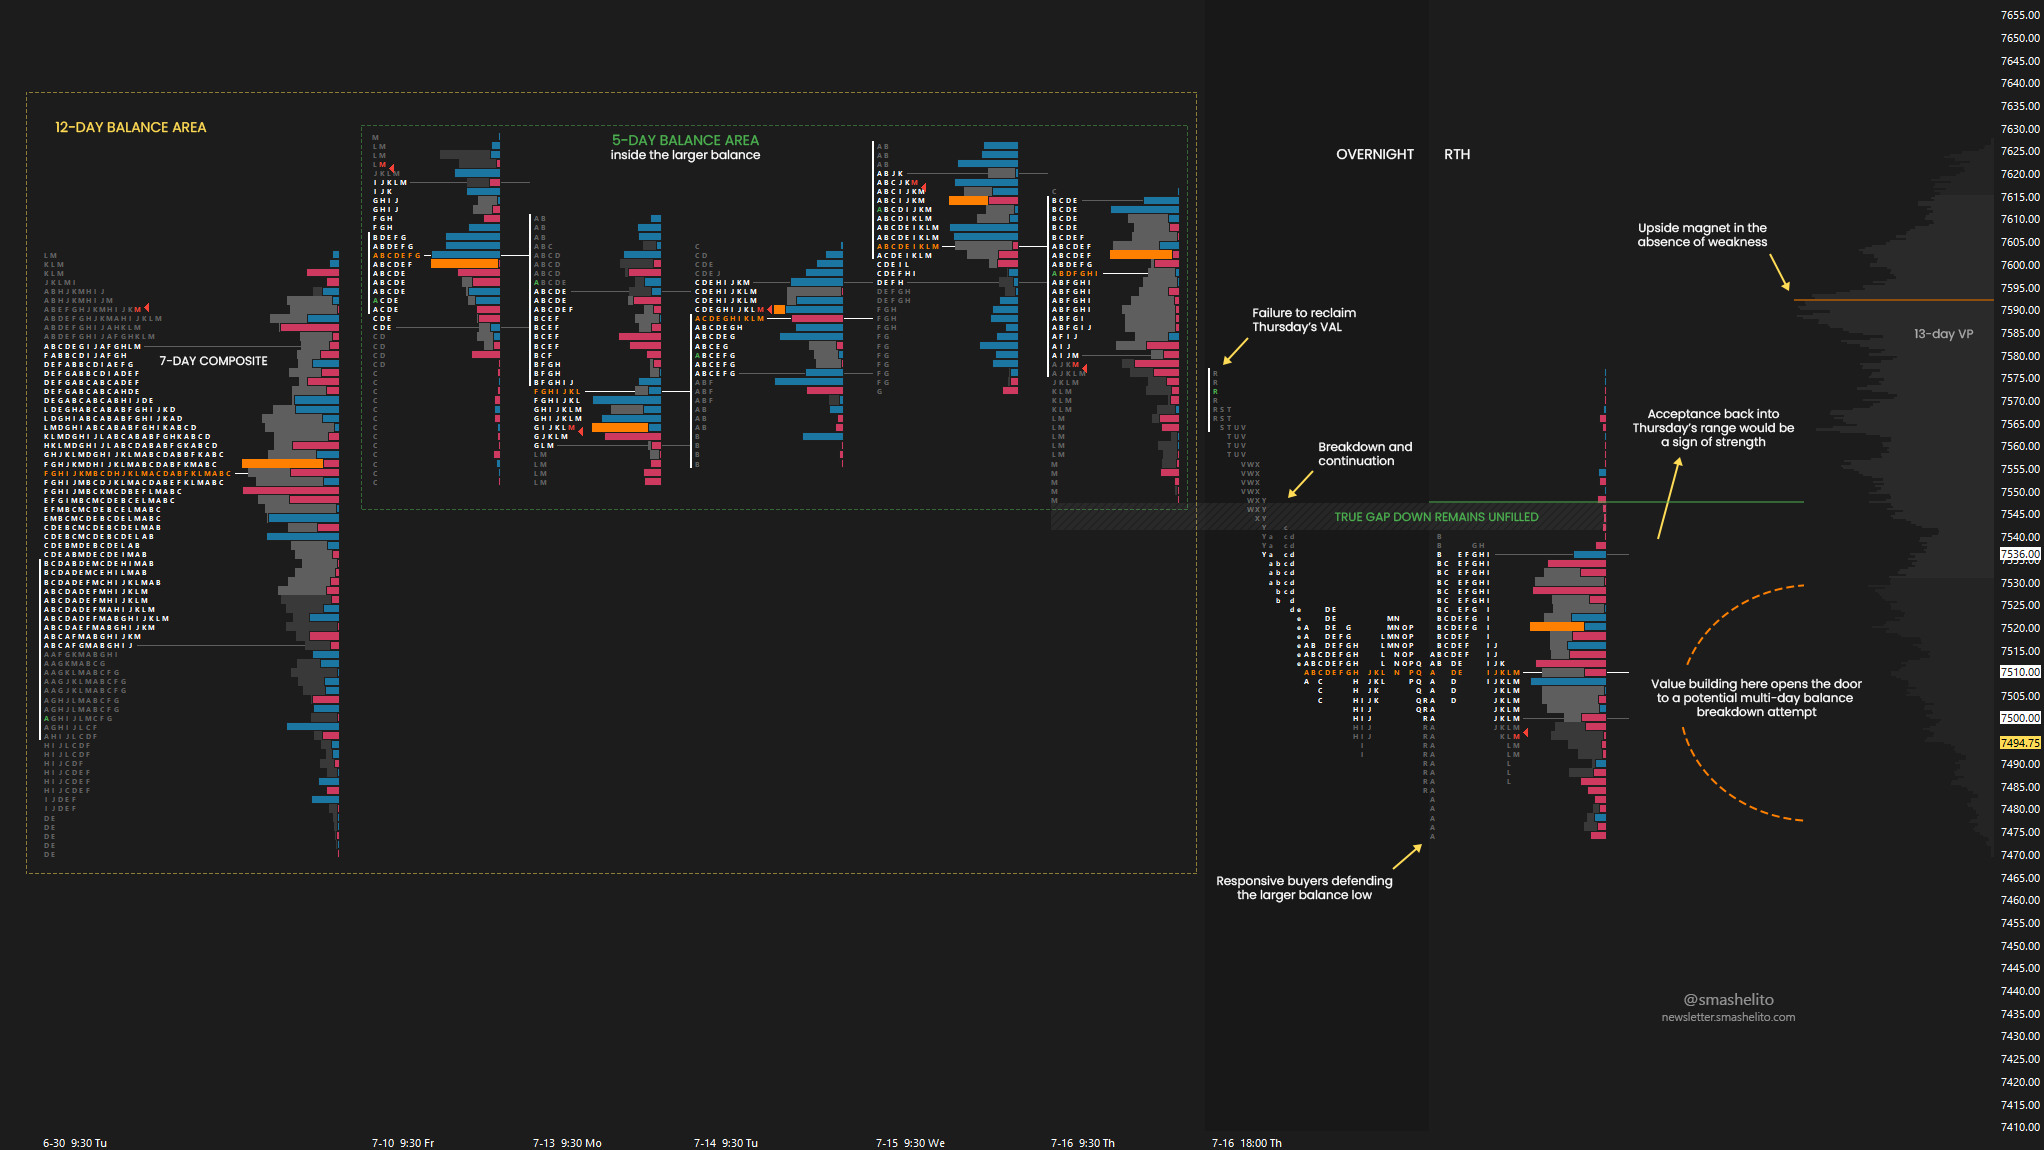
Friday’s true gap at 7548.25 will be a key reference point moving forward. Acceptance below it would open the door to continued downside pressure in the short term, while failure to gain acceptance below it would signal weak sellers.
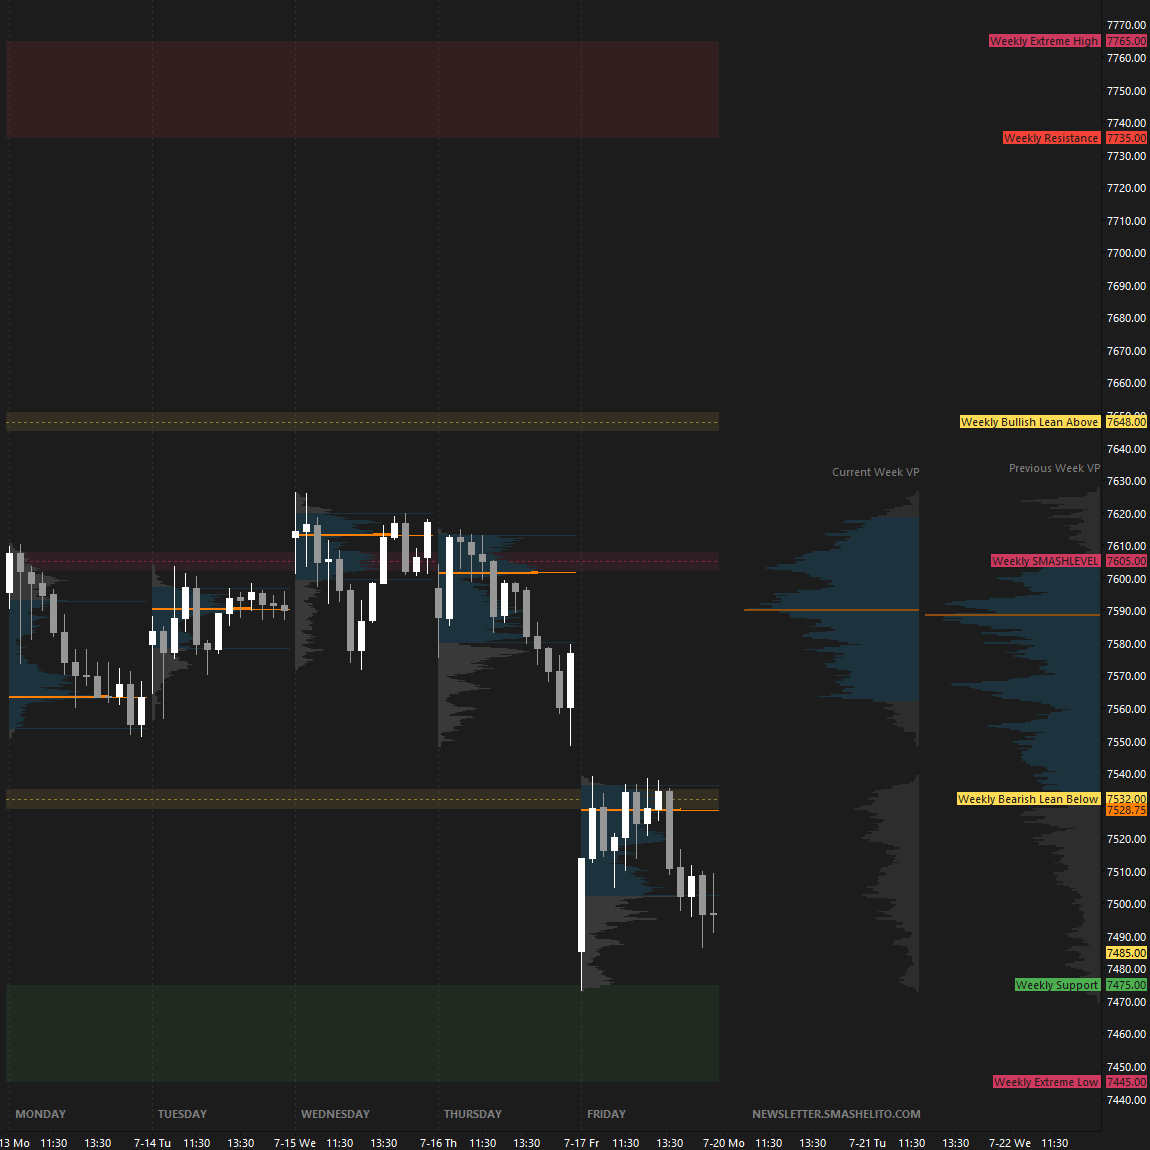
Weekly Levels in Review
Economic & Earnings Calendar
Central Standard Time
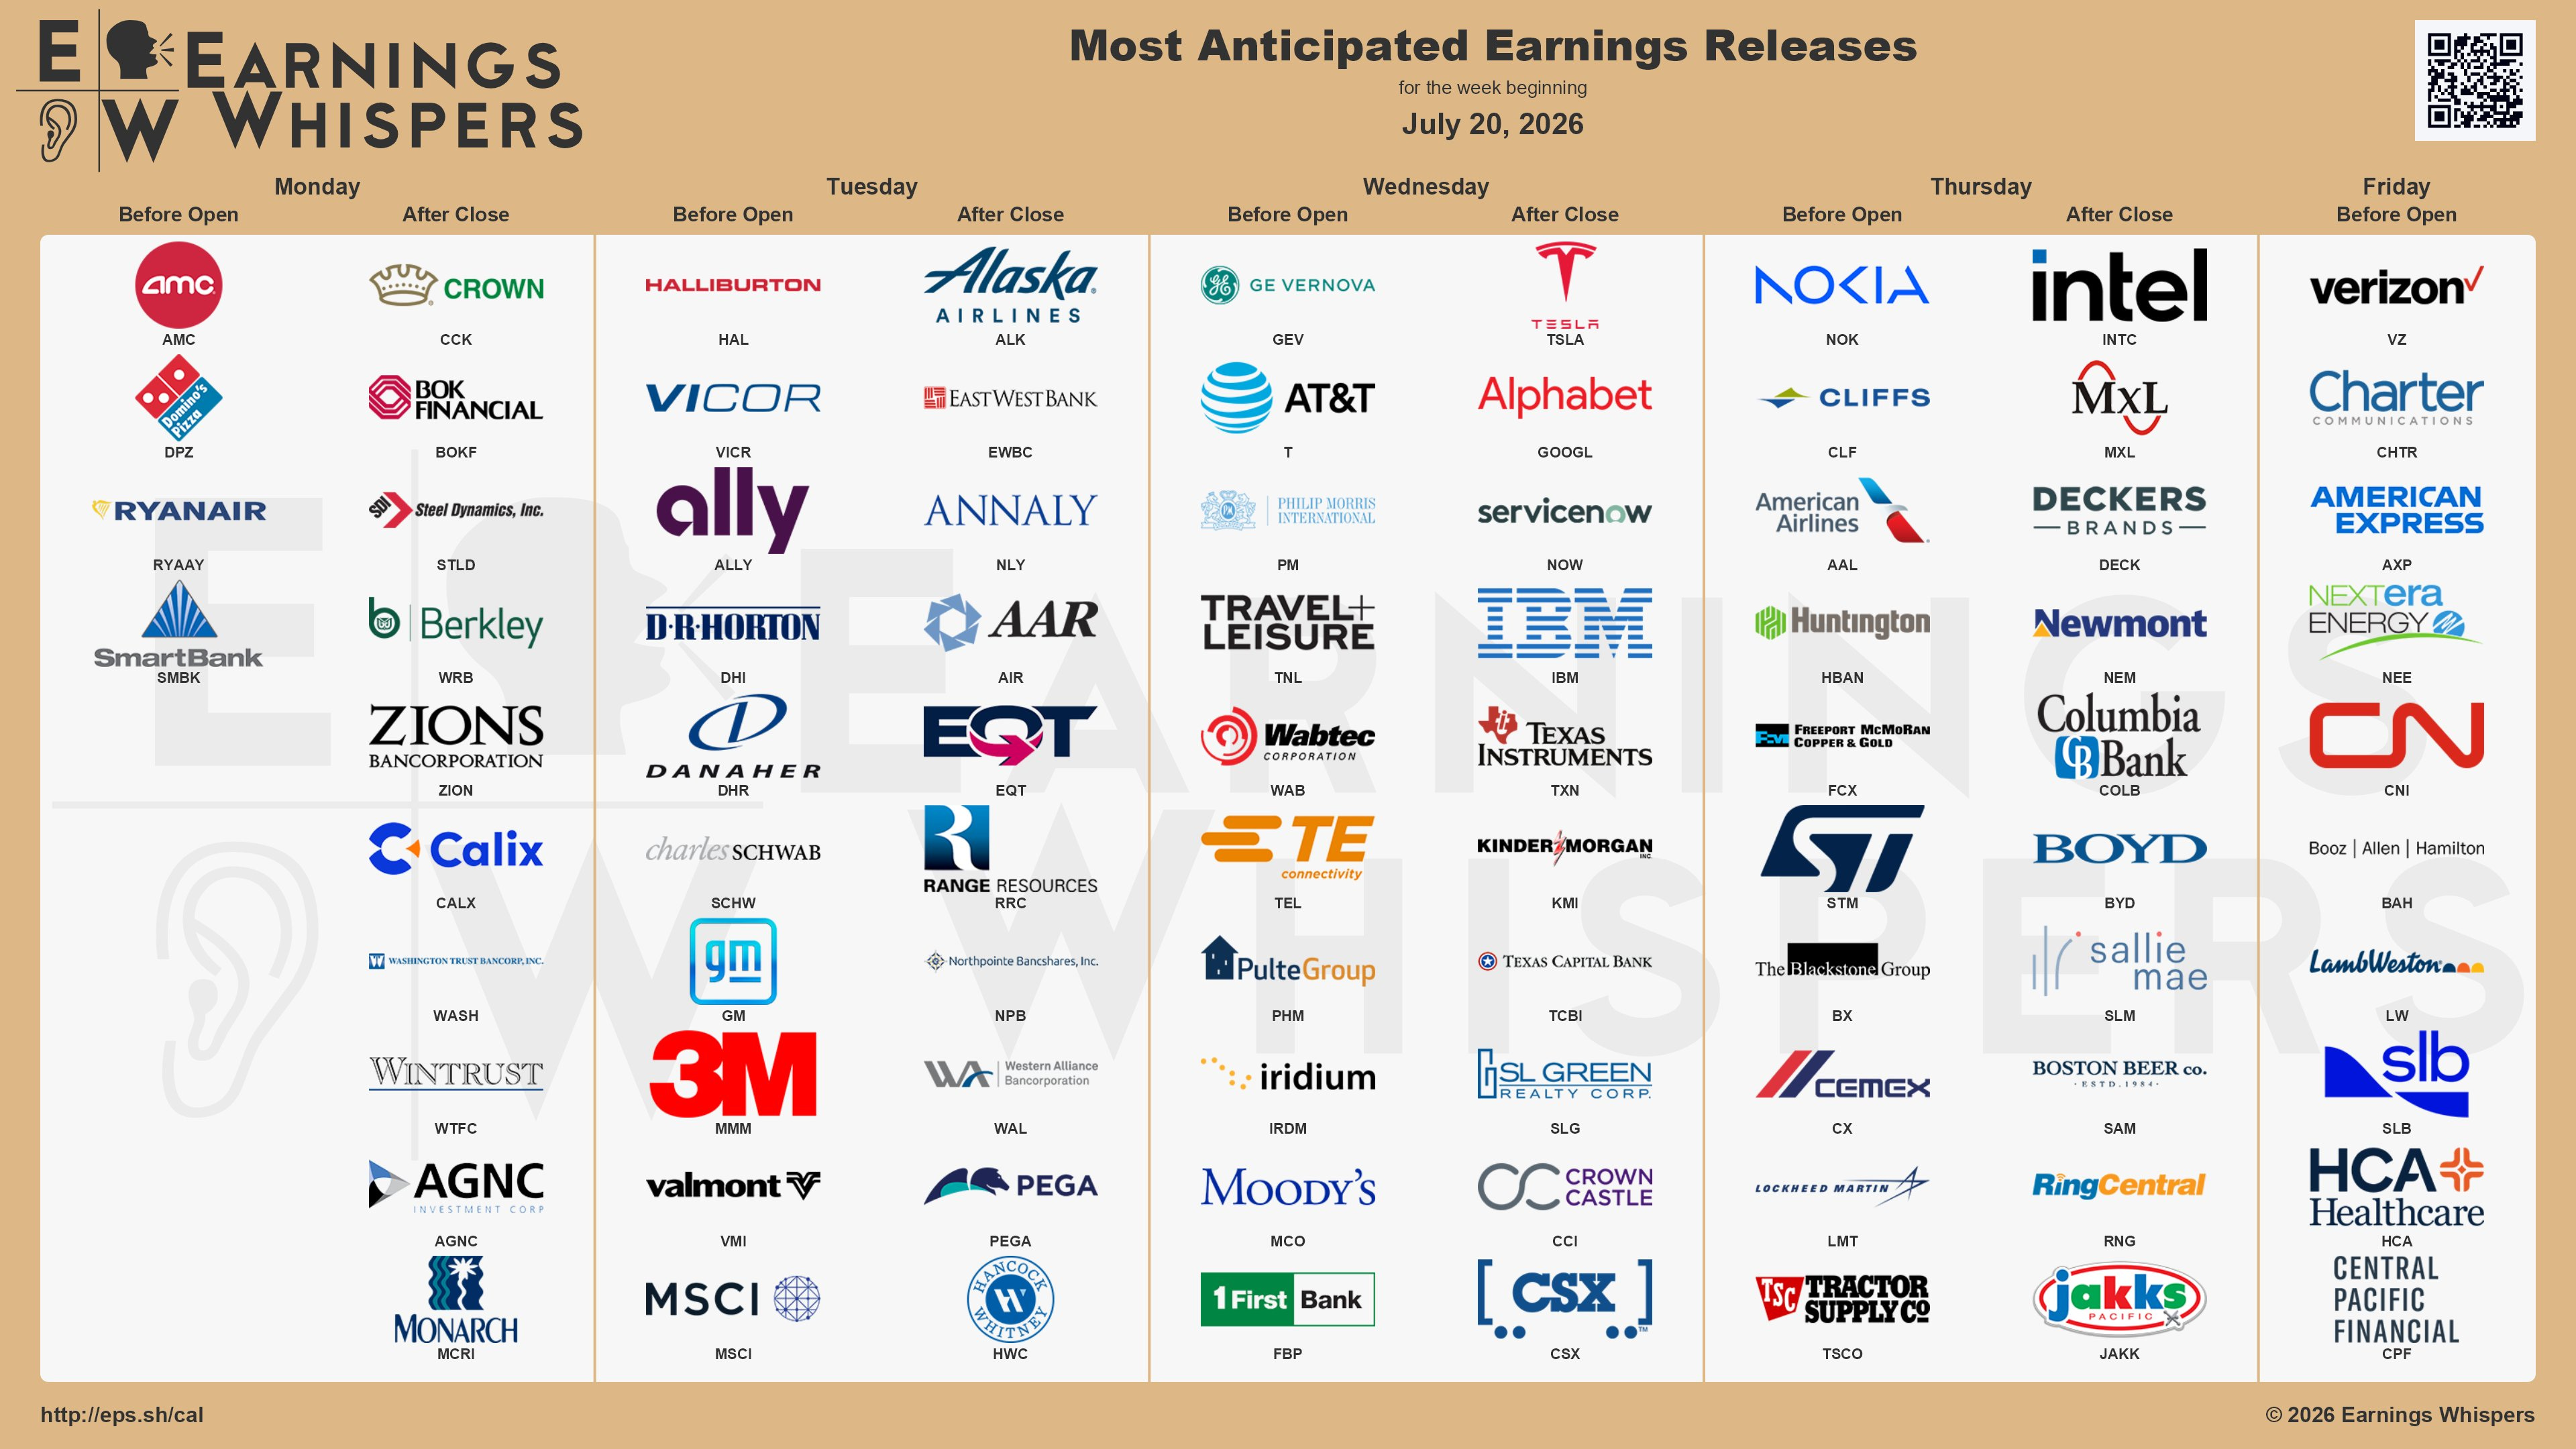
Earnings Whispers
Market Structure
🟨 Daily: BALANCE → 13-day → High: 7626.25 / Low: 7469.50
🟨 Weekly: BALANCE → 9-week → High: 7648.75 / Low: 7247.25
🟩 Monthly: OTFU → Ends at: 7247.25
Balance: A market condition where price consolidates within a defined range, reflecting indecision as the market awaits more market-generated information. We apply balance guidelines, favoring fade trades at range extremes (highs/lows) and preparing for breakout setups if balance resolves.
One-Time Framing Up (OTFU): A market condition where each subsequent bar forms a higher low, signaling a strong upward trend.
One-Time Framing Down (OTFD): A market condition where each subsequent bar forms a lower high, signaling a strong downward trend.
Contextual Analysis & Plan
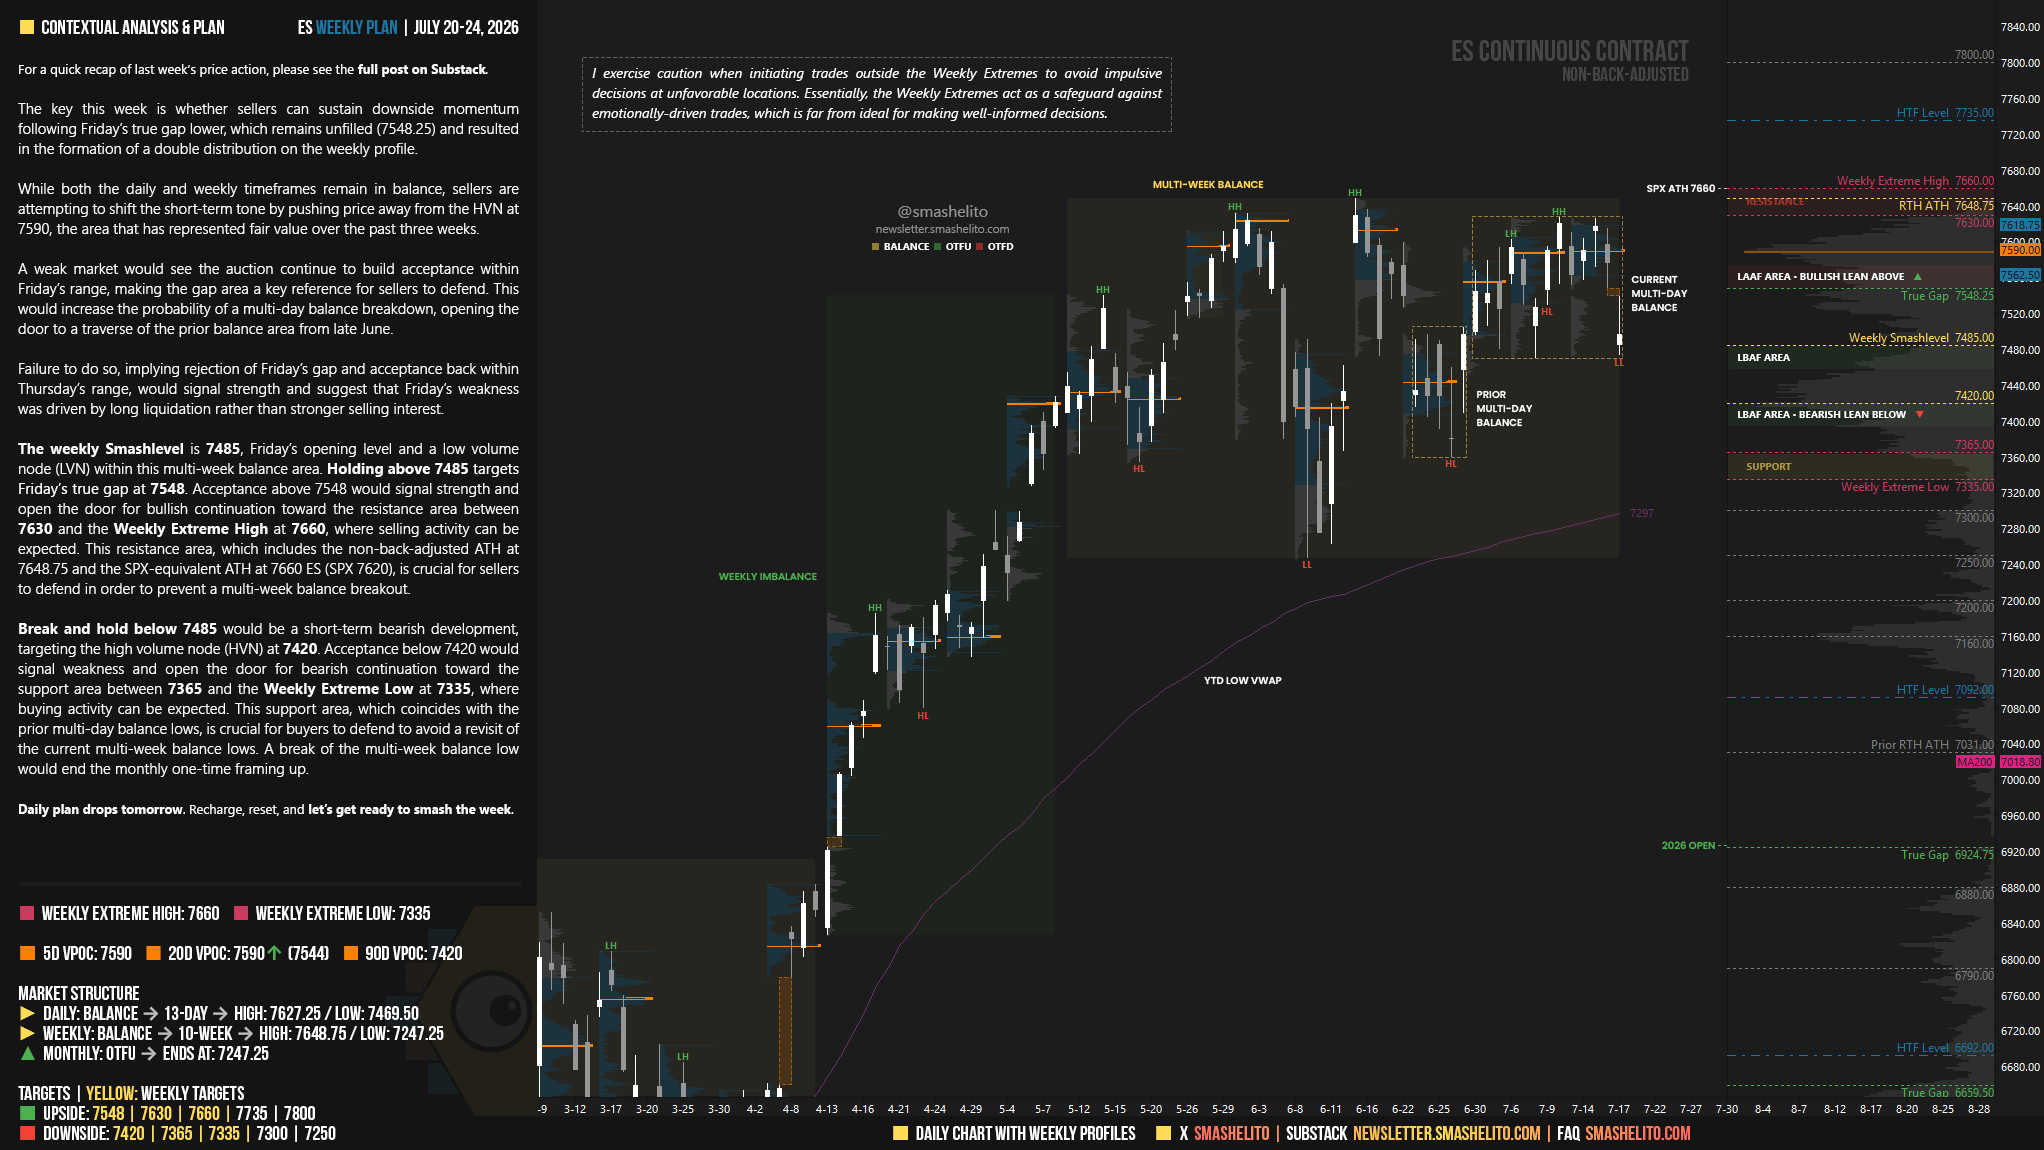
The key this week is whether sellers can sustain downside momentum following Friday’s true gap lower, which remains unfilled (7548.25) and resulted in the formation of a double distribution on the weekly profile.
While both the daily and weekly timeframes remain in balance, sellers are attempting to shift the short-term tone by pushing price away from the HVN at 7590, the area that has represented fair value over the past three weeks.
A weak market would see the auction continue to build acceptance within Friday’s range, making the gap area a key reference for sellers to defend. This would increase the probability of a multi-day balance breakdown, opening the door to a traverse of the prior balance area from late June.
Failure to do so, implying rejection of Friday’s gap and acceptance back within Thursday’s range, would signal strength and suggest that Friday’s weakness was driven by long liquidation rather than stronger selling interest.
The weekly Smashlevel is 7485, Friday’s opening level and a low volume node (LVN) within this multi-week balance area. Holding above 7485 targets Friday’s true gap at 7548. Acceptance above 7548 would signal strength and open the door for bullish continuation toward the resistance area between 7630 and the Weekly Extreme High at 7660, where selling activity can be expected.
This resistance area, which includes the non-back-adjusted ATH at 7648.75 and the SPX-equivalent ATH at 7660 ES (SPX 7620), is crucial for sellers to defend in order to prevent a multi-week balance breakout.
Break and hold below 7485 would be a short-term bearish development, targeting the high volume node (HVN) at 7420. Acceptance below 7420 would signal weakness and open the door for bearish continuation toward the support area between 7365 and the Weekly Extreme Low at 7335, where buying activity can be expected.
This support area, which coincides with the prior multi-day balance lows, is crucial for buyers to defend to avoid a revisit of the current multi-week balance lows. A break of the multi-week balance low would end the monthly one-time framing up.
Visual Representation
Key Levels of Interest
In the upcoming week, I will closely observe the behavior around 7485.
Holding above 7485 would target 7548 / 7630 / 7660* / 7735 / 7800
Break and hold below 7485 would target 7420 / 7365 / 7335* / 7300 / 7250
*Weekly Extremes (defined by proprietary models). I exercise caution when initiating trades outside the Weekly Extremes to avoid impulsive decisions at unfavorable locations. Essentially, the Weekly Extremes act as a safeguard against emotionally-driven trades, which is far from ideal for making well-informed decisions.
Daily plan drops tomorrow. Recharge, reset, and let’s get ready to smash the week.
The image representing the two balances, the 12 and the 5, is impeccable. What an effective way to see market conditions! Thank you so much for how you structure the auction; you're a genius!
Thank you! All your analysis has been very helpful!