
ES Weekly Plan | July 14-18, 2025
Recap, Market Context & Key Levels for the Week Ahead
Welcome to this week’s plan. Inside, you’ll find a quick review of last week’s price action, key economic events, market structure, context for the week ahead, and the levels I’ll be focusing on. Let’s get prepared.
Contents
Last Week’s Recap
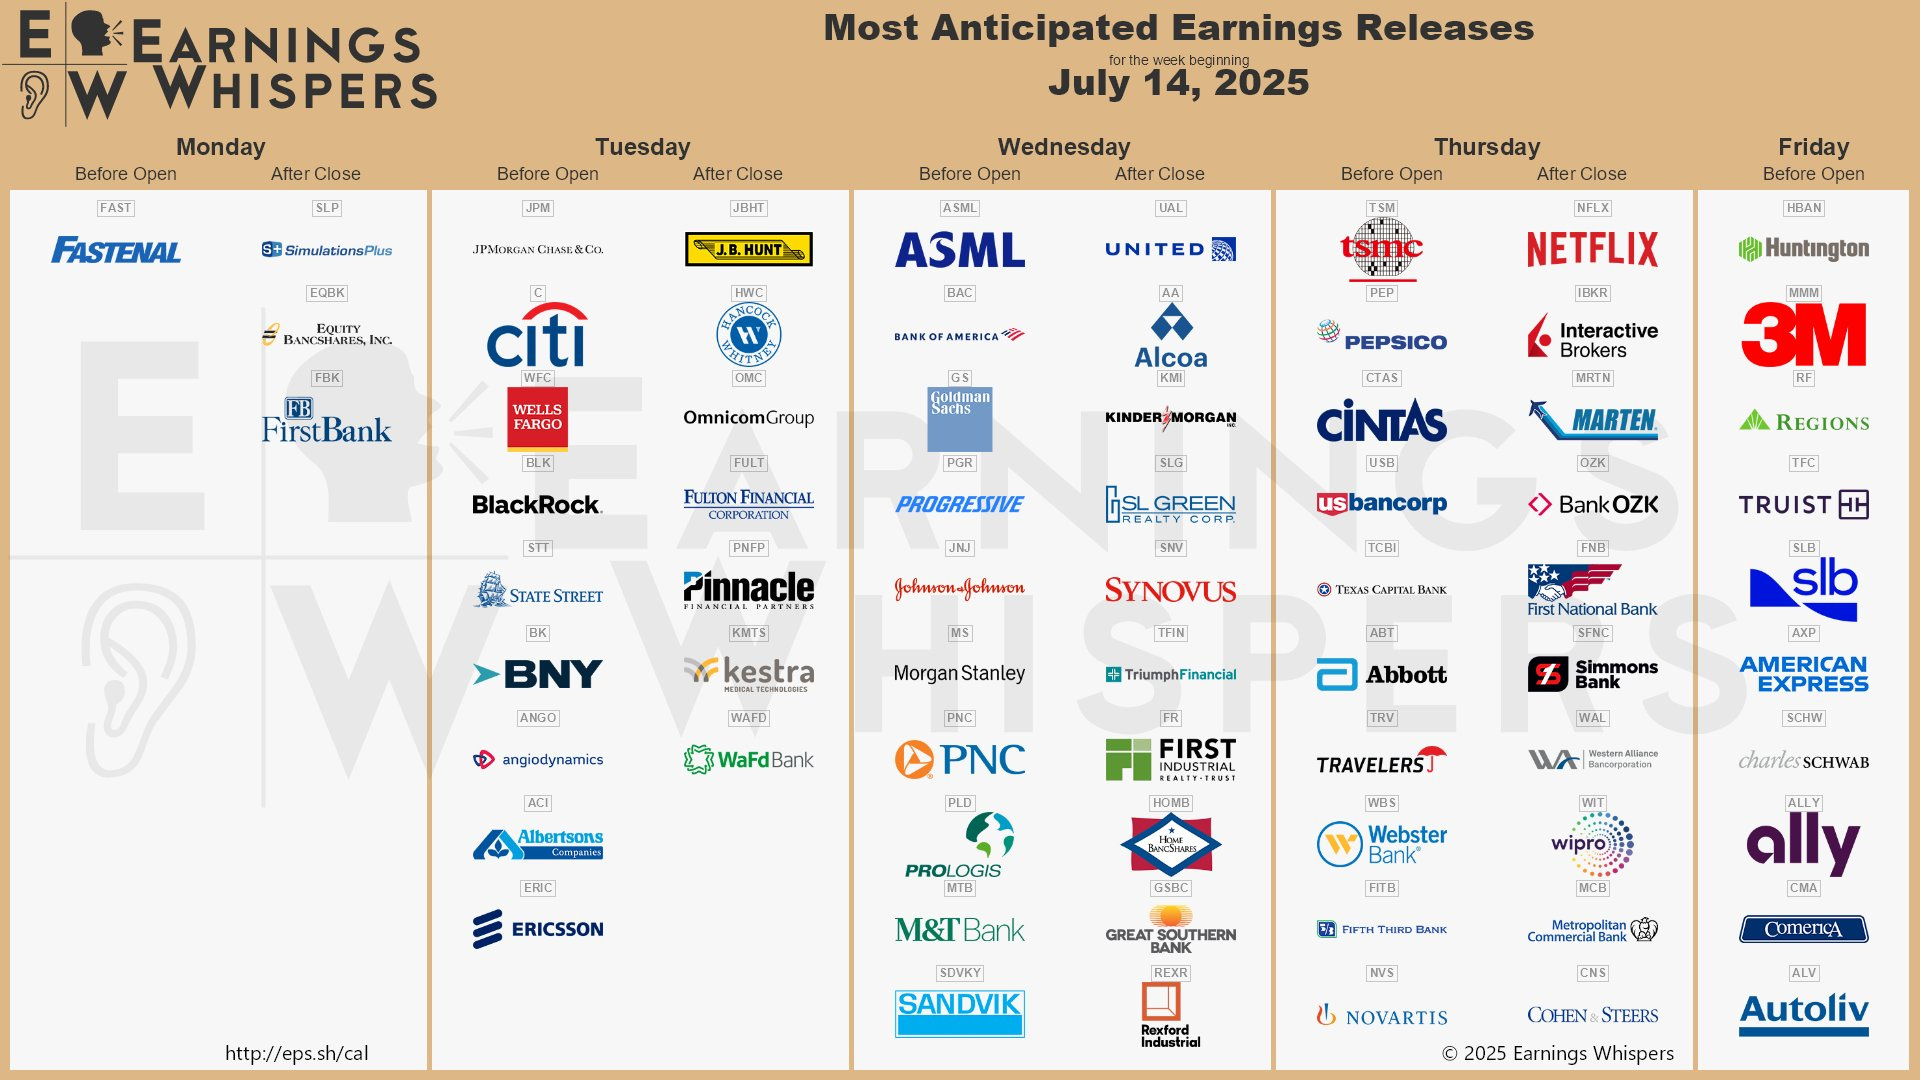
Economic & Earnings Calendar
Market Structure
Contextual Analysis & Plan
Levels of Interest
Last Week’s Recap
Last week’s plan: ES Weekly Plan | July 7-11, 2025
Heading into last week, the main focus was on whether buyers could sustain upside momentum following Thursday’s true gap up, which printed a new all-time high at 6333.25. The key was to monitor the weakness that emerged during Friday’s holiday session.
On Monday, sellers built on that weakness, filling Thursday’s gap and testing the prior week’s VPOC at 6245—where responsive buyers emerged. In the process, the daily one-time framing up came to an end, bringing the daily back to balance for the first time since breaching the prior all-time high at 6166.50.
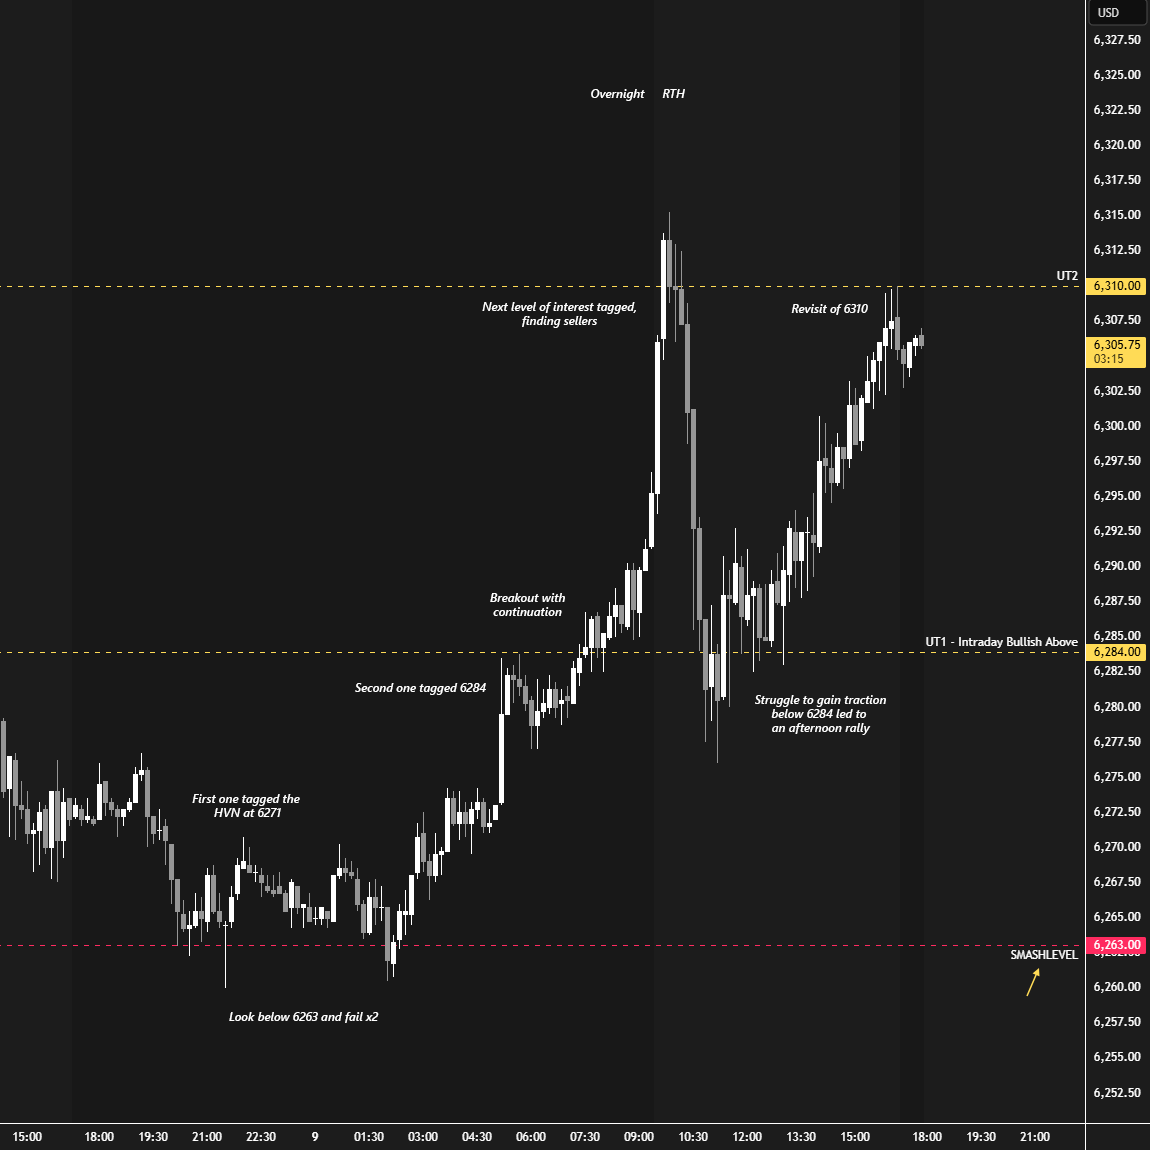
Tuesday’s session was rather uneventful, forming an inside day that traded entirely within Monday’s value area. Inside days are a form of short-term balance, so heading into Wednesday’s session, the key was to monitor its extremes and trade the break of the balance—rather than be active within the range. The overnight session saw a look-below-and-fail of the inside day low (Smashlevel: 6263), triggering a 50-handle reversal (see Figure 1).
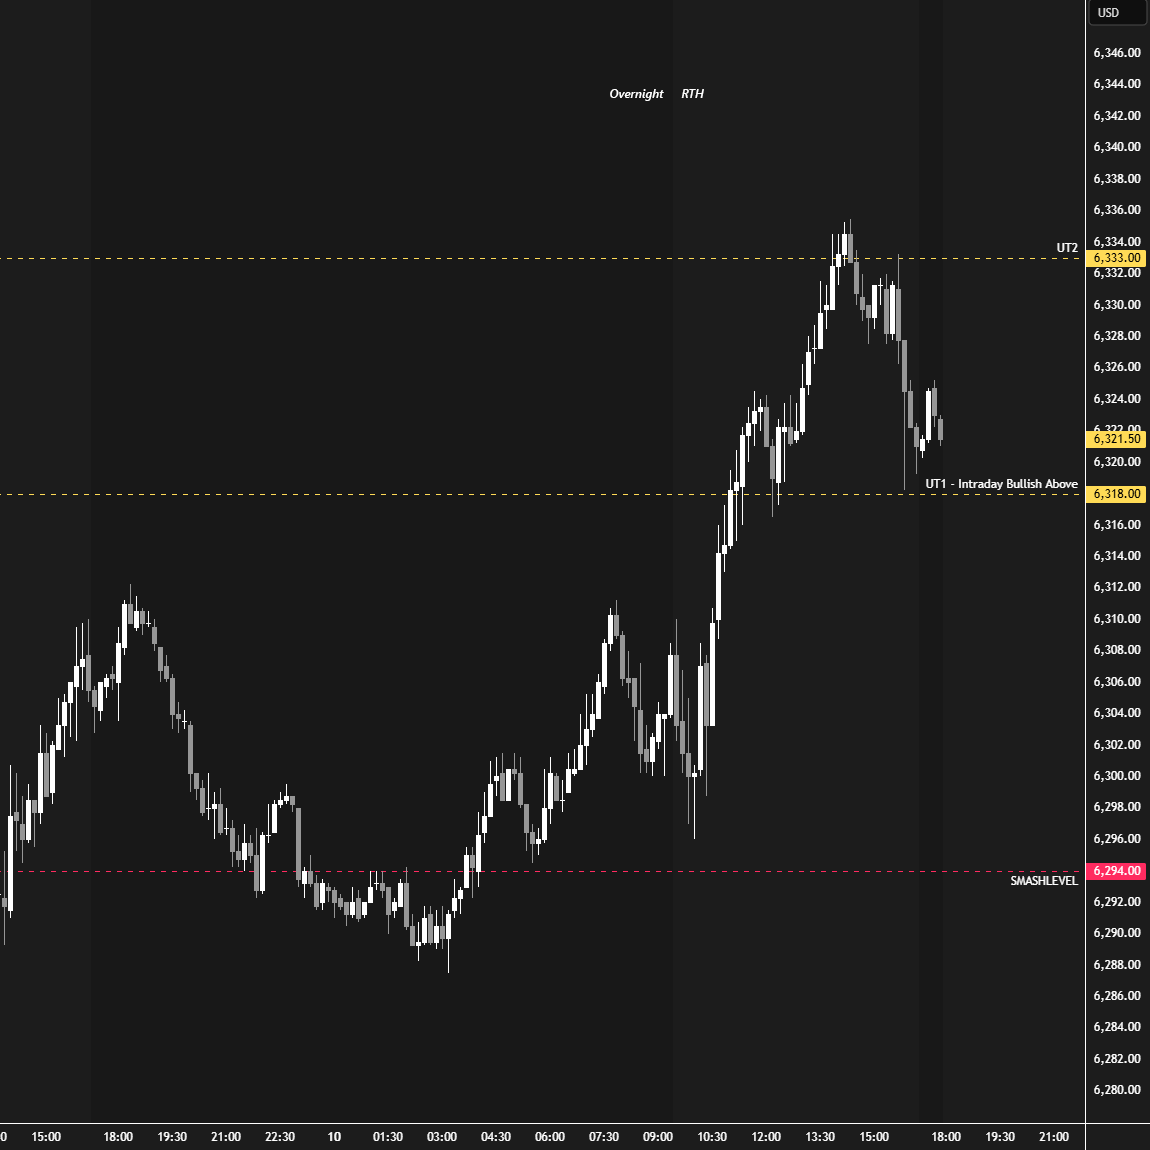
The weakness observed on Monday and Tuesday failed to attract additional downside pressure and instead resulted in two days of value being trapped after Wednesday’s closing strength. Heading into Thursday, a strong market was expected to defend 6294 (the Smashlevel), keeping Monday’s and Tuesday’s value trapped—opening the door for new all-time highs. A look-below-and-fail of 6294 ultimately led to new all-time highs (see Figure 2), forming a double distribution trend day in the process.
Friday’s session negated Thursday’s trend day after a news-driven liquidation overnight, ultimately closing within Thursday’s lower distribution. A brief recap of the session is available here, highlighting a beautiful absorption reversal.
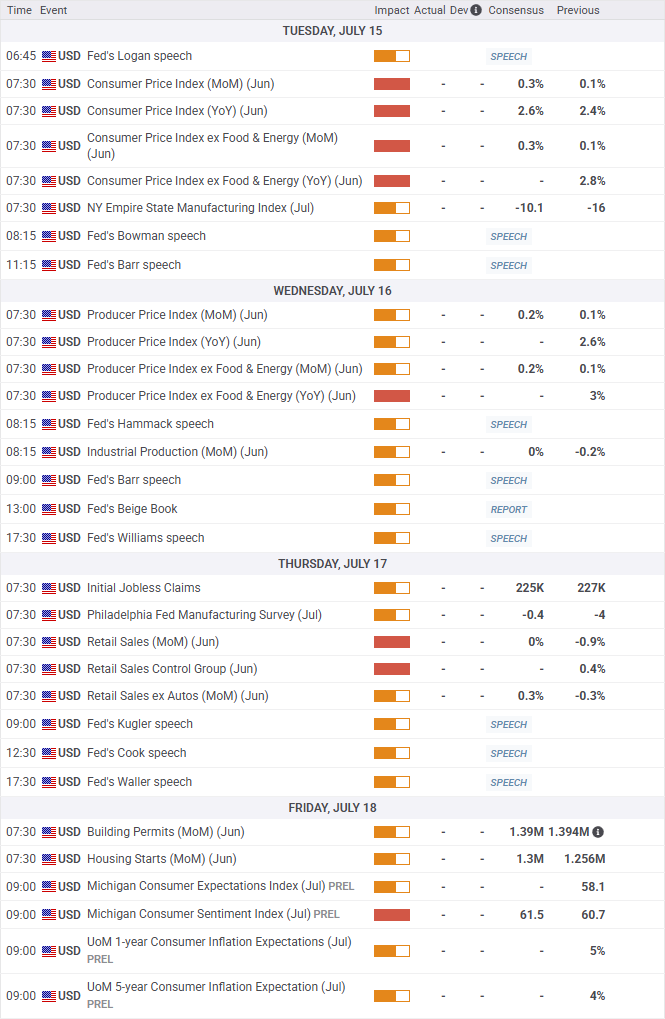
Economic & Earnings Calendar
Market Structure
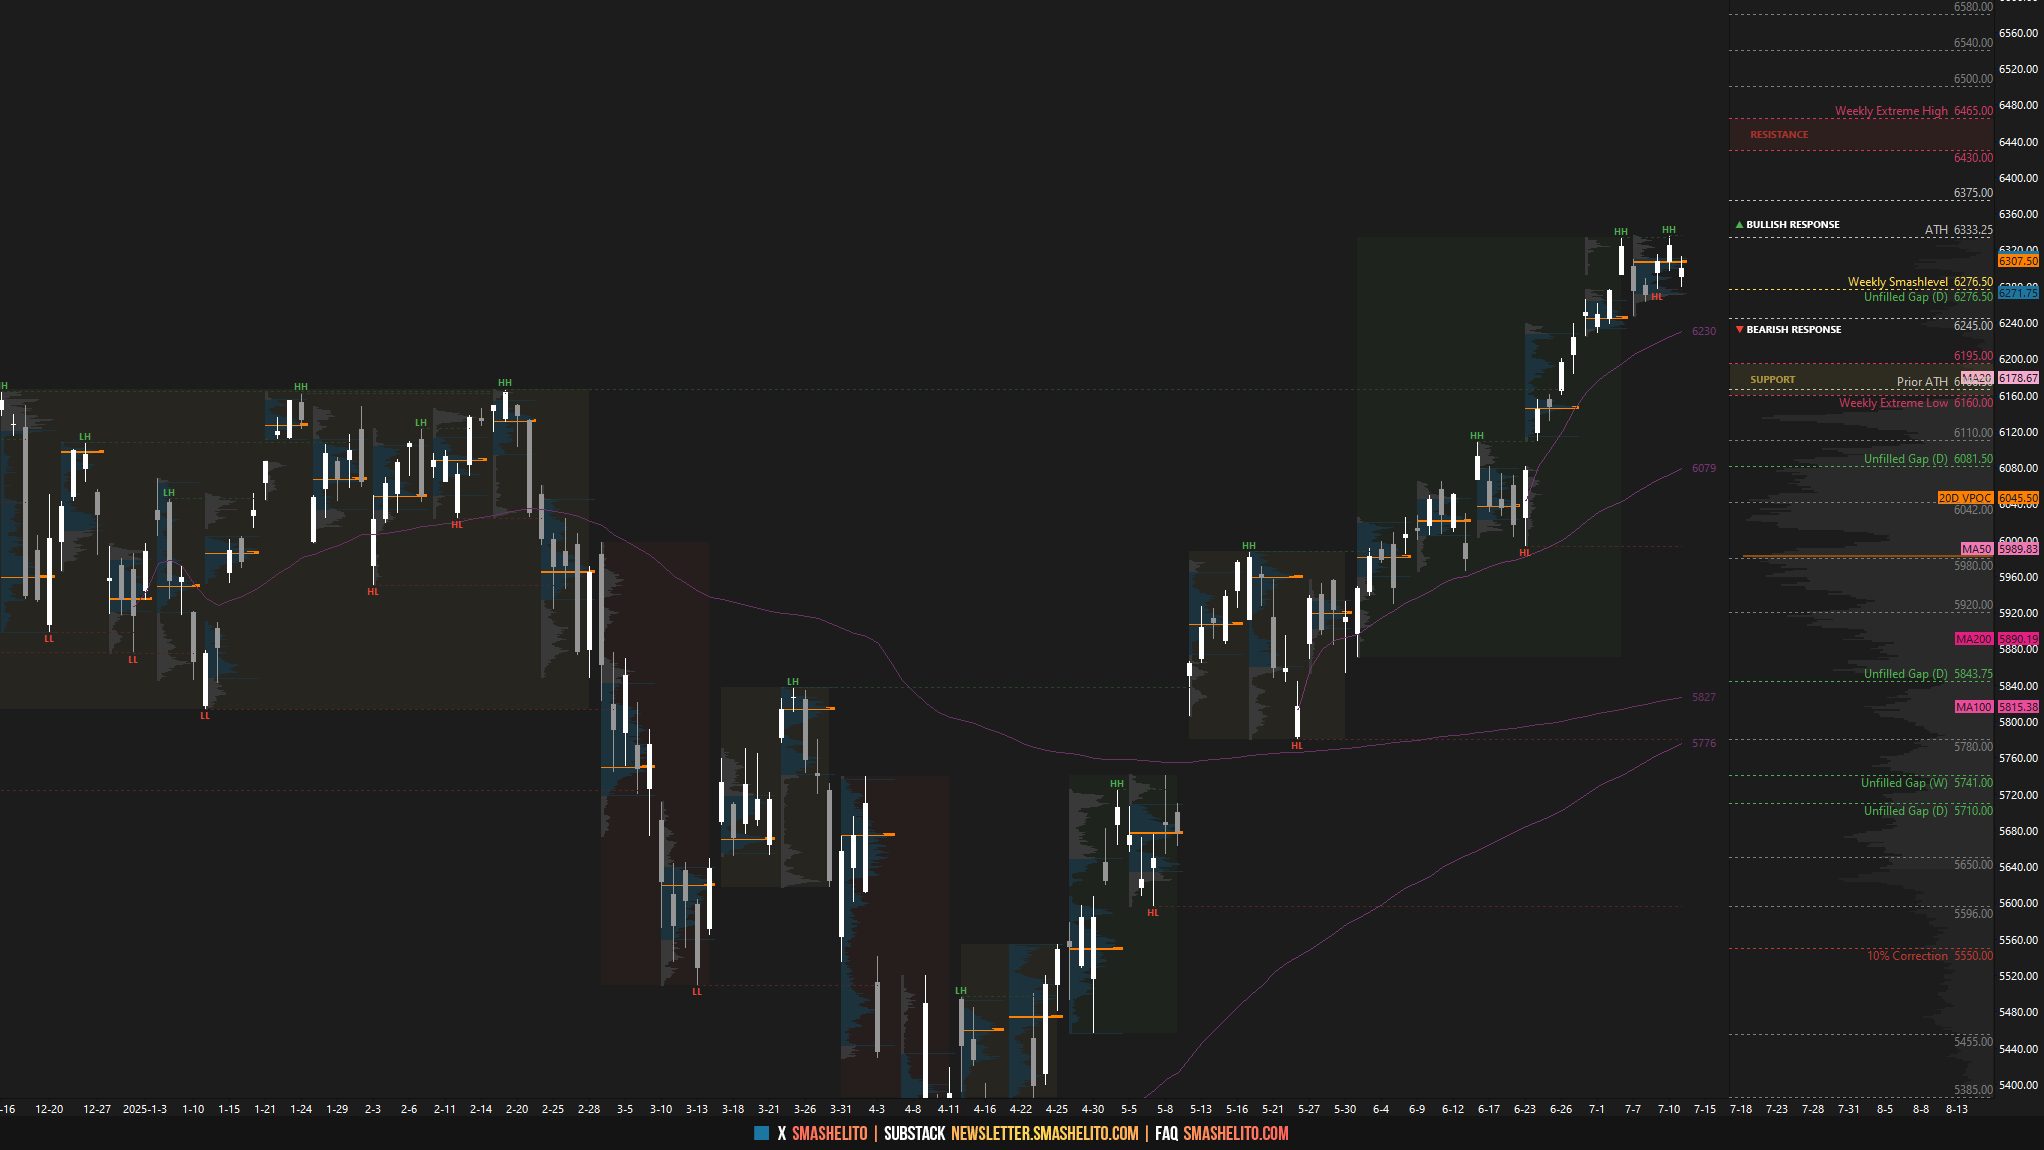
🟨 Daily: BALANCE → 6-Day → High: 6335.50 / Low: 6246.25
🟩 Weekly: OTFU → Ends at: 6246.25
🟩 Monthly: OTFU → Ends at: 5870.50
Balance: A market condition where price consolidates within a defined range, reflecting indecision as the market awaits more market-generated information. We apply balance guidelines—favoring fade trades at range extremes (highs/lows) and preparing for breakout setups if balance resolves.
One-Time Framing Up (OTFU): A market condition where each subsequent bar forms a higher low, signaling a strong upward trend.
One-Time Framing Down (OTFD): A market condition where each subsequent bar forms a lower high, signaling a strong downward trend.
Contextual Analysis & Plan
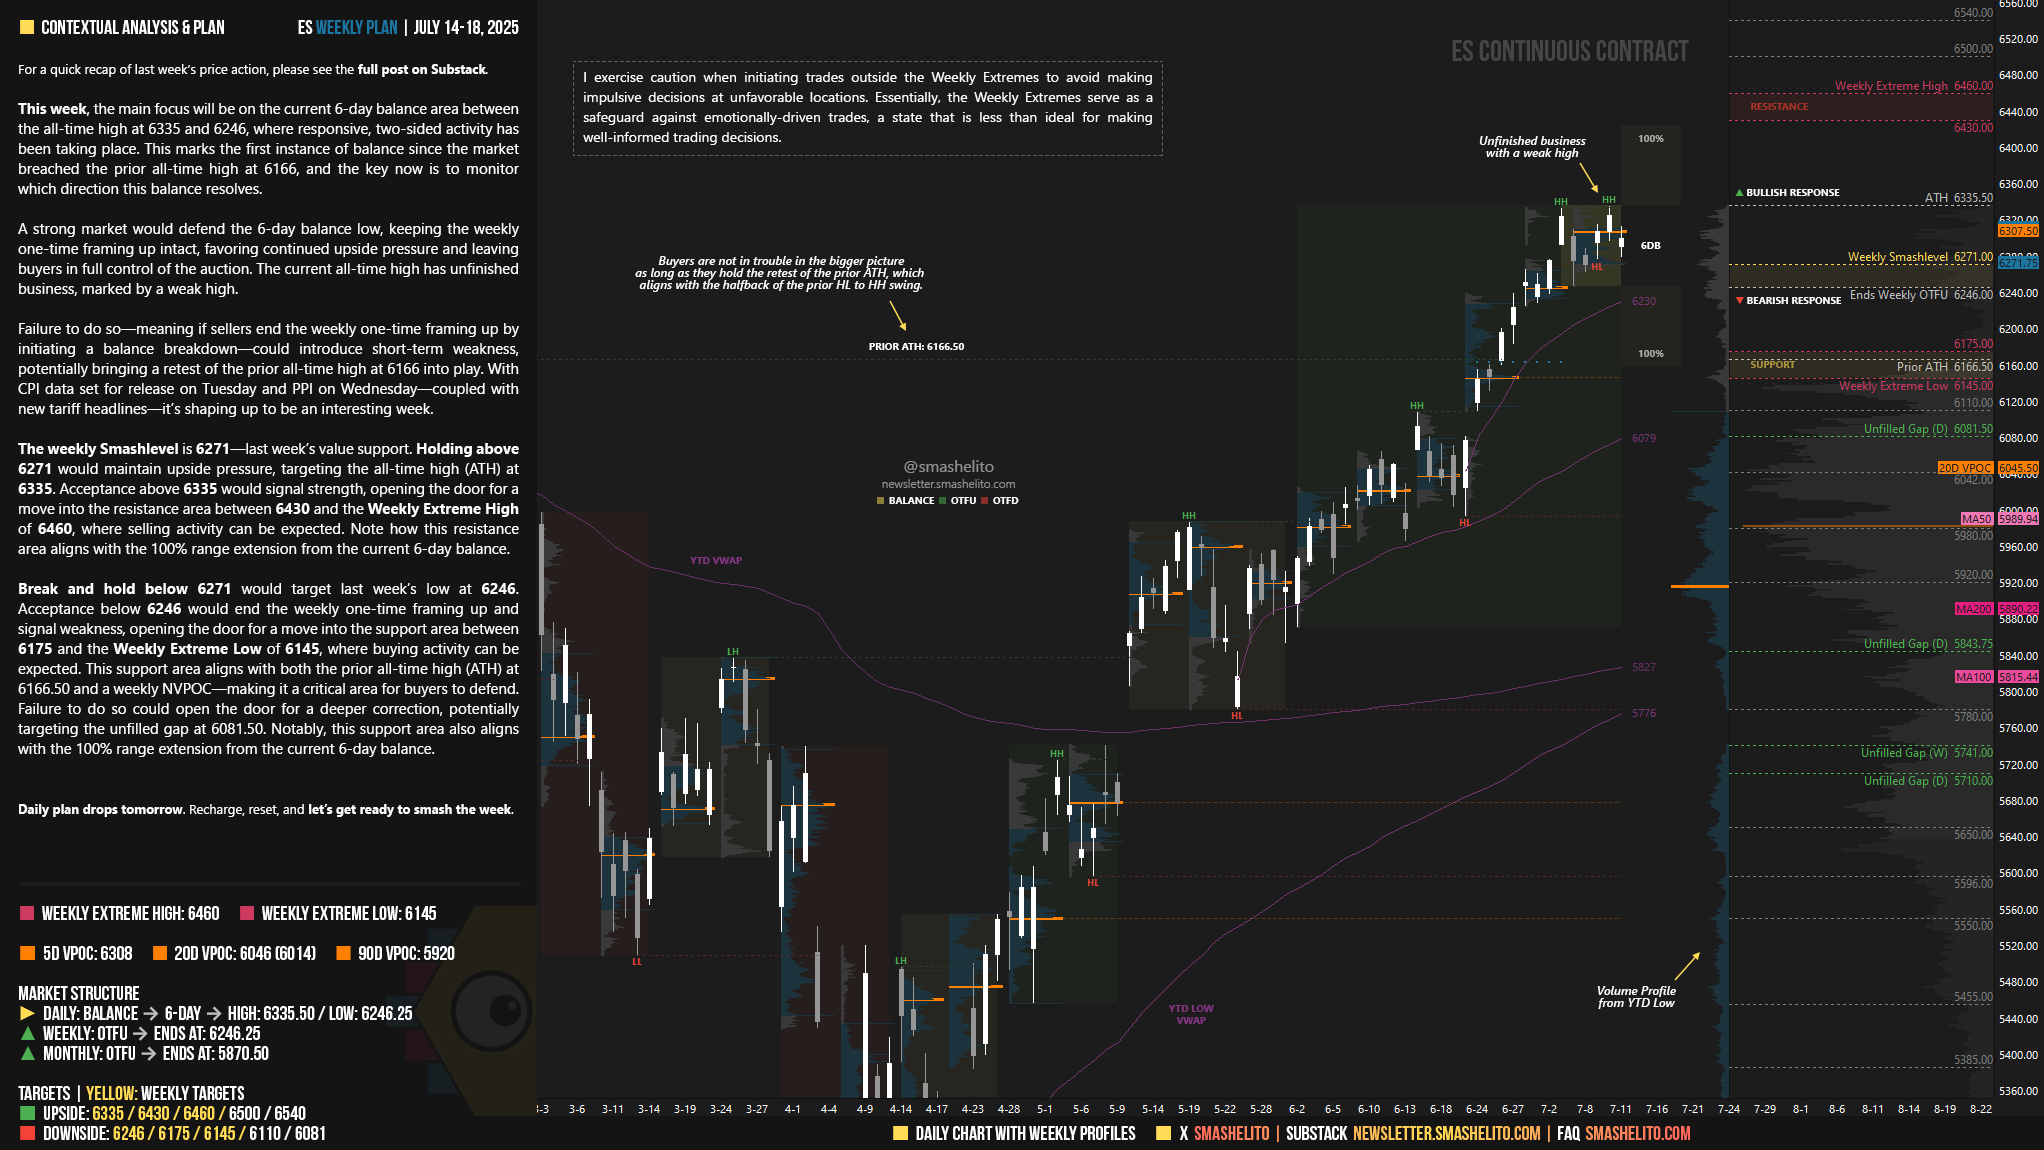
This week, the main focus will be on the current 6-day balance area between the all-time high at 6335 and 6246, where responsive, two-sided activity has been taking place. This marks the first instance of balance since the market breached the prior all-time high at 6166, and the key now is to monitor which direction this balance resolves.
A strong market would defend the 6-day balance low, keeping the weekly one-time framing up intact, favoring continued upside pressure and leaving buyers in full control of the auction. The current all-time high has unfinished business, marked by a weak high.
Failure to do so—meaning if sellers end the weekly one-time framing up by initiating a balance breakdown—could introduce short-term weakness, potentially bringing a retest of the prior all-time high at 6166 into play. With CPI data set for release on Tuesday and PPI on Wednesday—coupled with new tariff headlines—it’s shaping up to be an interesting week.
The weekly Smashlevel is 6271—last week’s value support. Holding above 6271 would maintain upside pressure, targeting the all-time high (ATH) at 6335. Acceptance above 6335 would signal strength, opening the door for a move into the resistance area between 6430 and the Weekly Extreme High of 6460, where selling activity can be expected. Note how this resistance area aligns with the 100% range extension from the current 6-day balance.
Break and hold below 6271 would target last week’s low at 6246. Acceptance below 6246 would end the weekly one-time framing up and signal weakness, opening the door for a move into the support area between 6175 and the Weekly Extreme Low of 6145, where buying activity can be expected. This support area aligns with both the prior all-time high (ATH) at 6166.50 and a weekly NVPOC—making it a critical area for buyers to defend. Failure to do so could open the door for a deeper correction, potentially targeting the unfilled gap at 6081.50. Notably, this support area also aligns with the 100% range extension from the current 6-day balance.
Levels of Interest
In the upcoming week, I will closely observe the behavior around 6271.
Holding above 6271 would target 6335 / 6430 / 6460* / 6500 / 6540
Break and hold below 6271 would target 6246 / 6175 / 6145* / 6110 / 6081
*Weekly Extremes. I exercise caution when initiating trades outside the Weekly Extremes to avoid making impulsive decisions at unfavorable locations. Essentially, the Weekly Extremes serve as a safeguard against emotionally-driven trades, a state that is less than ideal for making well-informed trading decisions.
Daily plan drops tomorrow. Recharge, reset, and let’s get ready to smash the week.
Thank you Smash!
¡Gracias Smash! Un gran análisis.
A por la próxima semana 🚀