
ES Weekly Plan | January 27-31, 2025
My expectations for the upcoming week.

Visual Representation
Economic Calendar
Earnings Calendar
Market Structure
🟩 DAILY: OTFU | ENDS: 6122
🟨 WEEKLY: BALANCE | 6W | 6163.75-5813
🟨 MONTHLY: BALANCE | TBD
Contextual Analysis
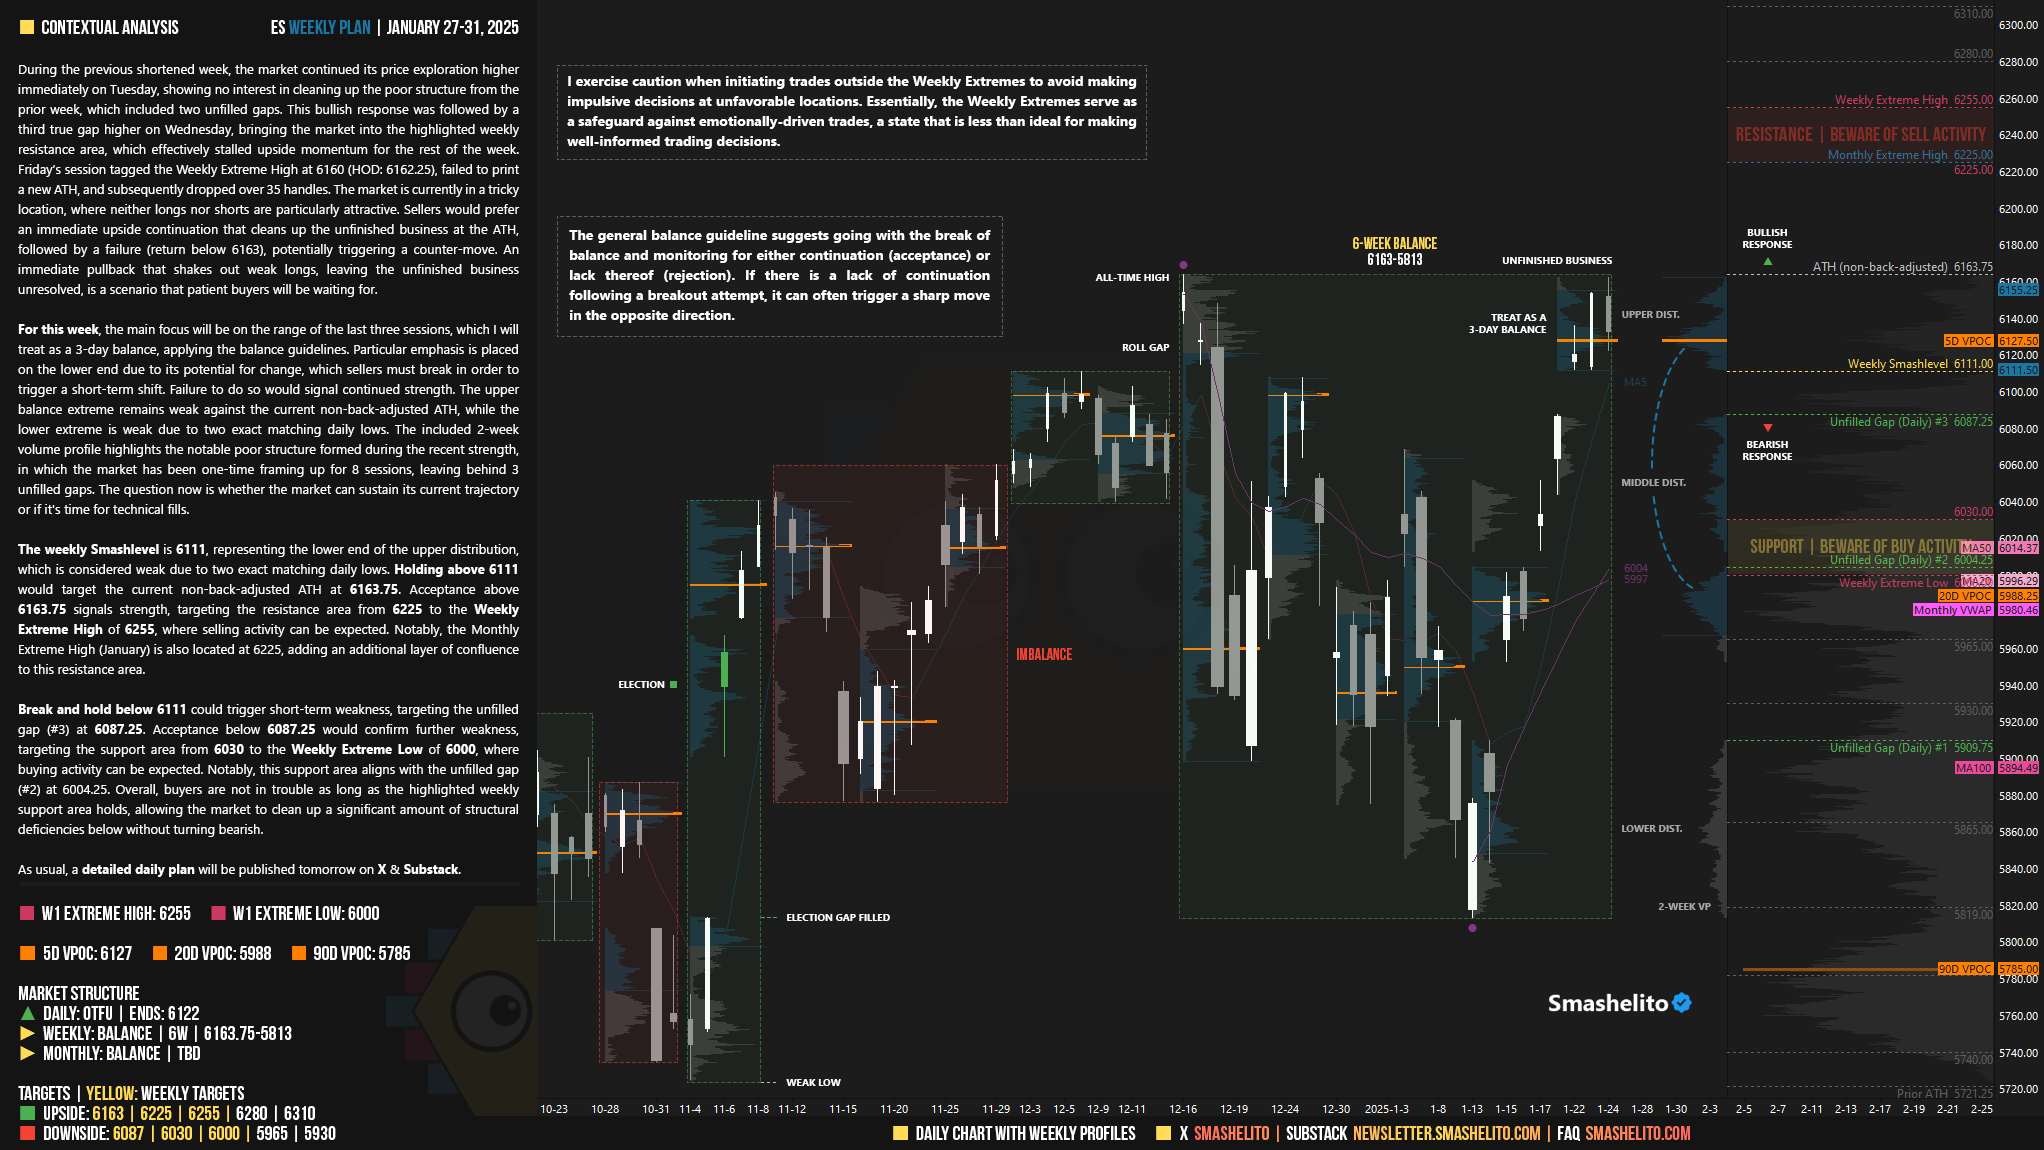
During the previous shortened week, the market continued its price exploration higher immediately on Tuesday, showing no interest in cleaning up the poor structure from the prior week, which included two unfilled gaps. This bullish response was followed by a third true gap higher on Wednesday, bringing the market into the highlighted weekly resistance area, which effectively stalled upside momentum for the rest of the week. Friday’s session tagged the Weekly Extreme High at 6160 (HOD: 6162.25), failed to print a new ATH, and subsequently dropped over 35 handles. The market is currently in a tricky location, where neither longs nor shorts are particularly attractive. Sellers would prefer an immediate upside continuation that cleans up the unfinished business at the ATH, followed by a failure (return below 6163), potentially triggering a counter-move. An immediate pullback that shakes out weak longs, leaving the unfinished business unresolved, is a scenario that patient buyers will be waiting for.

For this week, the main focus will be on the range of the last three sessions, which I will treat as a 3-day balance, applying the balance guidelines. Particular emphasis is placed on the lower end due to its potential for change, which sellers must break in order to trigger a short-term shift. Failure to do so would signal continued strength. The upper balance extreme remains weak against the current non-back-adjusted ATH, while the lower extreme is weak due to two exact matching daily lows. The included 2-week volume profile highlights the notable poor structure formed during the recent strength, in which the market has been one-time framing up for 8 sessions, leaving behind 3 unfilled gaps. The question now is whether the market can sustain its current trajectory or if it's time for technical fills.
The weekly Smashlevel is 6111, representing the lower end of the upper distribution, which is considered weak due to two exact matching daily lows. Holding above 6111 would target the current non-back-adjusted ATH at 6163.75. Acceptance above 6163.75 signals strength, targeting the resistance area from 6225 to the Weekly Extreme High of 6255, where selling activity can be expected. Notably, the Monthly Extreme High (January) is also located at 6225, adding an additional layer of confluence to this resistance area.
Break and hold below 6111 could trigger short-term weakness, targeting the unfilled gap (#3) at 6087.25. Acceptance below 6087.25 would confirm further weakness, targeting the support area from 6030 to the Weekly Extreme Low of 6000, where buying activity can be expected. Notably, this support area aligns with the unfilled gap (#2) at 6004.25. Overall, buyers are not in trouble as long as the highlighted weekly support area holds, allowing the market to clean up a significant amount of structural deficiencies below without turning bearish.
As usual, a detailed daily plan will be published tomorrow. In the meantime, enjoy the rest of your weekend!
Levels of Interest
In the upcoming week, I will closely observe the behavior around 6111.
Holding above 6111 would target 6163 / 6225 / 6255* / 6280 / 6310
Break and hold below 6111 would target 6087 / 6030 / 6000* / 5965 / 5930
*Weekly Extremes. I exercise caution when initiating trades outside the Weekly Extremes to avoid making impulsive decisions at unfavorable locations. Essentially, the Weekly Extremes serve as a safeguard against emotionally-driven trades, a state that is less than ideal for making well-informed trading decisions.
Thanks Smash! Should be an interesting week!
Always awesome