
ES Weekly Plan | January 20-24, 2025
My expectations for the upcoming week.

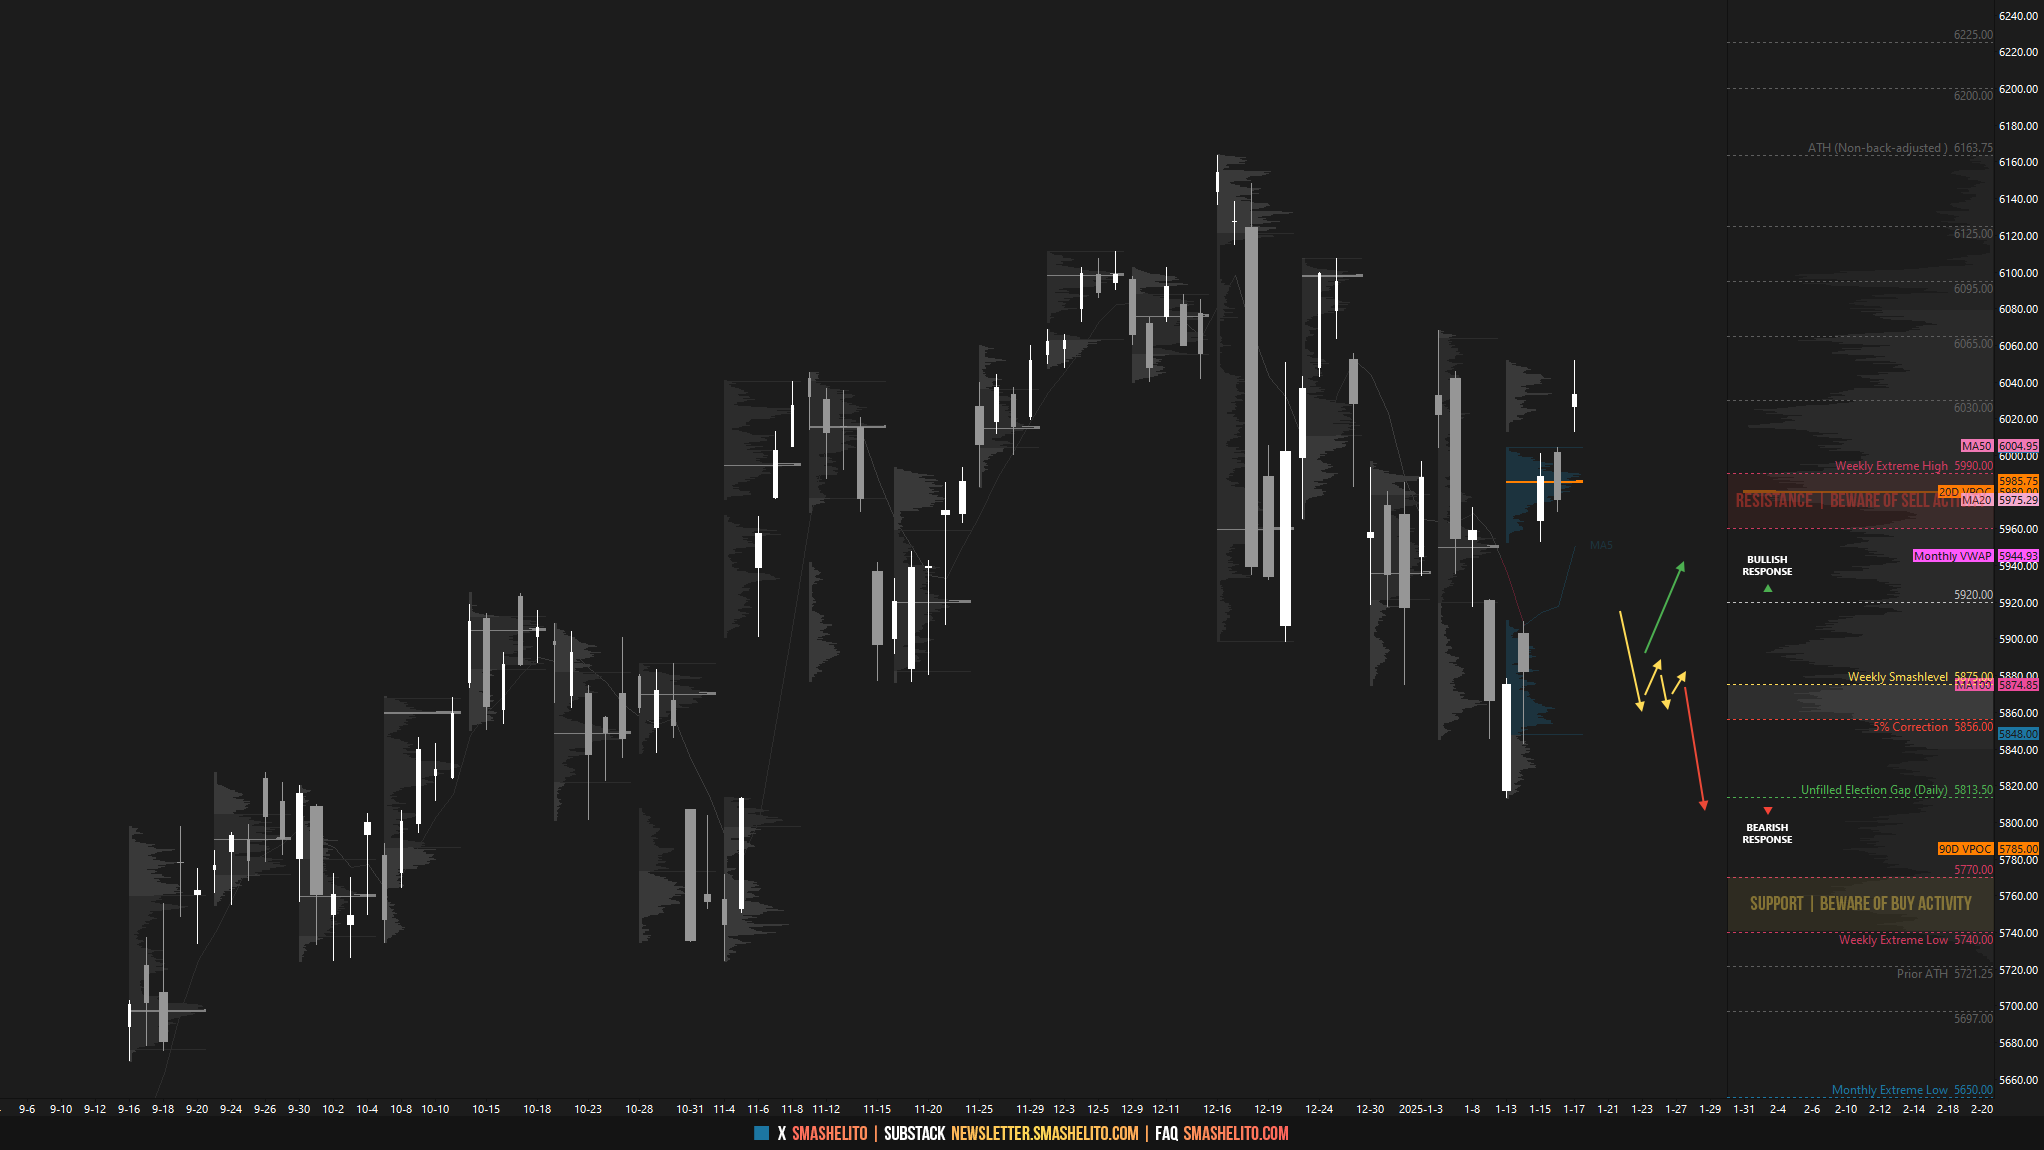
Visual Representation
Economic Calendar

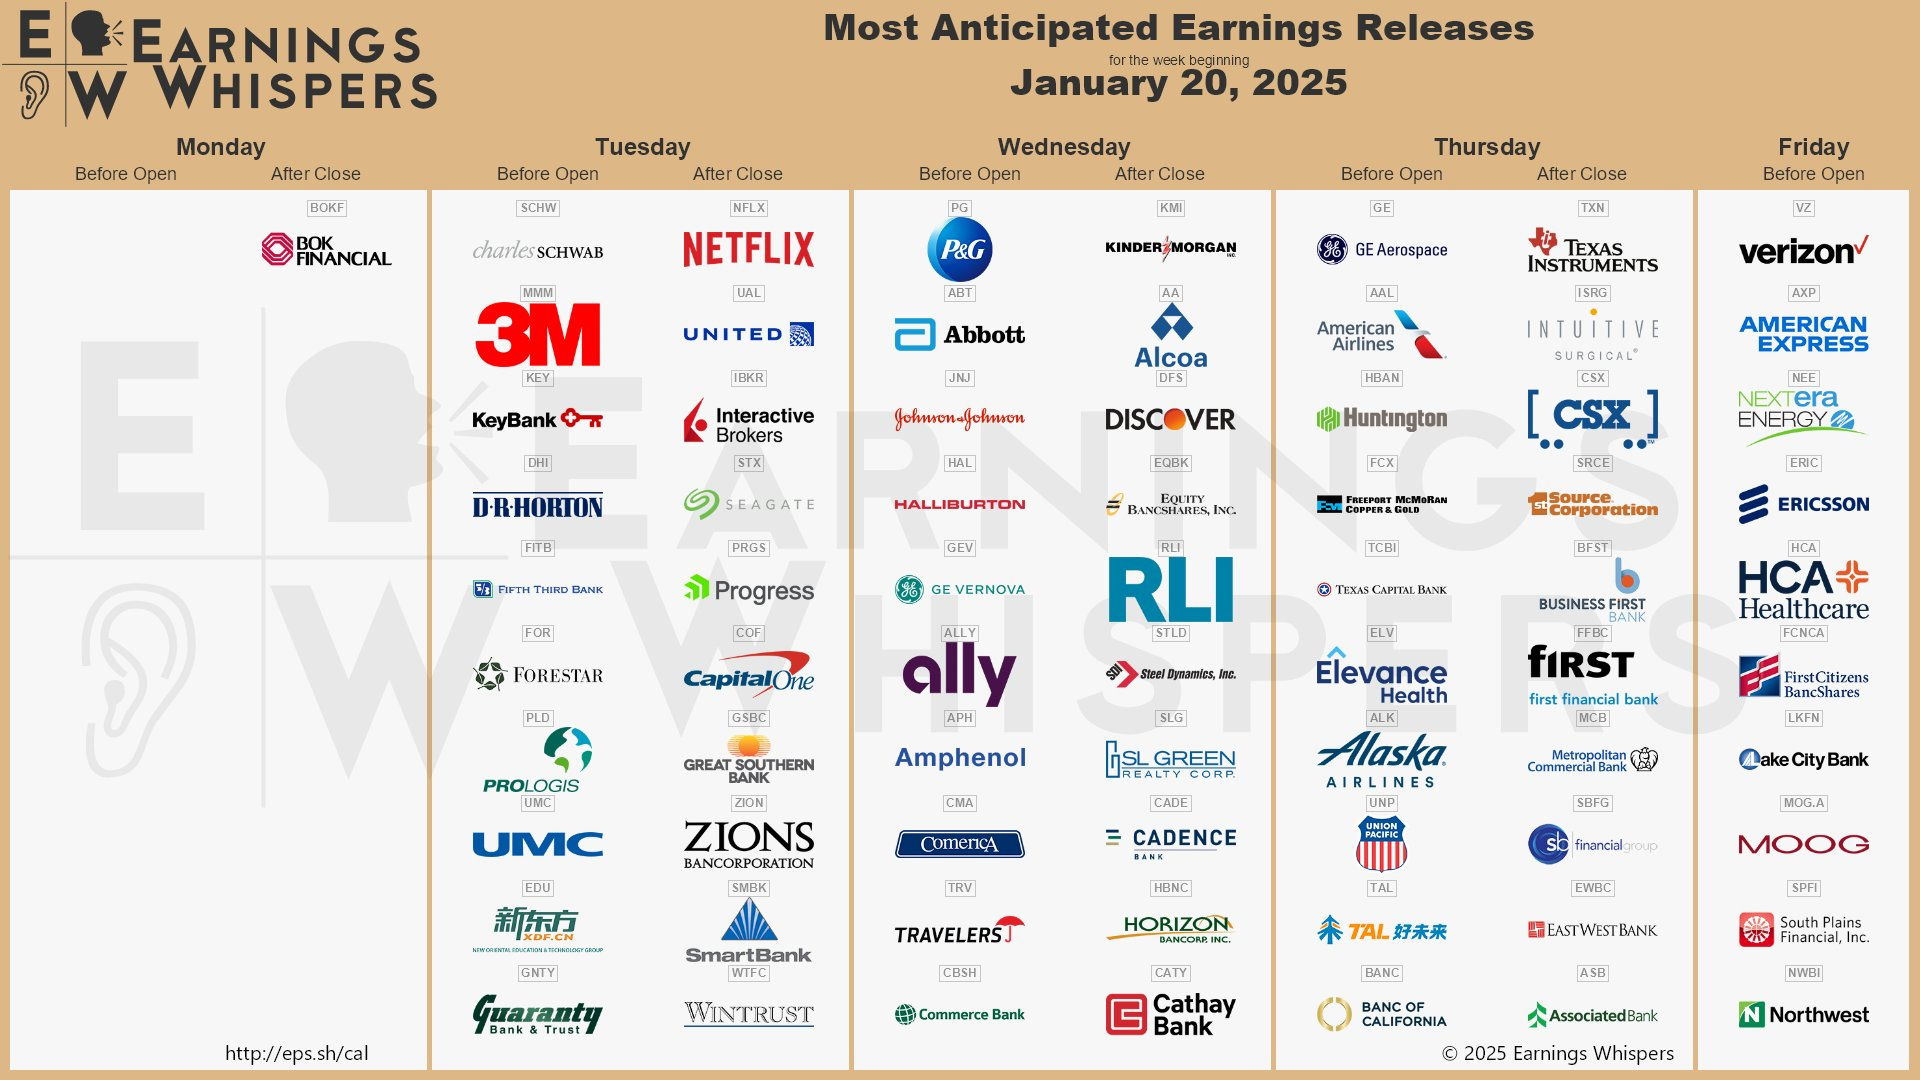
Earnings Calendar
Market Structure
🟩 DAILY: OTFU | ENDS: 6012.75
🟥 WEEKLY: OTFD | ENDS: 6051.50
🟨 MONTHLY: BALANCE | TBD
Contextual Analysis
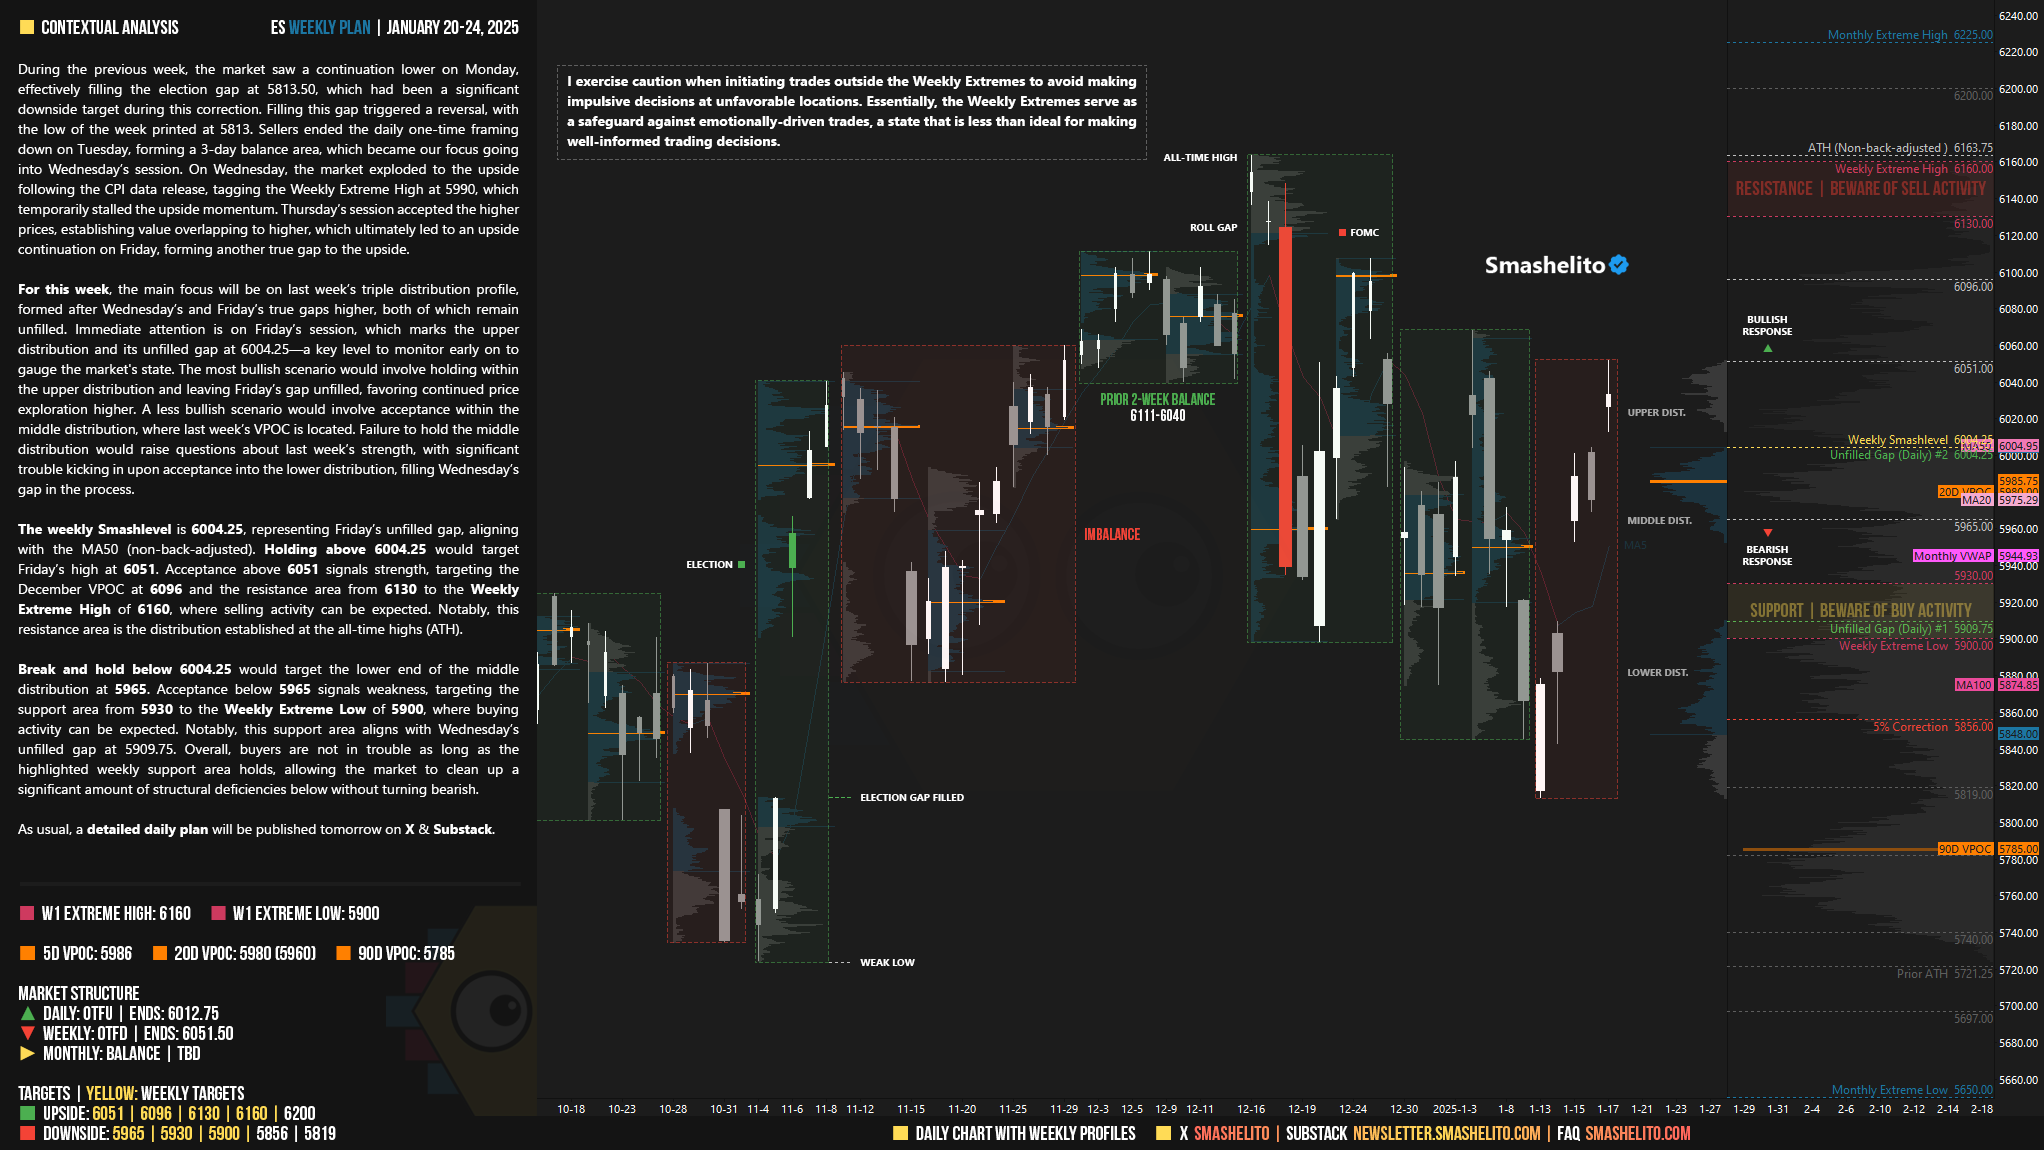
During the previous week, the market saw a continuation lower on Monday, effectively filling the election gap at 5813.50, which had been a significant downside target during this correction. Filling this gap triggered a reversal, with the low of the week printed at 5813. Sellers ended the daily one-time framing down on Tuesday, forming a 3-day balance area, which became our focus going into Wednesday’s session. On Wednesday, the market exploded to the upside following the CPI data release, tagging the Weekly Extreme High at 5990, which temporarily stalled the upside momentum. Thursday’s session accepted the higher prices, establishing value overlapping to higher, which ultimately led to an upside continuation on Friday, forming another true gap to the upside.
For this week, the main focus will be on last week’s triple distribution profile, formed after Wednesday’s and Friday’s true gaps higher, both of which remain unfilled. Immediate attention is on Friday’s session, which marks the upper distribution and its unfilled gap at 6004.25—a key level to monitor early on to gauge the market's state. The most bullish scenario would involve holding within the upper distribution and leaving Friday’s gap unfilled, favoring continued price exploration higher. A less bullish scenario would involve acceptance within the middle distribution, where last week’s VPOC is located. Failure to hold the middle distribution would raise questions about last week’s strength, with significant trouble kicking in upon acceptance into the lower distribution, filling Wednesday’s gap in the process.
The weekly Smashlevel is 6004.25, representing Friday’s unfilled gap, aligning with the MA50 (non-back-adjusted). Holding above 6004.25 would target Friday’s high at 6051. Acceptance above 6051 signals strength, targeting the December VPOC at 6096 and the resistance area from 6130 to the Weekly Extreme High of 6160, where selling activity can be expected. Notably, this resistance area is the distribution established at the all-time highs (ATH).
Break and hold below 6004.25 would target the lower end of the middle distribution at 5965. Acceptance below 5965 signals weakness, targeting the support area from 5930 to the Weekly Extreme Low of 5900, where buying activity can be expected. Notably, this support area aligns with Wednesday’s unfilled gap at 5909.75. Overall, buyers are not in trouble as long as the highlighted weekly support area holds, allowing the market to clean up a significant amount of structural deficiencies below without turning bearish.
As usual, a detailed daily plan will be published tomorrow. In the meantime, enjoy the rest of your weekend!
Levels of Interest
In the upcoming week, I will closely observe the behavior around 6004.
Break and hold above 6004 would target 6051 / 6096 / 6130 / 6160* / 6200
Holding below 6004 would target 5965 / 5930 / 5900* / 5856 / 5819
*Weekly Extremes. I exercise caution when initiating trades outside the Weekly Extremes to avoid making impulsive decisions at unfavorable locations. Essentially, the Weekly Extremes serve as a safeguard against emotionally-driven trades, a state that is less than ideal for making well-informed trading decisions.
Thank you as always!
Do we have unfinished business at ATH (non excess )?