
ES Weekly Plan | January 12-16, 2026
Recap, Market Context & Key Levels for the Week Ahead

Welcome to this week’s plan. Inside, you’ll find a quick review of last week’s price action, key economic events, market structure, context for the week ahead, and the levels I’ll be focusing on. Let’s get prepared.
Contents
Last Week in Review
Economic & Earnings Calendar
Market Structure
Contextual Analysis & Plan
Key Levels of Interest
Last Week in Review
Last week’s plan:

Coming into last week, the main focus was on whether sellers could sustain downside momentum after buyers had failed to build value above the prior all-time high at 6952, resulting in a failed breakout and rejection. Immediate attention was on 6909, serving as a key reference point.
Buyers were looking to reclaim 6909, rotate back into last week’s value area, and show little acceptance within December’s value area, keeping the upside open toward the previous ATH at 6952 and the unfilled gap at 6969. On the flip side, sellers were looking to keep the failed breakout scenario in play by maintaining 6909, which would have opened the door to a revisit of December’s lows.
The auction immediately reclaimed 6909 on Monday overnight, returning to the high-volume area where two-sided activity occurred the prior week. This was something stronger sellers would not have allowed. Tuesday’s session formed a double-distribution trend day after launching a directional move from that high volume area, filling the gap at 6969 in the process.
Heading into Wednesday’s session, the key was whether buyers could build on this momentum to print new all-time highs. A new all-time high was achieved; however, the afternoon session was marked by weakness, forming a double-distribution trend day to the downside and closing back within Tuesday’s lower distribution. The breakdown single prints from that session at 6976 were essentially the key level for the rest of the week, especially since Wednesday’s session formed an excess high and a potential failed breakout scenario was in play.
Thursday’s session was marked by responsive, two-sided activity, meaning the context remained unchanged heading into Friday’s session. Buyers needed to reclaim 6976, while failure to do so would have kept the failed breakout scenario in play. 6976 was ultimately reclaimed on Friday, after a notable selling effort in the B-period was decisively rejected (see Figure 1).
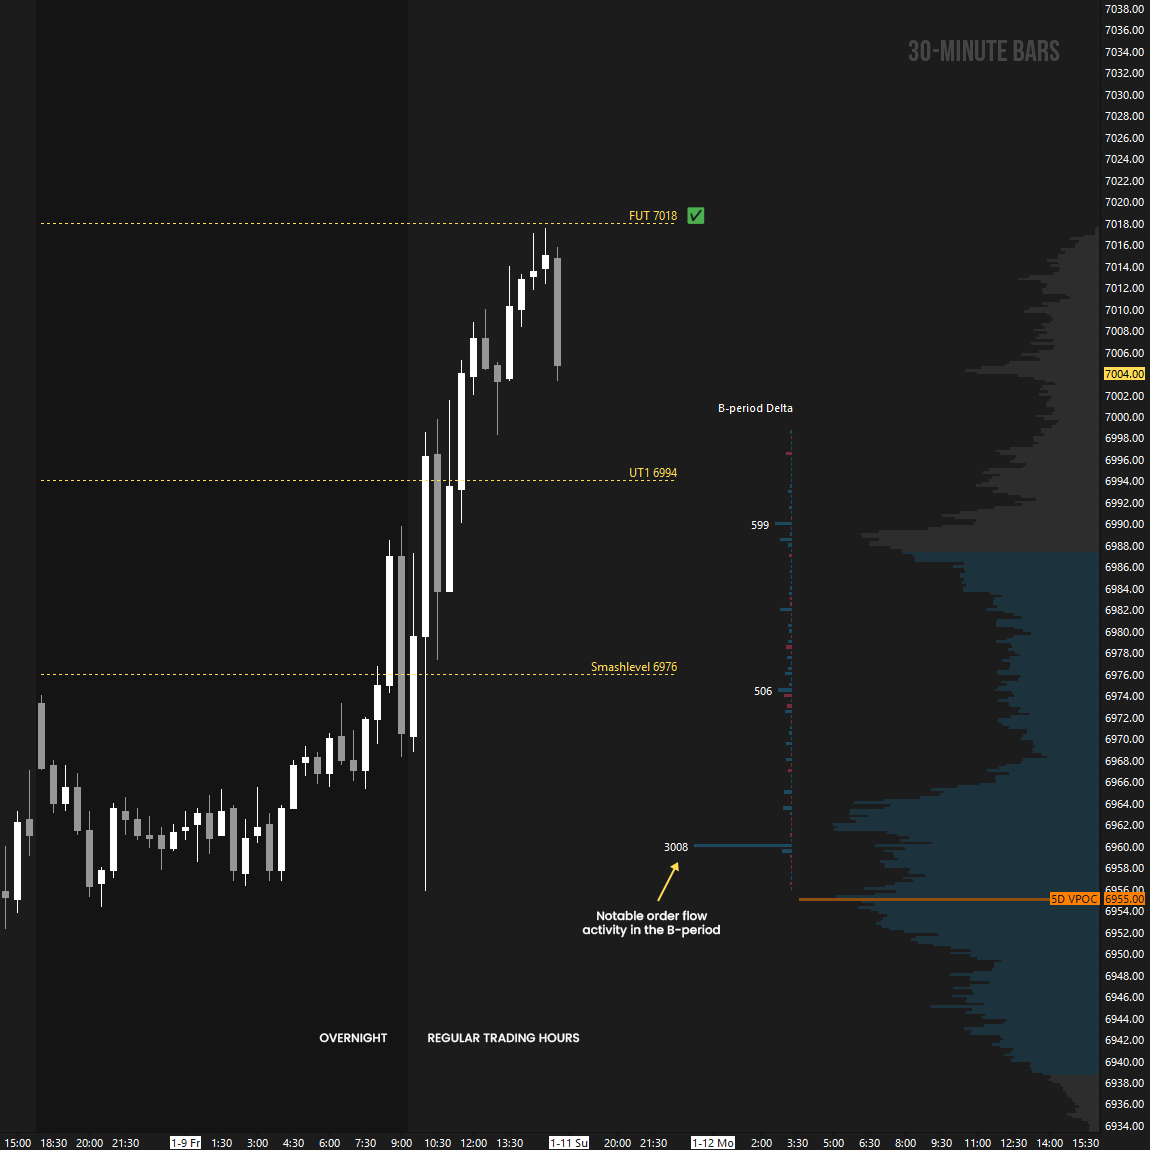
A new all-time high printed at 7017.50, just two ticks shy of our final intraday upside target (FUT 7018). We carry forward the ATH as unfinished business due to the lack of meaningful excess.
Price Action vs. Weekly Levels

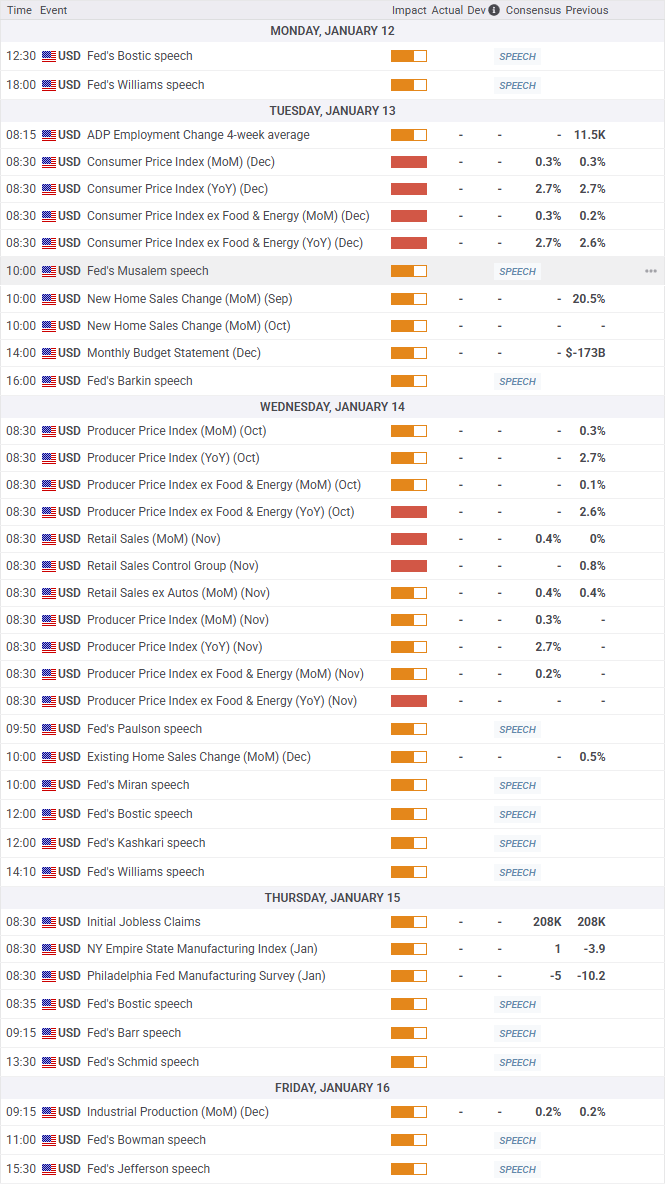
Economic & Earnings Calendar
Central Standard Time
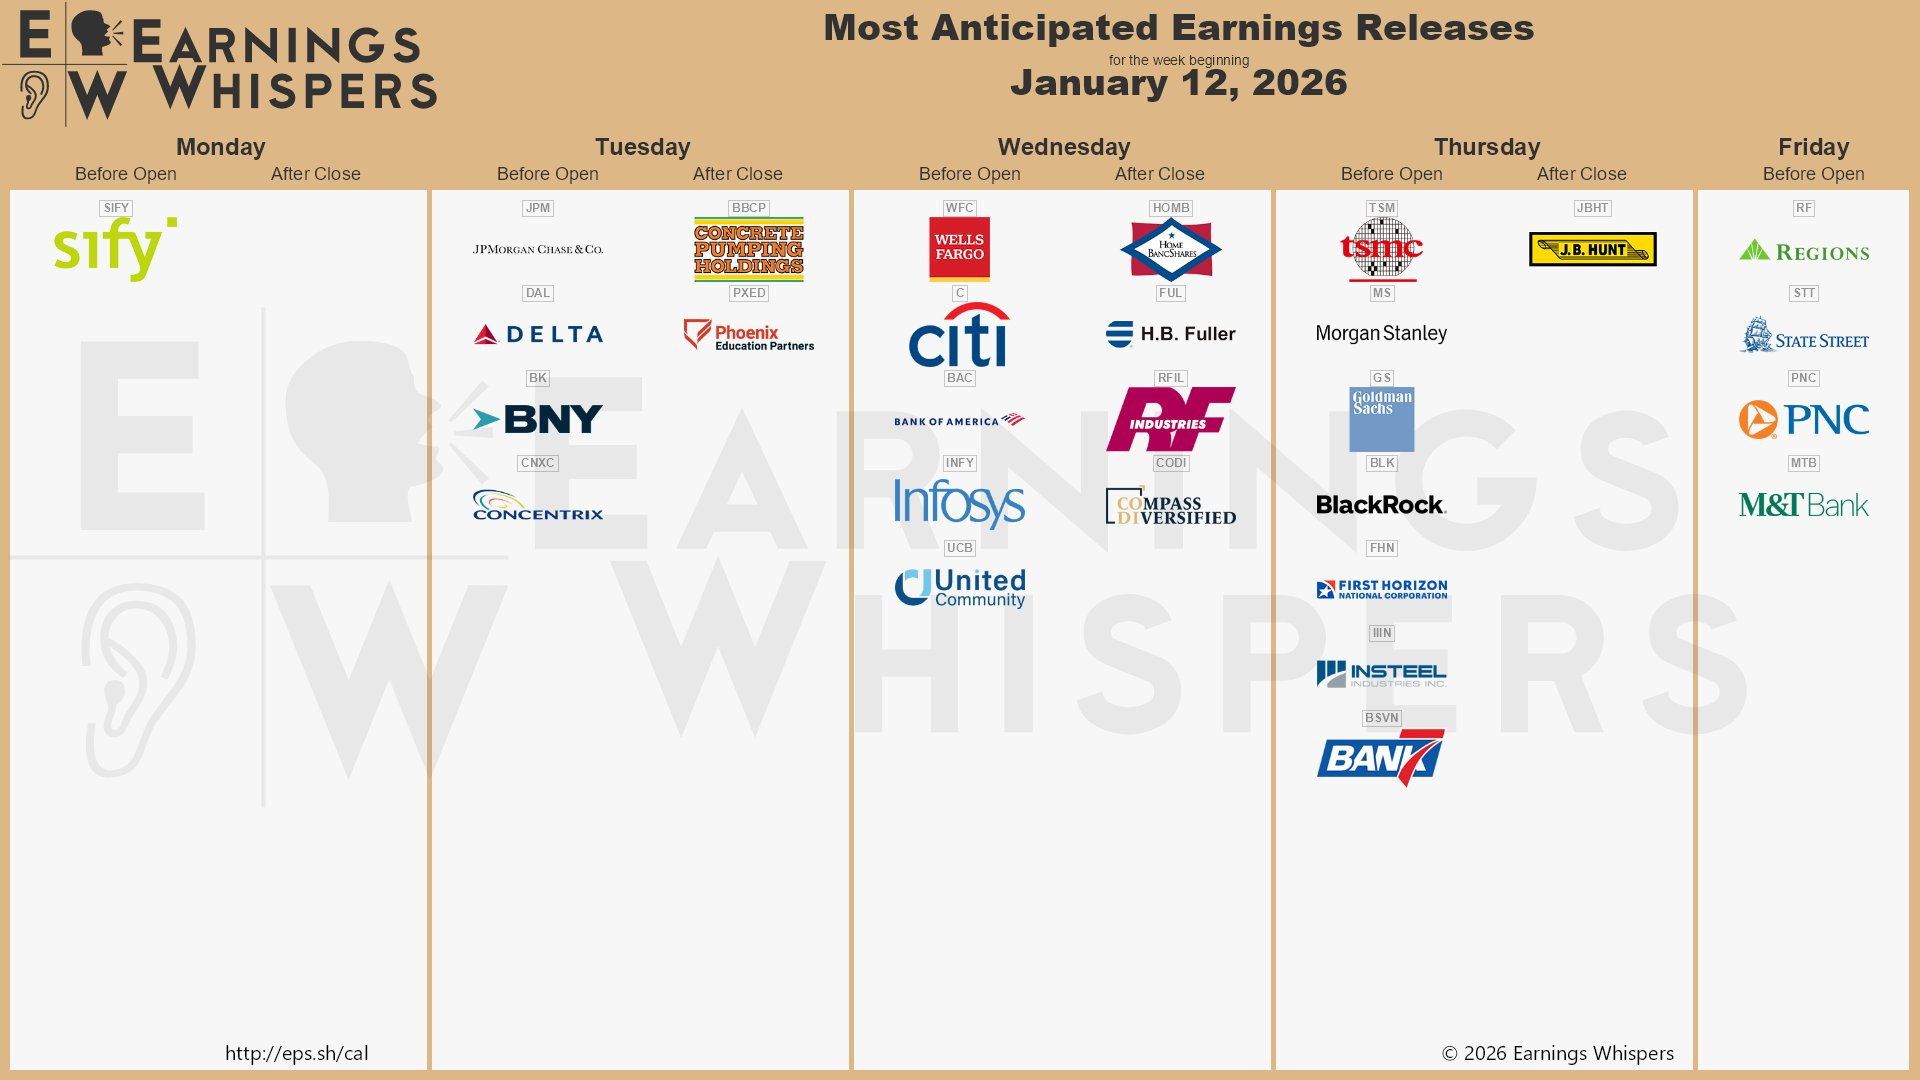
Earnings Whispers
Market Structure
🟩 Daily: OTFU → Ends at: 6955.75
🟩 Weekly: OTFU → Ends at: 6932.75
🟩 Monthly: OTFU → Ends at: 6775.50
Balance: A market condition where price consolidates within a defined range, reflecting indecision as the market awaits more market-generated information. We apply balance guidelines—favoring fade trades at range extremes (highs/lows) and preparing for breakout setups if balance resolves.
One-Time Framing Up (OTFU): A market condition where each subsequent bar forms a higher low, signaling a strong upward trend.
One-Time Framing Down (OTFD): A market condition where each subsequent bar forms a lower high, signaling a strong downward trend.
Contextual Analysis & Plan
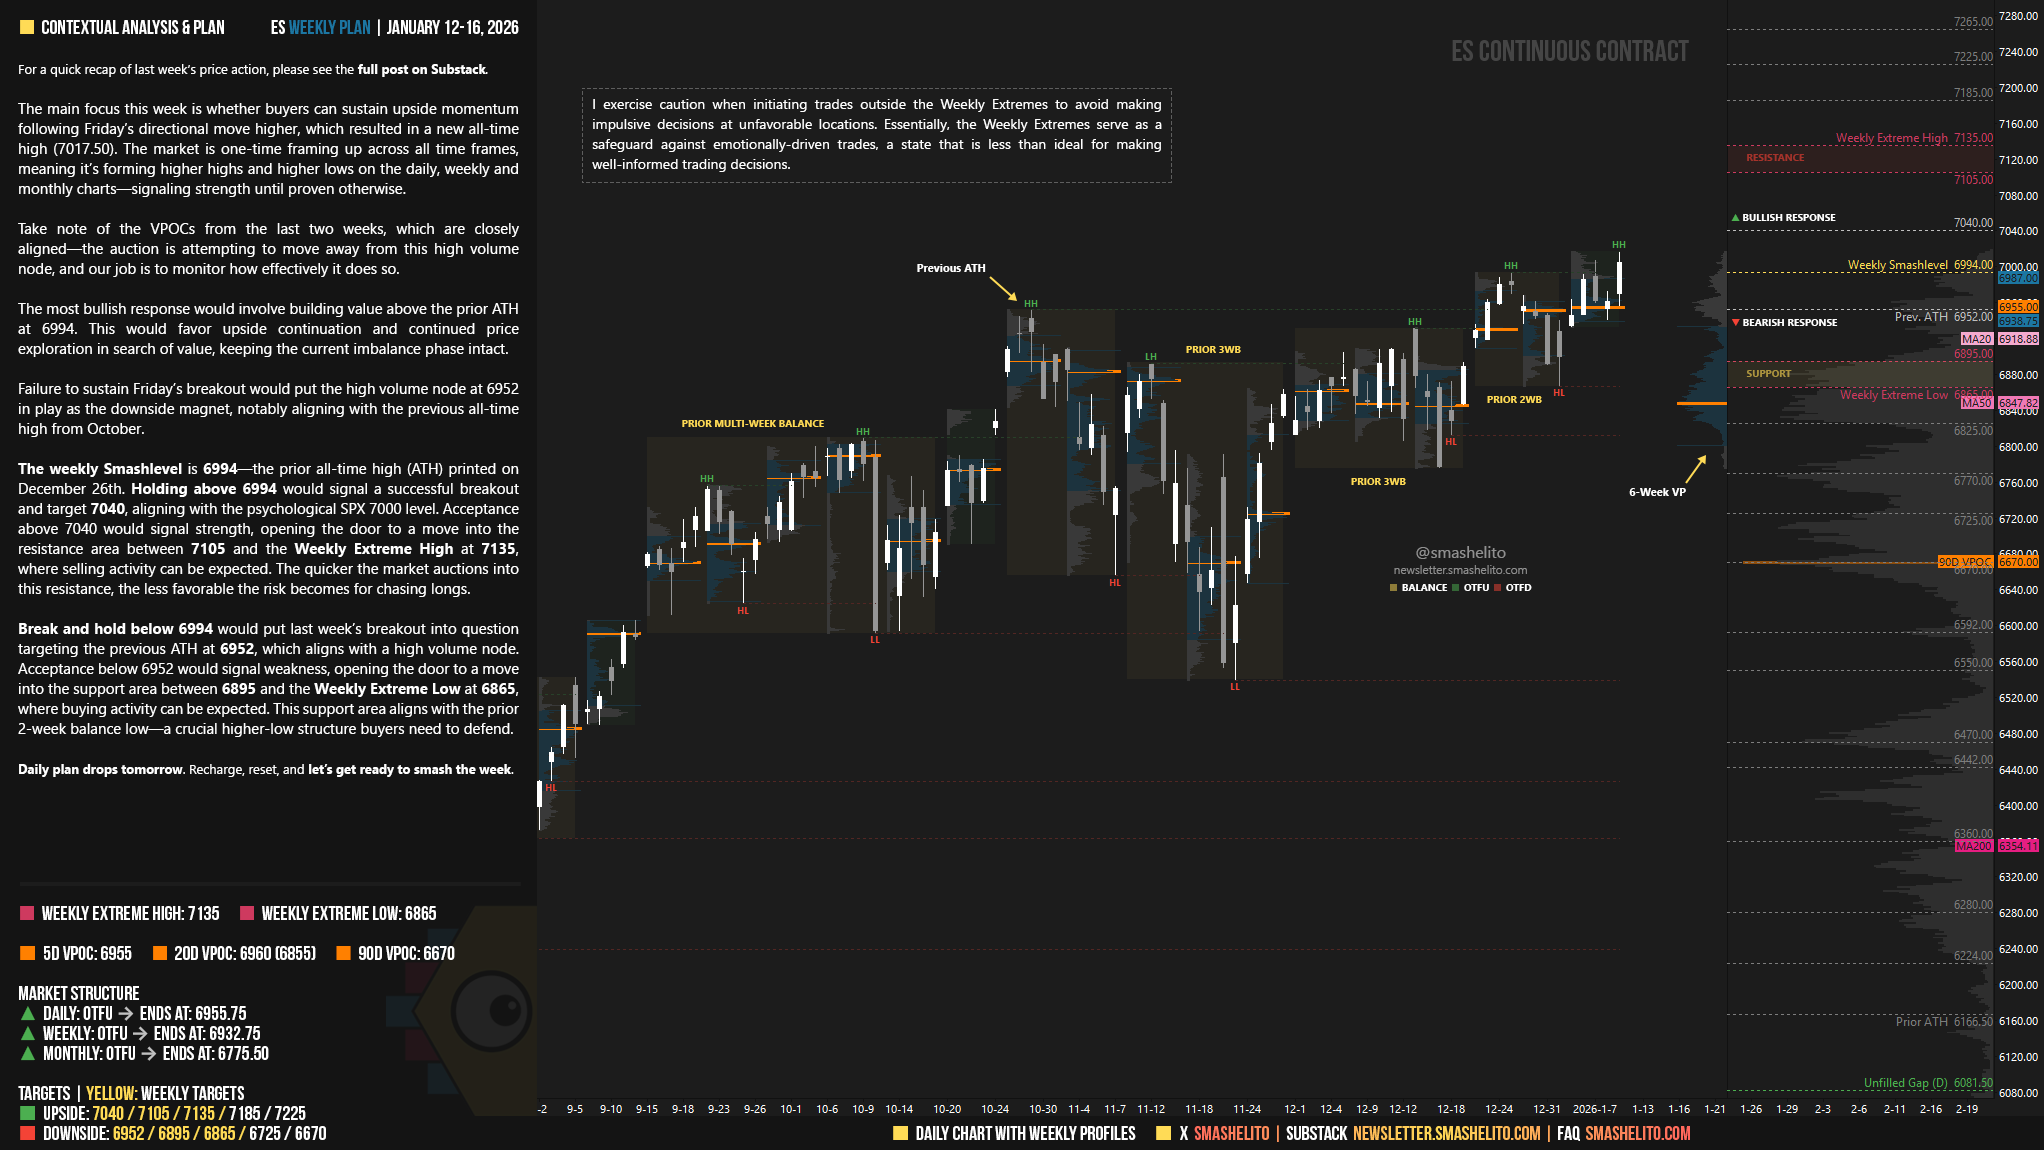
The main focus this week is whether buyers can sustain upside momentum following Friday’s directional move higher, which resulted in a new all-time high (7017.50). The market is one-time framing up across all time frames, meaning it’s forming higher highs and higher lows on the daily, weekly and monthly charts—signaling strength until proven otherwise.
Take note of the VPOCs from the last two weeks, which are closely aligned—the auction is attempting to move away from this high volume node, and our job is to monitor how effectively it does so.
The most bullish response would involve building value above the prior ATH at 6994. This would favor upside continuation and continued price exploration in search of value, keeping the current imbalance phase intact.
Failure to sustain Friday’s breakout would put the high volume node at 6952 in play as the downside magnet, notably aligning with the previous all-time high from October.
The weekly Smashlevel is 6994—the prior all-time high (ATH) printed on December 26th. Holding above 6994 would signal a successful breakout and target 7040, aligning with the psychological SPX 7000 level. Acceptance above 7040 would signal strength, opening the door to a move into the resistance area between 7105 and the Weekly Extreme High at 7135, where selling activity can be expected. The quicker the market auctions into this resistance, the less favorable the risk becomes for chasing longs.
Break and hold below 6994 would put last week’s breakout into question targeting the previous ATH at 6952, which aligns with a high volume node. Acceptance below 6952 would signal weakness, opening the door to a move into the support area between 6895 and the Weekly Extreme Low at 6865, where buying activity can be expected. This support area aligns with the prior 2-week balance low—a crucial higher-low structure buyers need to defend.
Key Levels of Interest
In the upcoming week, I will closely observe the behavior around 6994.
Break and hold above 6994 would target 7040 / 7105 / 7135* / 7185 / 7225
Holding below 6994 would target 6952 / 6895 / 6865* / 6725 / 6670
*Weekly Extremes. I exercise caution when initiating trades outside the Weekly Extremes to avoid making impulsive decisions at unfavorable locations. Essentially, the Weekly Extremes serve as a safeguard against emotionally-driven trades, a state that is less than ideal for making well-informed trading decisions.
Daily plan drops tomorrow. Recharge, reset, and let’s get ready to smash the week.
Have a great week, GOAT!
Thank you Smash!