ES Weekly Plan | February 5-9, 2024
My expectations for the upcoming week.
Visual Representation
Market Structure
🟩 DAILY: OTFU | ENDS: 4929
🟨 WEEKLY: BALANCE | H: 4997.75 L: 4868.25
🟩 MONTHLY: OTFU | ENDS: 4552
Contextual Analysis
During the previous week, buyers initiated an immediate breakout from the 3-day balance area of interest, resulting in the attainment of the 100% range extension level at 4960. This breakout target, derived from the prior 4-week balance area, stalled the upside momentum and resulted in the formation of a poor high. On Wednesday, sellers managed to end the weekly one-time framing up by breaching the prior week’s low. However, the weakness proved to be short-lived, as what could have been a potential outside week down instead resulted in an outside week up with a new all-time high at 4997.75.

For this week, our main focus will be on whether buyers can maintain above the prior 9-day balance high following Friday's trend day and breakout. Monitor for continuation (Acceptance) or lack thereof (Rejection). The conditions are straightforward: buyers are aiming for acceptance by establishing value above 4960. This would indicate that the upward auction is not yet complete, highlighting the ongoing strength in the market and targeting the weekly resistance area. On the flip side, sellers aim to reject Friday’s breakout, ideally quickly, by re-establishing acceptance below 4960. This would open the door for two-sided activity. In the broader perspective, buyers are not in trouble as long as the breakout observed on January 19th is maintained.
The weekly Smashlevel (Pivot) is 4960, representing the prior 9-day balance (P9DB) high as well as Friday’s afternoon pullback low. Holding above 4960, indicating continued directional conviction, would target the current all-time high (ATH) at 4997.75. Acceptance above 4997.75 would shift the weekly to one-time framing up once again, targeting an upside continuation toward the resistance area from 5040 to the Weekly Extreme High of 5070, where selling activity can be expected. Note how this resistance area coincides with both the Monthly (5067) and Quarterly (5071) Extreme Highs, adding an additional layer of significance.
Break and hold below 4960, would put Friday’s trend day and breakout into question, targeting the support area from 4920 to the Weekly Extreme Low of 4890, where buying activity can be expected. Note how this support area coincides with the medium-term value (20D VPOC) at 4917 and the value area low (VAL) from the last two weeks.
As usual, a detailed daily plan will be published tomorrow. In the meantime, enjoy the rest of your weekend!
Levels of Interest
In the upcoming week, I will observe 4960.
Holding above 4960 would target 4997 / 5040 / 5070* / 5095 / 5122
Break and hold below 4960 would target 4920 / 4890* / 4865 / 4835 / 4810
*Weekly Extremes. I exercise caution when initiating trades outside the Weekly Extremes to avoid making impulsive decisions at unfavorable locations. Essentially, the Weekly Extremes serve as a safeguard against emotionally-driven trades, a state that is less than ideal for making well-informed trading decisions.
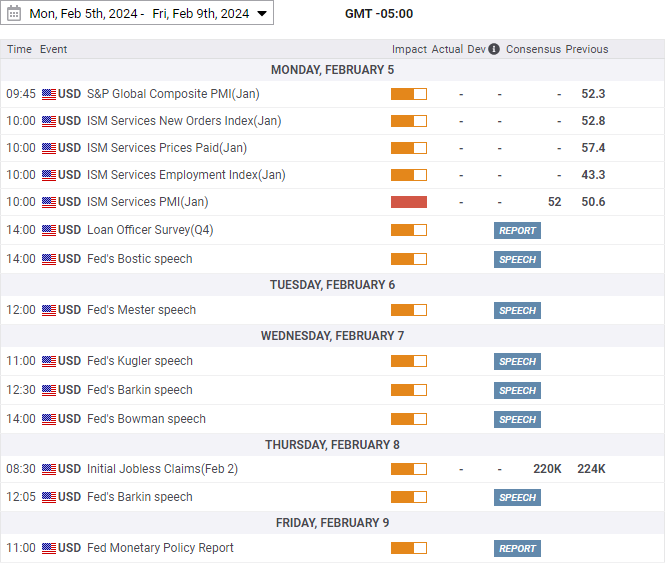
Economic Calendar
Disclaimer: Futures and options trading involves a high level of risk, with the potential for substantial losses. The information provided in this newsletter is for informational purposes only and is not intended to be a trade recommendation. It is the responsibility of the reader to make their own investment decisions and they should seek the advice of a qualified securities professional before making any investments. The owners/authors of this newsletter are not certified as registered financial professionals or investment advisers.


Thanks Smash!
Thanks, buddy! It's been an amazing week. Let's continue with this great momentum.