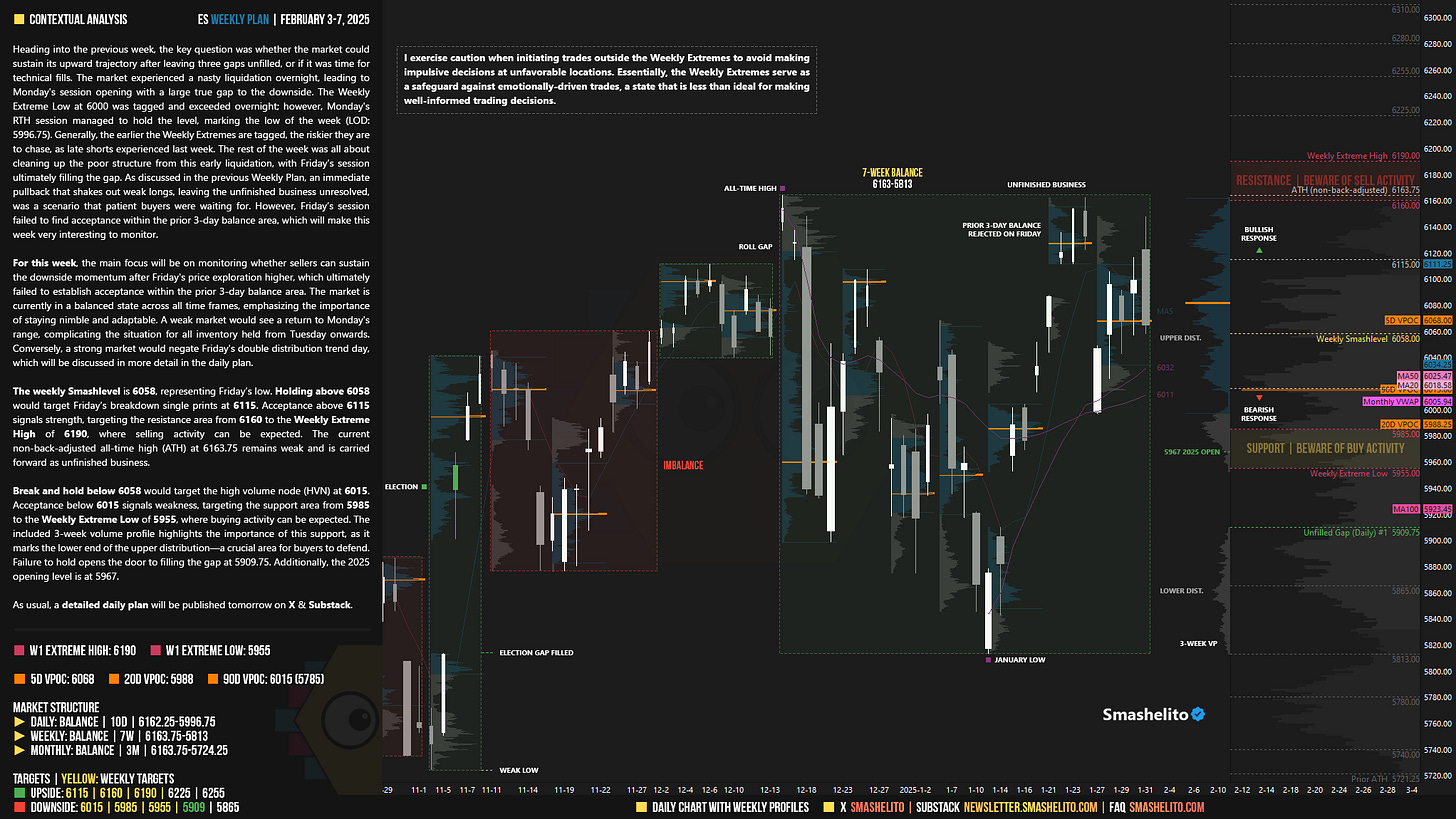
ES Weekly Plan | February 3-7, 2025
My expectations for the upcoming week.
Visual Representation
Economic Calendar
Earnings Calendar
Market Structure
🟨 DAILY: BALANCE | 10D | 6162.25-5996.75
🟨 WEEKLY: BALANCE | 7W | 6163.75-5813
🟨 MONTHLY: BALANCE | 3M | 6163.75-5724.25
Contextual Analysis
Heading into the previous week, the key question was whether the market could sustain its upward trajectory after leaving three gaps unfilled, or if it was time for technical fills. The market experienced a nasty liquidation overnight, leading to Monday's session opening with a large true gap to the downside. The Weekly Extreme Low at 6000 was tagged and exceeded overnight; however, Monday's RTH session managed to hold the level, marking the low of the week (LOD: 5996.75). Generally, the earlier the Weekly Extremes are tagged, the riskier they are to chase, as late shorts experienced last week. The rest of the week was all about cleaning up the poor structure from this early liquidation, with Friday’s session ultimately filling the gap. As discussed in the previous Weekly Plan, an immediate pullback that shakes out weak longs, leaving the unfinished business unresolved, was a scenario that patient buyers were waiting for. However, Friday’s session failed to find acceptance within the prior 3-day balance area, which will make this week very interesting to monitor.

For this week, the main focus will be on monitoring whether sellers can sustain the downside momentum after Friday's price exploration higher, which ultimately failed to establish acceptance within the prior 3-day balance area. The market is currently in a balanced state across all time frames, emphasizing the importance of staying nimble and adaptable. A weak market would see a return to Monday's range, complicating the situation for all inventory held from Tuesday onwards. Conversely, a strong market would negate Friday's double distribution trend day, which will be discussed in more detail in the daily plan.
The weekly Smashlevel is 6058, representing Friday’s low. Holding above 6058 would target Friday’s breakdown single prints at 6115. Acceptance above 6115 signals strength, targeting the resistance area from 6160 to the Weekly Extreme High of 6190, where selling activity can be expected. The current non-back-adjusted all-time high (ATH) at 6163.75 remains weak and is carried forward as unfinished business.
Break and hold below 6058 would target the high volume node (HVN) at 6015. Acceptance below 6015 signals weakness, targeting the support area from 5985 to the Weekly Extreme Low of 5955, where buying activity can be expected. The included 3-week volume profile highlights the importance of this support, as it marks the lower end of the upper distribution—a crucial area for buyers to defend. Failure to hold opens the door to filling the gap at 5909.75. Additionally, the 2025 opening level is at 5967.
As usual, a detailed daily plan will be published tomorrow. In the meantime, enjoy the rest of your weekend!
Levels of Interest
In the upcoming week, I will closely observe the behavior around 6058.
Holding above 6058 would target 6115 / 6160 / 6190* / 6225 / 6255
Break and hold below 6058 would target 6015 / 5985 / 5955* / 5909 / 5865
*Weekly Extremes. I exercise caution when initiating trades outside the Weekly Extremes to avoid making impulsive decisions at unfavorable locations. Essentially, the Weekly Extremes serve as a safeguard against emotionally-driven trades, a state that is less than ideal for making well-informed trading decisions.


It is already tagged weekly extreme 5955 just minutes after open. Time for bounce?
Thank you