
ES Weekly Plan | February 2-6, 2026
Recap, Market Context & Key Levels for the Week Ahead

Welcome to this week’s plan. Inside, you’ll find a quick review of last week’s price action, key economic events, market structure, context for the week ahead, and the levels I’ll be focusing on. Let’s get prepared.
Contents
Last Week in Review
Economic & Earnings Calendar
Market Structure
Contextual Analysis & Plan
Key Levels of Interest
Last Week in Review
Last week’s plan:

Last week, the market saw an immediate breakout from the 2-day balance on Monday, initiating a phase of imbalance and shifting the daily profile to one-time framing up. Upside momentum continued on Tuesday as the auction established value cleanly above Monday’s session. The key targets for buyers were the RTH ATH at 7025 and the overnight ATH at 7036, which we had carried forward as unfinished business. It’s considered unfinished business because a well-auctioned high is typically formed during regular trading hours, meaning the expectation is that an overnight ATH is cleaned up before completing an upward auction.
The market printed a new overnight all-time high at 7043 on Wednesday, which held as the high for the week. This leaves another untested overnight ATH to track going forward. During the subsequent RTH session, the auction took a breather, with value essentially unchanged from Tuesday’s session.
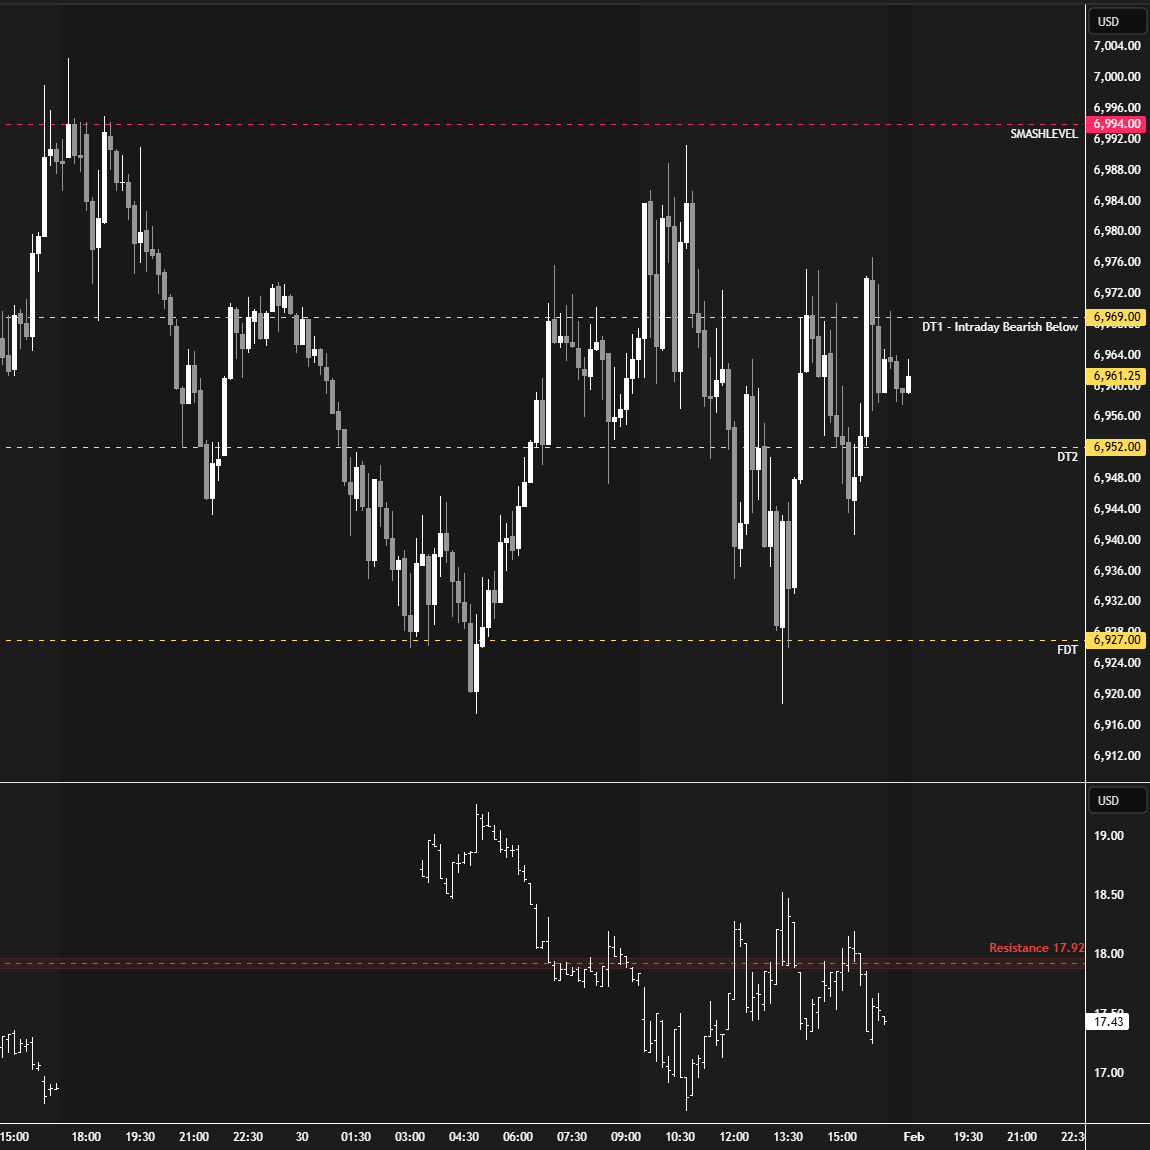
Change took place on Thursday as a notable liquidation break took out the lows of the prior five daily sessions. However, the move was nearly fully retraced by the close, indicating the absence of stronger sellers. Friday formed an inside day, which was unsurprising given Thursday’s notable large range. Our intraday levels provided good opportunities on Friday, with the Smashlevel capping the upside and the Final Downside Target (FDT) capping the downside (see Figure 1).
The conditions are tricky at the moment because the auction lacks directional conviction. The YTD profile has formed a P-shape, with the auction situated right in the main distribution. This is a bullish imbalance until proven otherwise, but the million-dollar question is whether we will see an immediate clean-up of the unfinished business at the all-time highs, or if a larger liquidation break is needed first to attract stronger buyers while simultaneously flushing weaker-handed traders. As always, there is no need to guess any scenario—navigate day by day and let the market behavior around our key levels tell the story.
Last Week’s Levels in Review
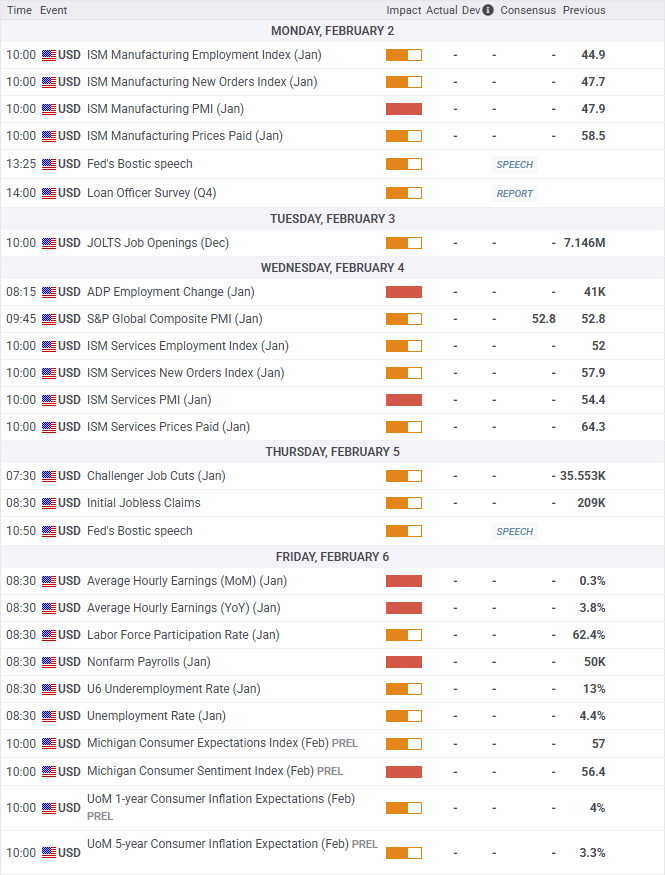
Economic & Earnings Calendar
Central Standard Time
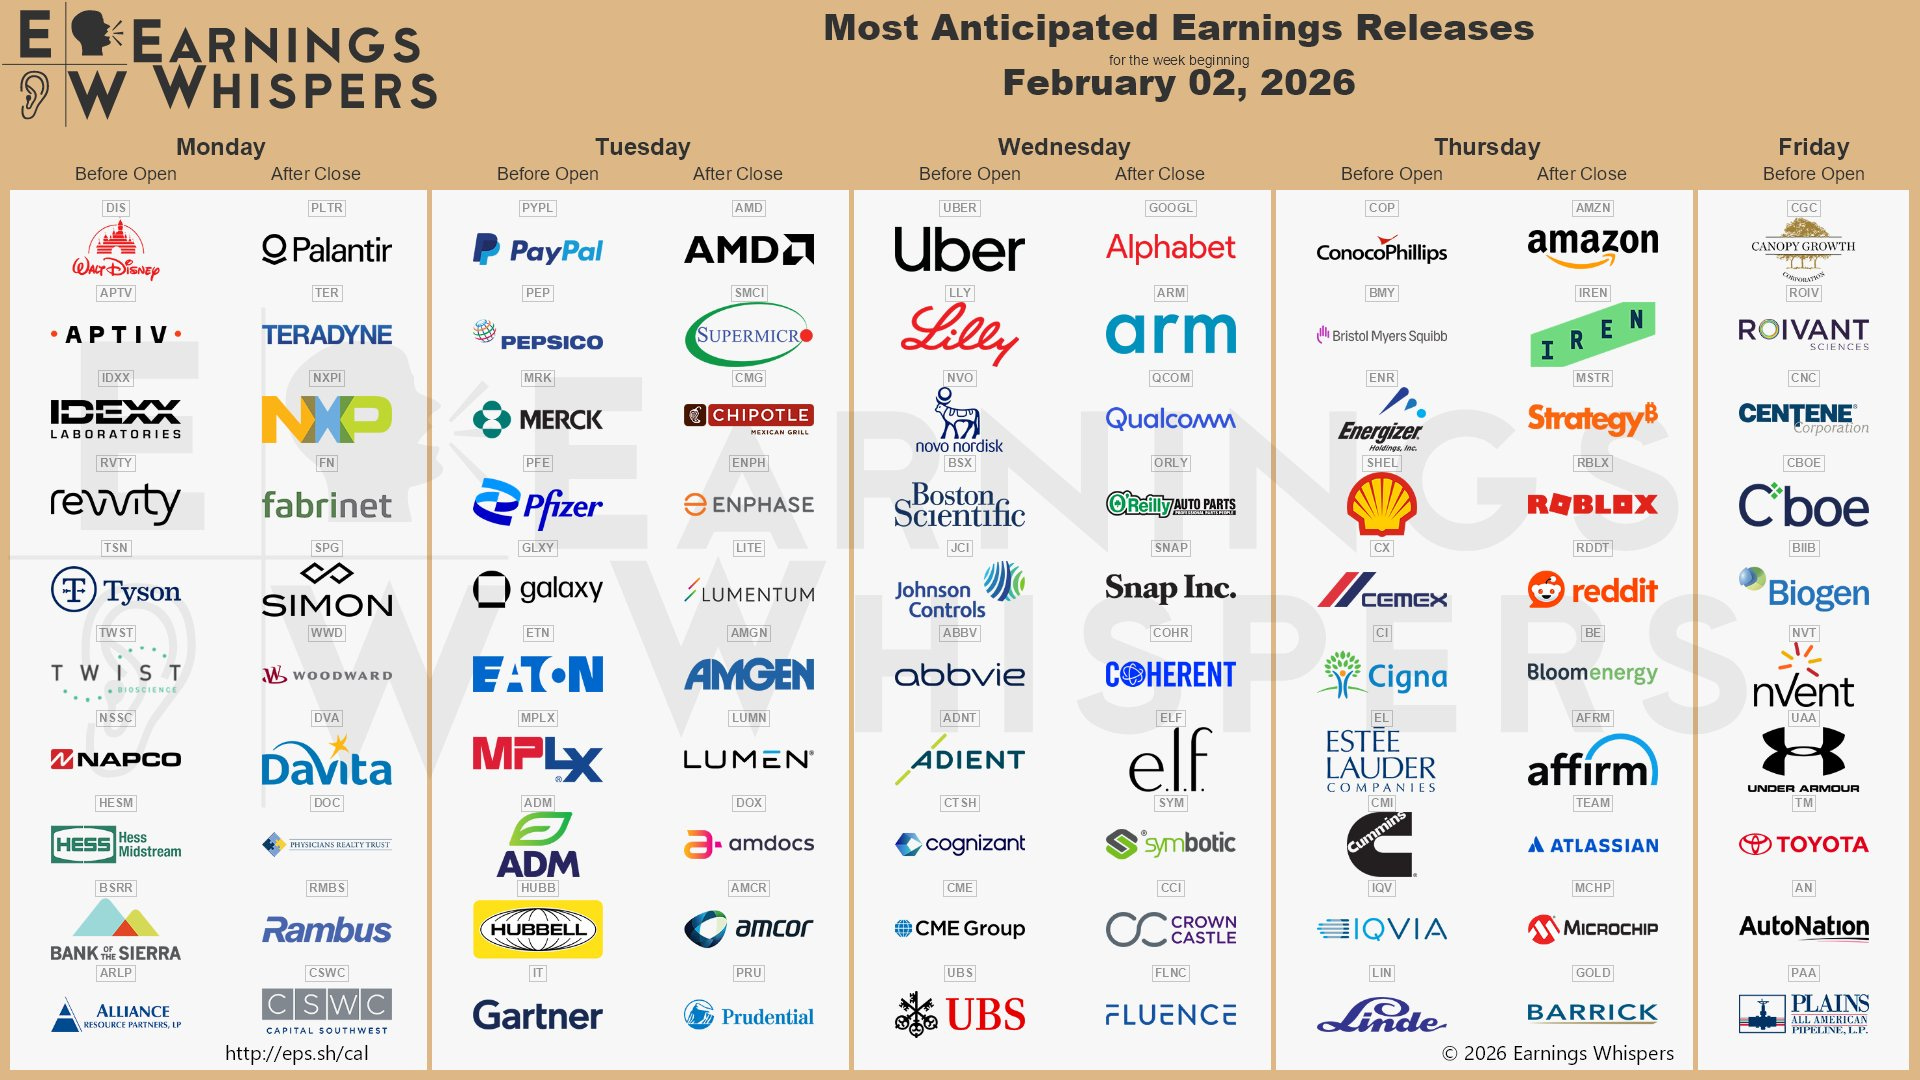
Earnings Whispers
Market Structure
🟨 Daily: BALANCE → 7-day → High: 7031 / Low: 6898.25
🟨 Weekly: BALANCE → 6-week → High: 7031 / Low: 6822.25
🟩 Monthly: OTFU → Ends at: 6822.25
Balance: A market condition where price consolidates within a defined range, reflecting indecision as the market awaits more market-generated information. We apply balance guidelines—favoring fade trades at range extremes (highs/lows) and preparing for breakout setups if balance resolves.
One-Time Framing Up (OTFU): A market condition where each subsequent bar forms a higher low, signaling a strong upward trend.
One-Time Framing Down (OTFD): A market condition where each subsequent bar forms a lower high, signaling a strong downward trend.
Contextual Analysis & Plan
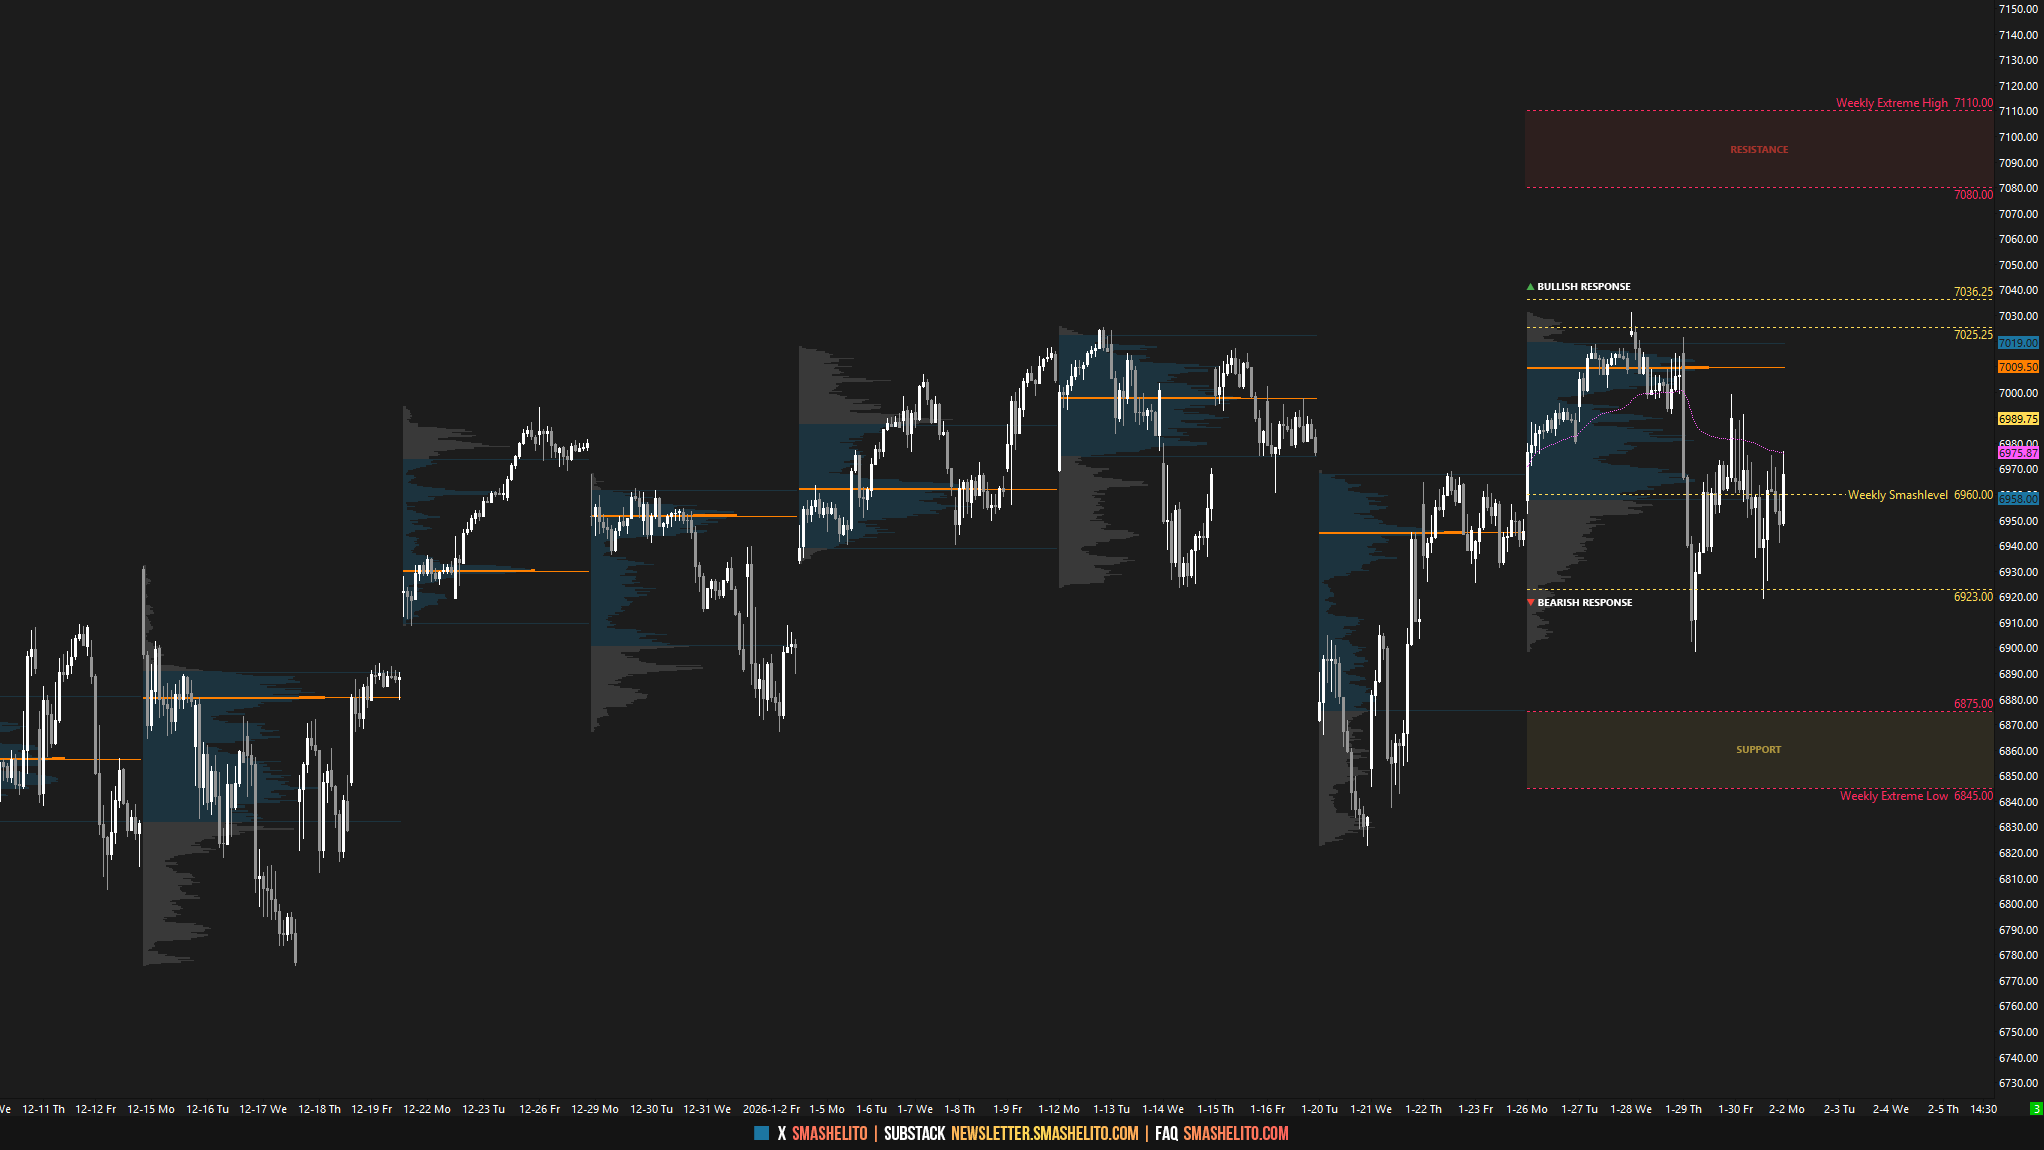
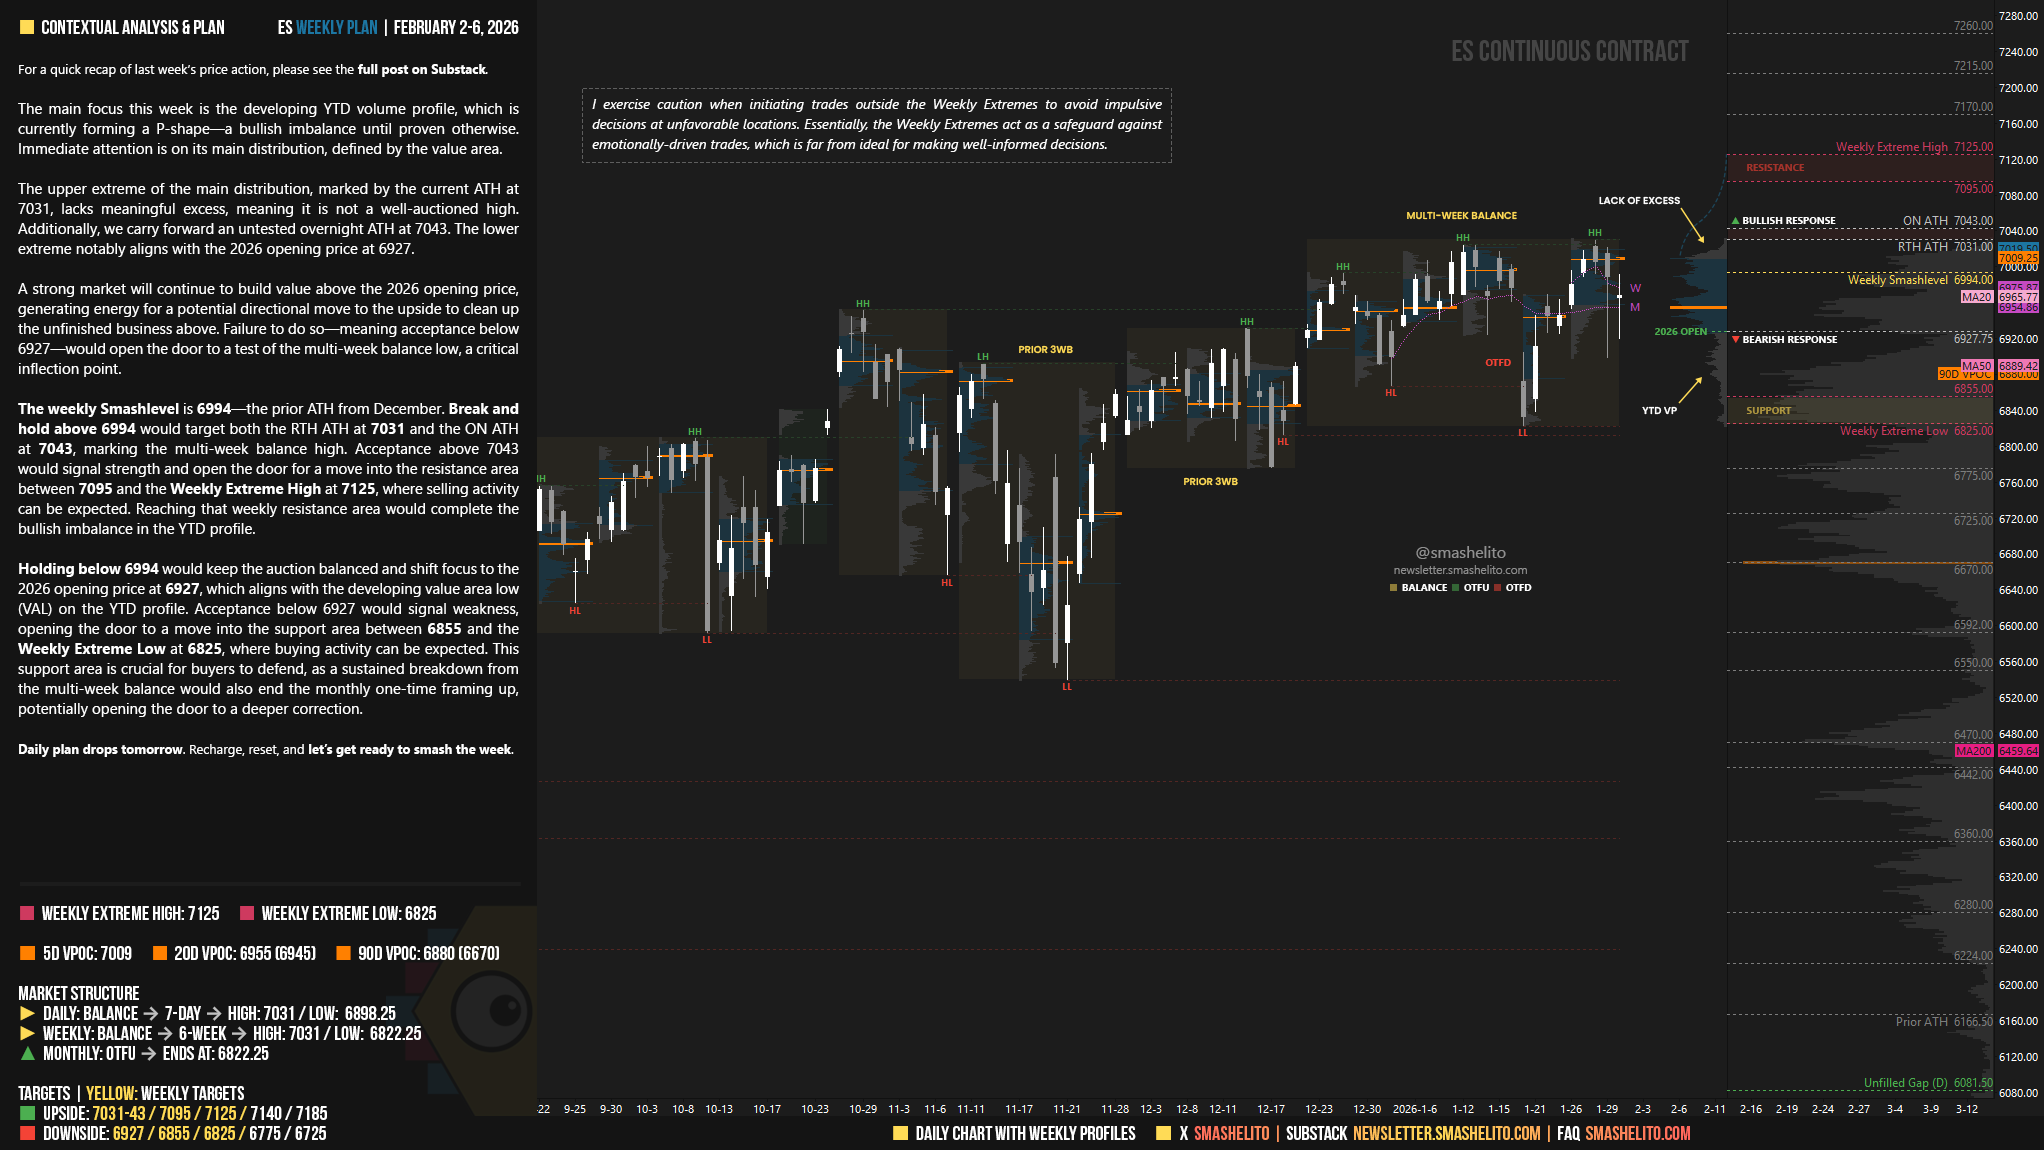
The main focus this week is the developing YTD volume profile, which is currently forming a P-shape—a bullish imbalance until proven otherwise. Immediate attention is on its main distribution, defined by the value area.
The upper extreme of the main distribution, marked by the current ATH at 7031, lacks meaningful excess, meaning it is not a well-auctioned high. Additionally, we carry forward an untested overnight ATH at 7043. The lower extreme notably aligns with the 2026 opening price at 6927.
A strong market will continue to build value above the 2026 opening price, generating energy for a potential directional move to the upside to clean up the unfinished business above. Failure to do so—meaning acceptance below 6927—would open the door to a test of the multi-week balance low, a critical inflection point.
The weekly Smashlevel is 6994—the prior ATH from December. Break and hold above 6994 would target both the RTH ATH at 7031 and the ON ATH at 7043, marking the multi-week balance high. Acceptance above 7043 would signal strength and open the door for a move into the resistance area between 7095 and the Weekly Extreme High at 7125, where selling activity can be expected. Reaching that weekly resistance area would complete the bullish imbalance in the YTD profile.
Holding below 6994 would keep the auction balanced and shift focus to the 2026 opening price at 6927, which aligns with the developing value area low (VAL) on the YTD profile. Acceptance below 6927 would signal weakness, opening the door to a move into the support area between 6855 and the Weekly Extreme Low at 6825, where buying activity can be expected. This support area is crucial for buyers to defend, as a sustained breakdown from the multi-week balance would also end the monthly one-time framing up, potentially opening the door to a deeper correction.
Key Levels of Interest
In the upcoming week, I will closely observe the behavior around 6994.
Break and hold above 6994 would target 7031-43 / 7095 / 7125* / 7140 / 7185
Holding below 6994 would target 6927 / 6855 / 6825* / 6775 / 6725
*Weekly Extremes (defined by proprietary models). I exercise caution when initiating trades outside the Weekly Extremes to avoid impulsive decisions at unfavorable locations. Essentially, the Weekly Extremes act as a safeguard against emotionally-driven trades, which is far from ideal for making well-informed decisions.
Daily plan drops tomorrow. Recharge, reset, and let’s get ready to smash the week.
1. << It’s considered unfinished business because a well-auctioned high is typically formed during regular trading hours, meaning the expectation is that an overnight ATH is cleaned up before completing an upward auction.>>
2. << Friday formed an inside day, which was unsurprising given Thursday’s notable large range.>>
3. << The conditions are tricky at the moment because the auction lacks directional conviction. The YTD profile has formed a P-shape, with the auction situated right in the main distribution. This is a bullish imbalance until proven otherwise, but the million-dollar question is whether we will see an immediate clean-up of the unfinished business at the all-time highs, or if a larger liquidation break is needed first to attract stronger buyers while simultaneously flushing weaker-handed traders. As always, there is no need to guess any scenario—navigate day by day and let the market behavior around our key levels tell the story.>>
Hola, Smashelito. The entire newsletter is filled with valuable information and guidelines.
I picked out three phrases to say that:
a) The first two explain to a new reader the reasoning behind the terminology of Market Profile Theory.
b) The third phrase/paragraph is on the level of a trading‑desk manager giving traders guidance on how to approach the market during the session. David Cervantes/pinebrookcap.com, does the same with his macroeconomic analysis and his positioning in and out of assets.
Muchas gracias por todo lo que haces de manera desinteresada. Feliz domingo!
Thank you. Have a nice weekend !!!