
ES Weekly Plan | January 26-30, 2026
Recap, Market Context & Key Levels for the Week Ahead

Welcome to this week’s plan. Inside, you’ll find a quick review of last week’s price action, key economic events, market structure, context for the week ahead, and the levels I’ll be focusing on. Let’s get prepared.
Contents
Last Week in Review
Economic & Earnings Calendar
Market Structure
Contextual Analysis & Plan
Key Levels of Interest
Last Week in Review
Last week’s plan:

Coming into last week, the focus was on the 2-week balance area between the RTH ATH at 7025 and 6923, which closely aligns with the 2026 opening price (6927).
Note: Monday’s holiday session has been removed from the chart, as it is treated as an overnight session. The 2-week balance low at 6923 was breached on Monday following a notably large gap lower. Tuesday saw a downside continuation that tagged and exceeded the Weekly Extreme Low at 6845—a level that played a pivotal role for the rest of the week. As always, approaching the Weekly Extreme Low this early in the week often reflects emotional price action. When the market is emotional, it becomes crucial not to get caught up in that behavior and to take a step back, avoiding emotionally-driven trades.
On Wednesday, buyers reclaimed the critical 6845 level, triggering a significant short-covering rally that partially filled Tuesday’s true gap. Heading into Thursday’s session, the key was to monitor whether buyers could gain acceptance back above the 2-week balance low at 6923, setting up a classic failed breakdown scenario. Buyers reclaimed 6923 overnight, and held it almost to the tick on Thursday and completely filled the true gap down in the process—something stronger sellers typically would not have allowed. Friday’s session saw consolidation within Thursday’s range, indicating that buyers continued to reject the weakness seen earlier in the week. Intraday key levels provided notable opportunities for short-term rotations (see Figure 1).
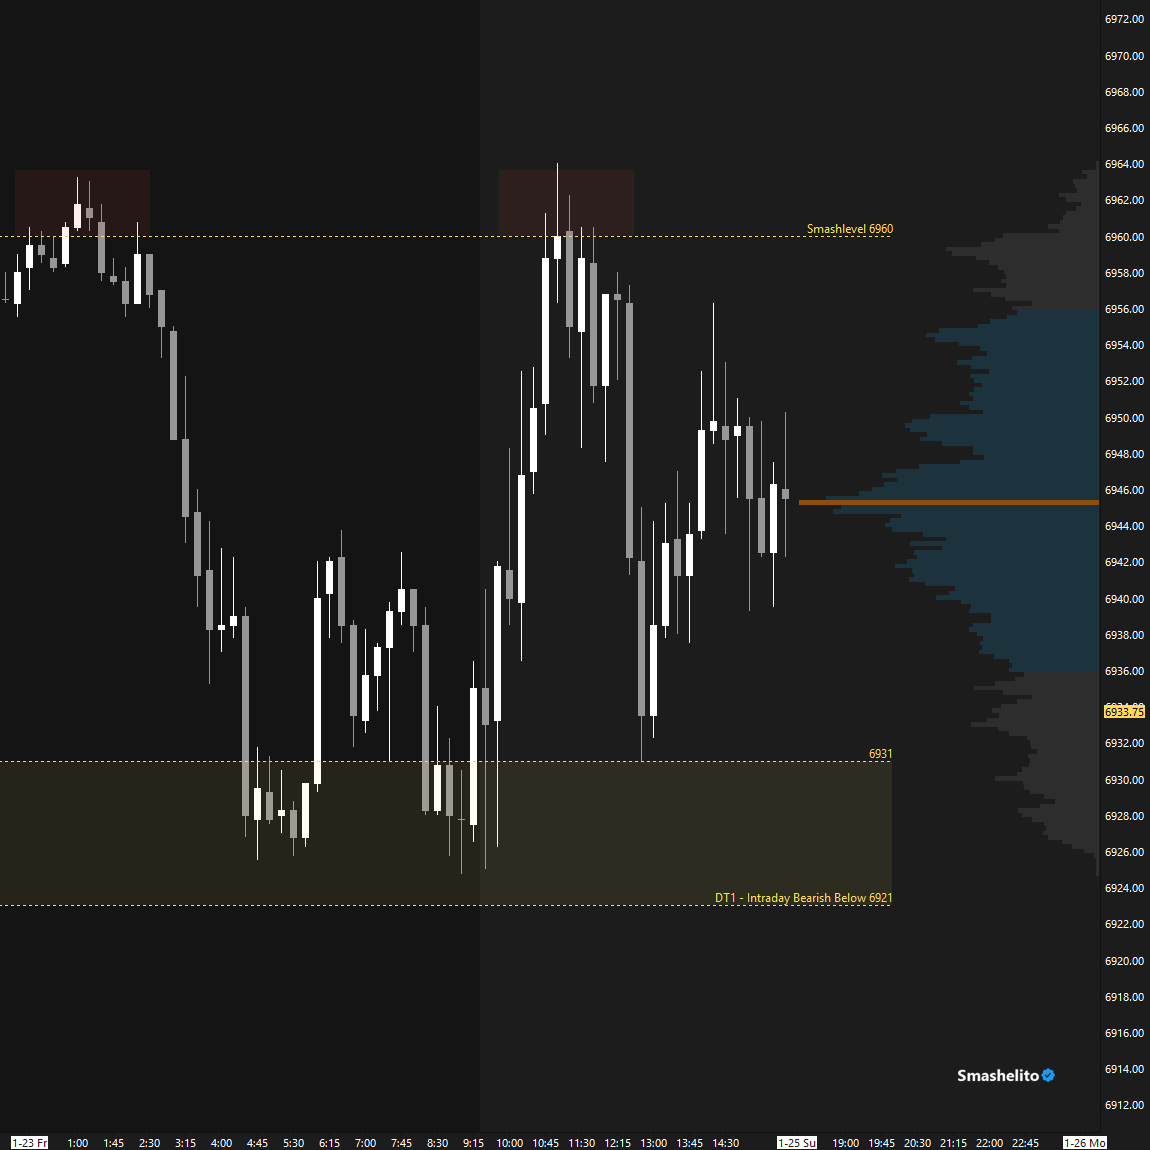
Price Action vs. Weekly Levels
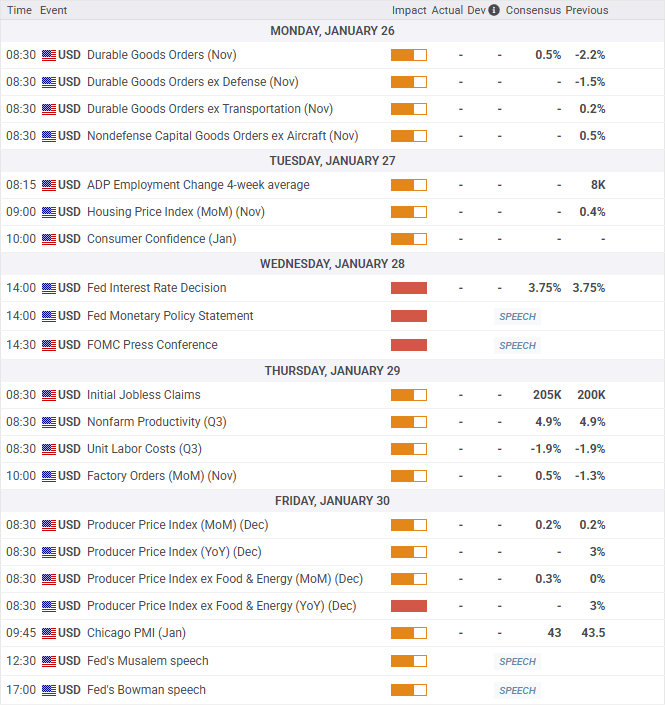
Economic & Earnings Calendar
Central Standard Time
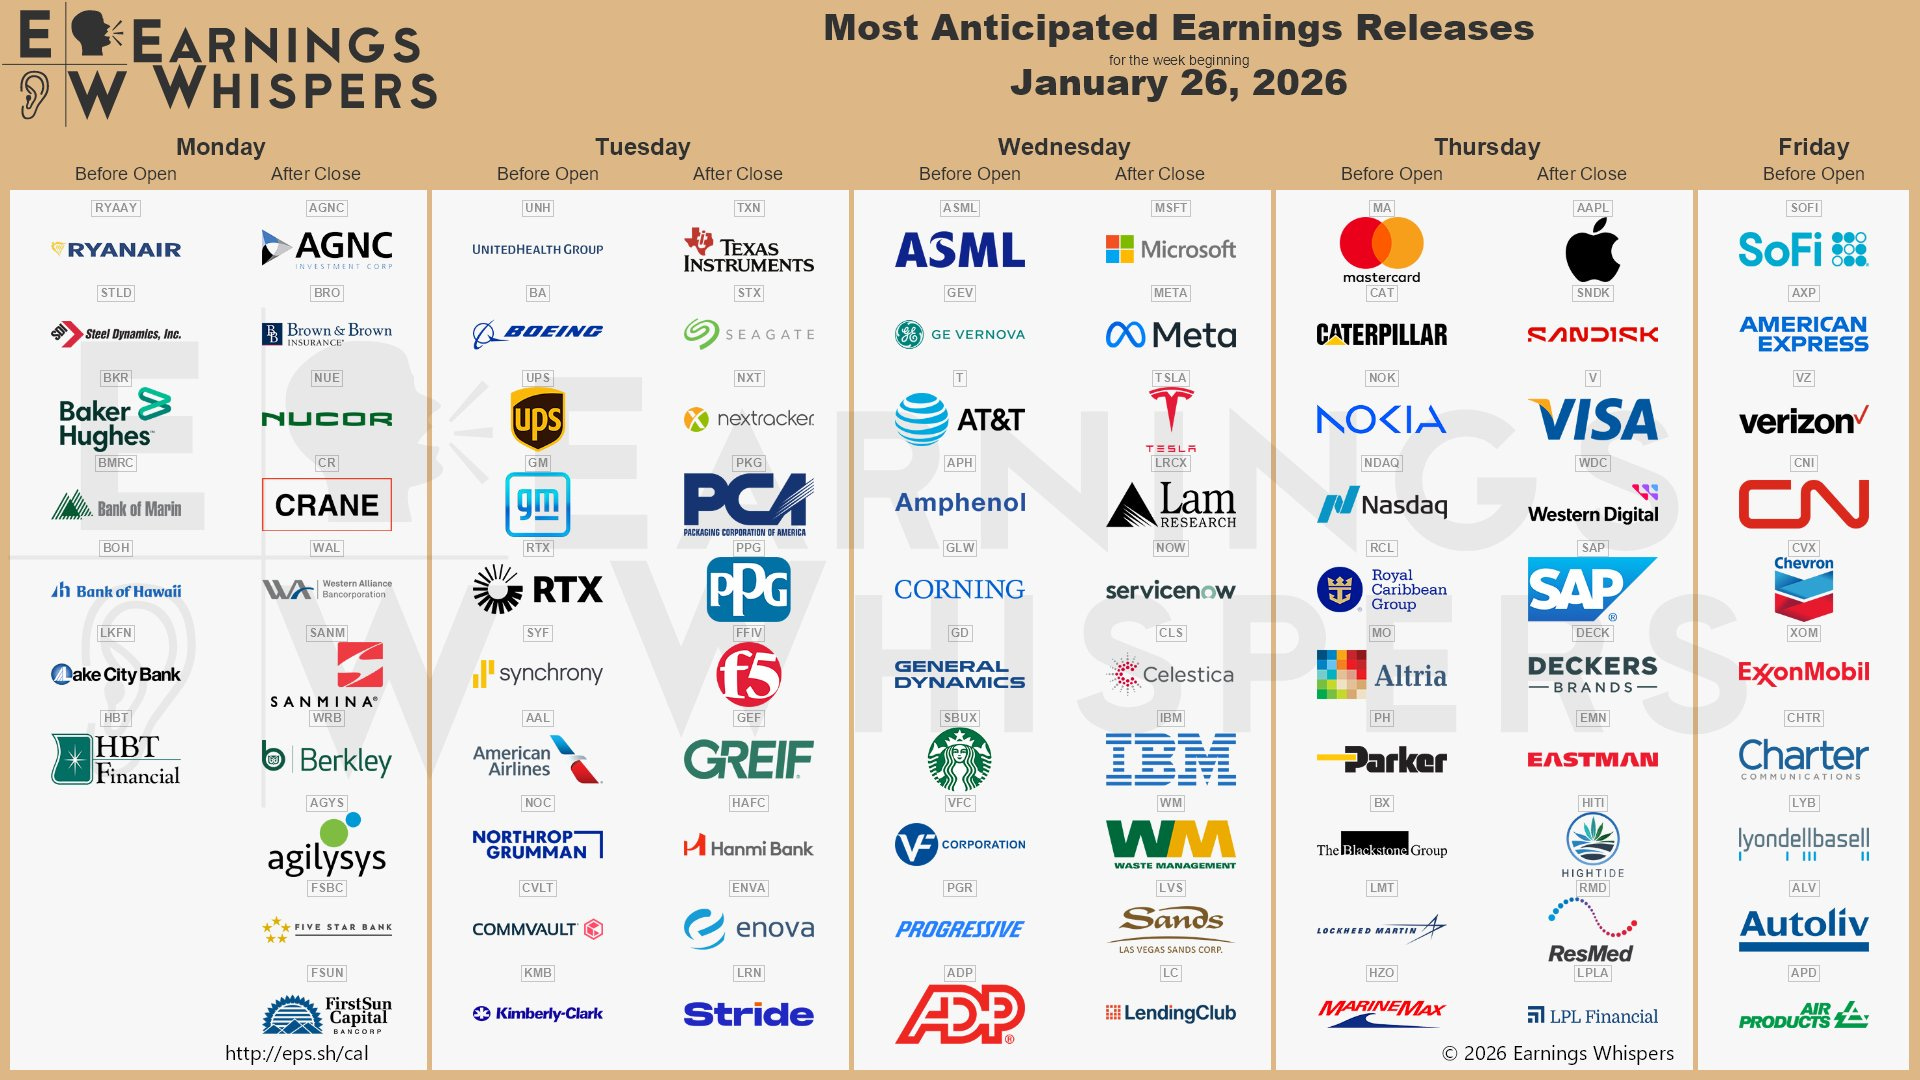
Earnings Whispers
Market Structure
🟨 Daily: BALANCE → 2-day → High: 6969 / Low: 6925
🟥 Weekly: OTFD → Ends at: 6969
🟩 Monthly: OTFU → Ends at: 6775.50
Balance: A market condition where price consolidates within a defined range, reflecting indecision as the market awaits more market-generated information. We apply balance guidelines—favoring fade trades at range extremes (highs/lows) and preparing for breakout setups if balance resolves.
One-Time Framing Up (OTFU): A market condition where each subsequent bar forms a higher low, signaling a strong upward trend.
One-Time Framing Down (OTFD): A market condition where each subsequent bar forms a lower high, signaling a strong downward trend.
Contextual Analysis & Plan
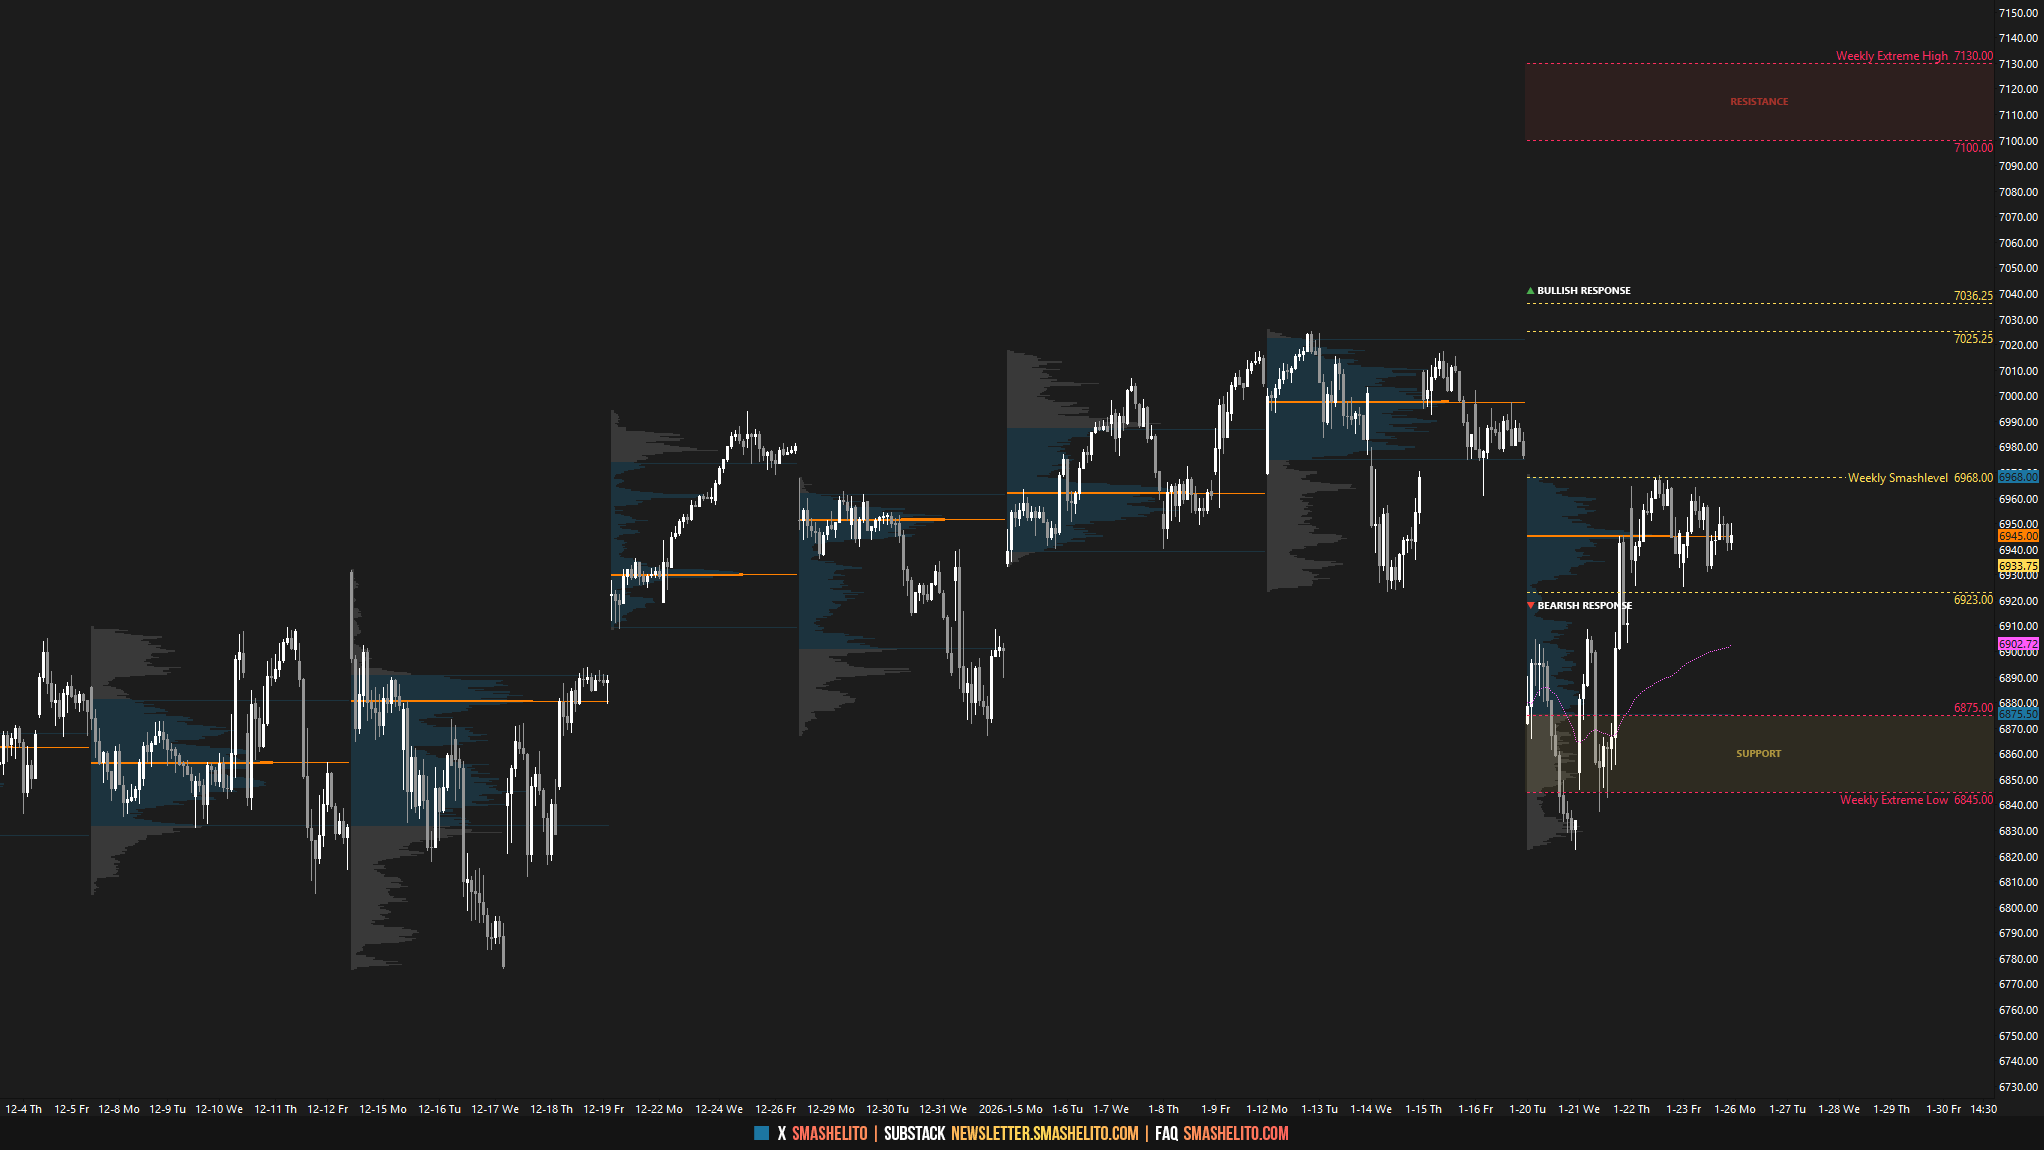
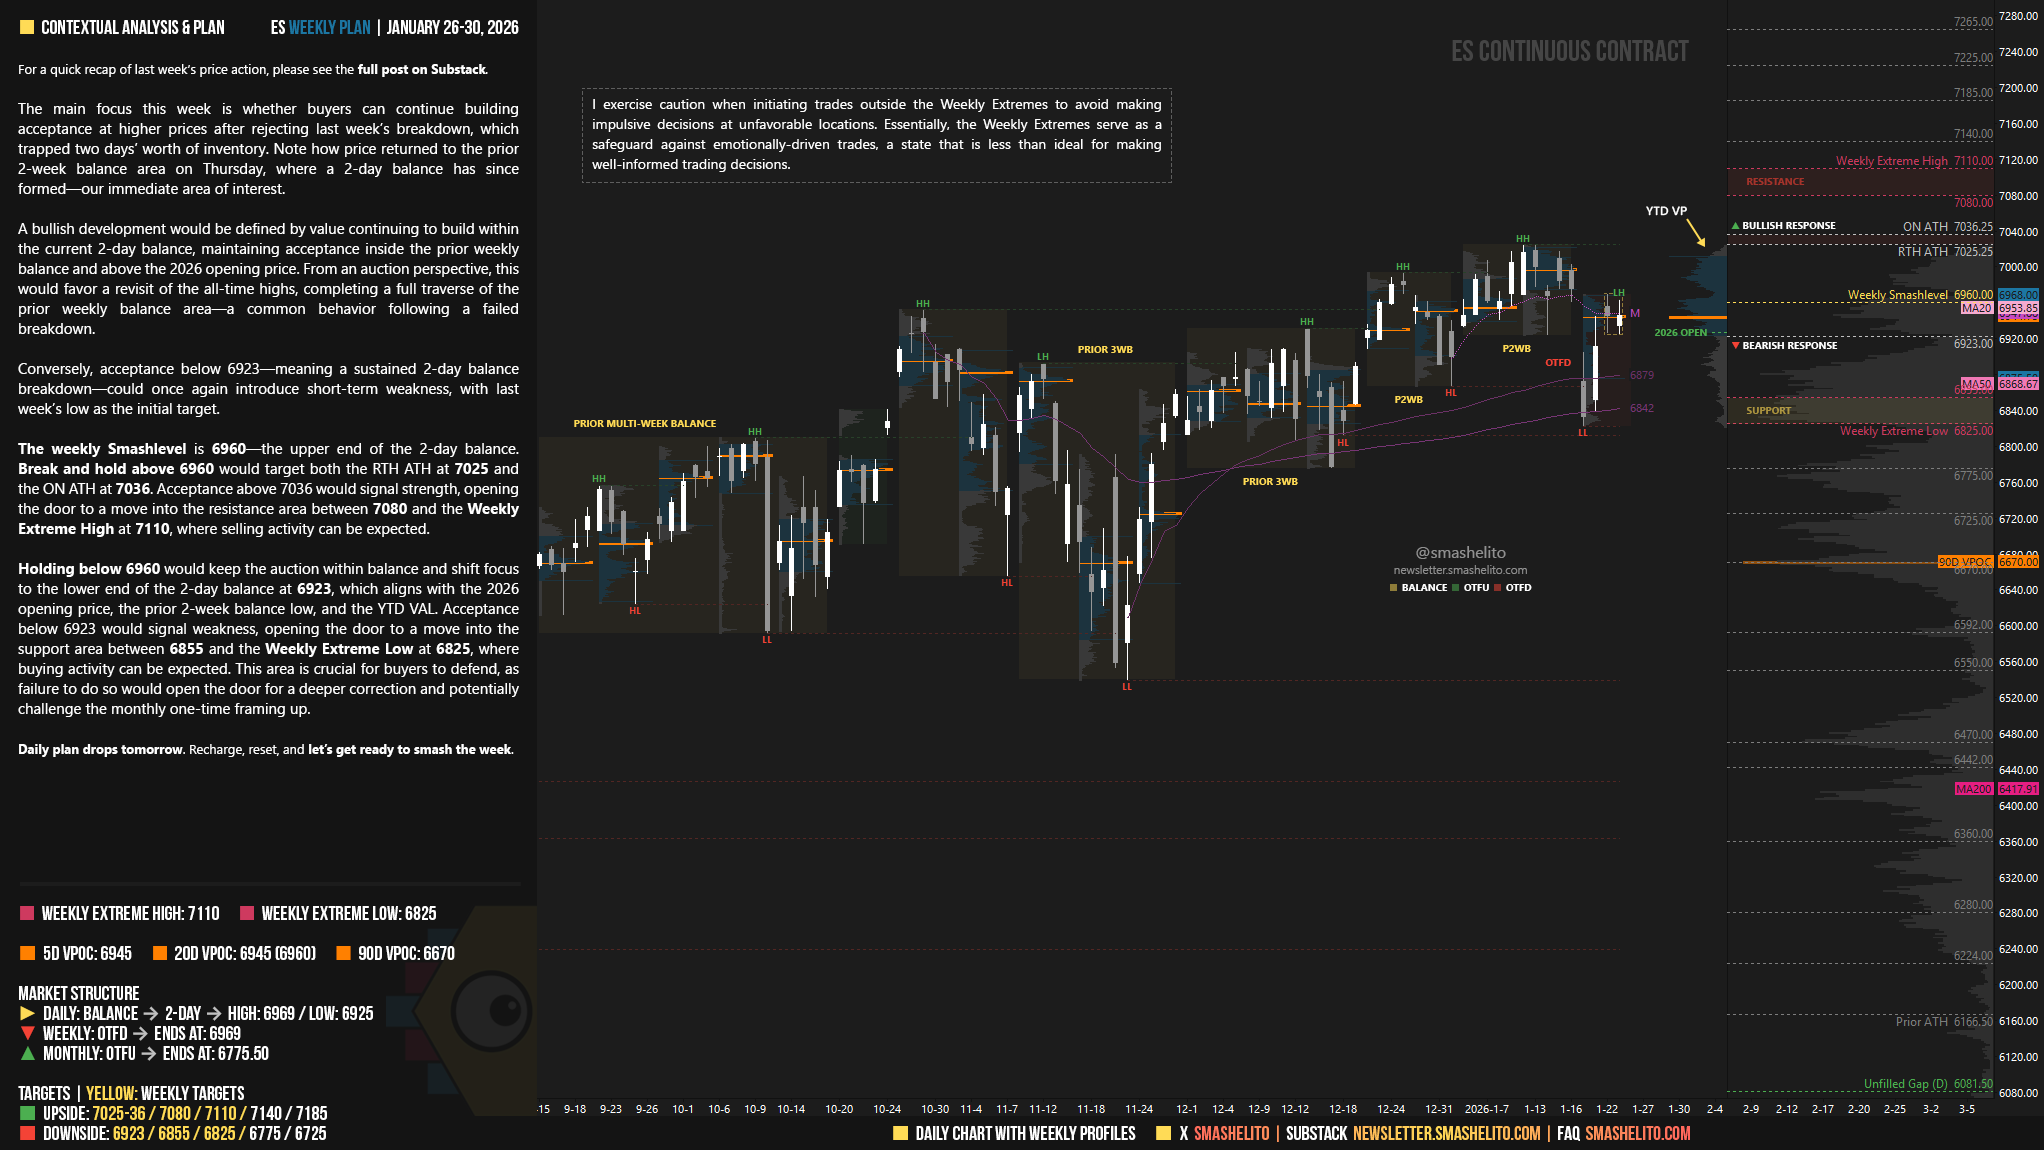
The main focus this week is whether buyers can continue building acceptance at higher prices after rejecting last week’s breakdown, which trapped two days’ worth of inventory. Note how price returned to the prior 2-week balance area on Thursday, where a 2-day balance has since formed—our immediate area of interest.
A bullish development would be defined by value continuing to build within the current 2-day balance, maintaining acceptance inside the prior weekly balance and above the 2026 opening price. From an auction perspective, this would favor a revisit of the all-time highs, completing a full traverse of the prior weekly balance area—a common behavior following a failed breakdown.
Conversely, acceptance below 6923—meaning a sustained 2-day balance breakdown—could once again introduce short-term weakness, with last week’s low as the initial target.
The weekly Smashlevel is 6960—the upper end of the 2-day balance. Break and hold above 6960 would target both the RTH ATH at 7025 and the ON ATH at 7036. Acceptance above 7036 would signal strength, opening the door to a move into the resistance area between 7080 and the Weekly Extreme High at 7110, where selling activity can be expected.
Holding below 6960 would keep the auction within balance and shift focus to the lower end of the 2-day balance at 6923, which aligns with the 2026 opening price, the prior 2-week balance low, and the YTD VAL. Acceptance below 6923 would signal weakness, opening the door to a move into the support area between 6855 and the Weekly Extreme Low at 6825, where buying activity can be expected. This area is crucial for buyers to defend, as failure to do so would open the door for a deeper correction and potentially challenge the monthly one-time framing up.
Key Levels of Interest
In the upcoming week, I will closely observe the behavior around 6960.
Break and hold above 6960 would target 7025-36 / 7080 / 7110* / 7140 / 7185
Holding below 6960 would target 6923 / 6855 / 6825* / 6775 / 6725
*Weekly Extremes. I exercise caution when initiating trades outside the Weekly Extremes to avoid making impulsive decisions at unfavorable locations. Essentially, the Weekly Extremes serve as a safeguard against emotionally-driven trades, a state that is less than ideal for making well-informed trading decisions.
Daily plan drops tomorrow. Recharge, reset, and let’s get ready to smash the week.
Thanks Smash! This could be an interesting week. Enjoy the weekend.
Thank you as always!