ES Weekly Plan | December 23-27, 2024
My expectations for the upcoming week.
Visual Representation
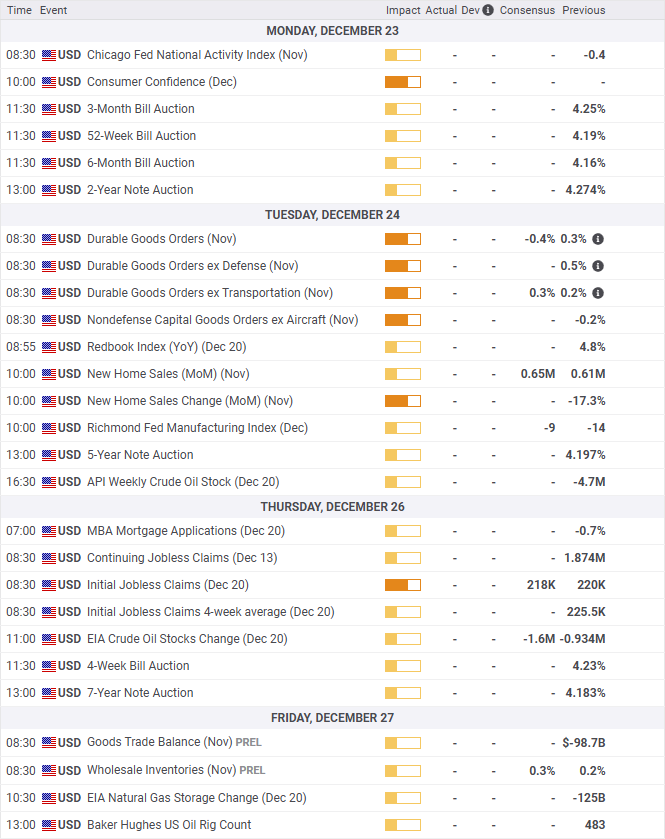
Economic Calendar
Market Structure
🟨 DAILY: BALANCE | 2D | 6050.75-5898.25
🟨 WEEKLY: BALANCE | 1W | 6163.75-5898.25
🟩 MONTHLY: OTFU | ENDS: 5724.25
Contract Rollover
Last week, I transitioned to the ESH25 contract. My charts are not back-adjusted, so historical prices remain unchanged. This leads to potential discrepancies with charts that are back-adjusted. This choice is a matter of personal preference—neither approach is inherently superior, as both have their advantages and disadvantages. For short-term traders, the impact is minimal since we navigate the market day by day, and my weekly targets remain the same regardless of the method used.
Contextual Analysis
During the previous week, the highlight was undoubtedly the FOMC meeting on Wednesday, which triggered a significant move to the downside, effectively wiping out multiple weeks' worth of gains. The Weekly Extreme Low of 6040 was breached, and the Monthly Extreme Low of 5905 was nearly tagged Wednesday after-hours. The key takeaway, mentioned in Thursday’s daily plan, was that it was unfavorable to chase further downside. This is simply a result of the market being overly emotional and moving too quickly, conditions under which you don't want to make emotionally driven trading decisions. Thursday saw a bounce, with sellers reloading 100 handles higher at 6005 for a continuation lower. On Friday, we gapped lower, only to reverse course, triggering a notable short-covering rally (retesting 6040) after trapping many sellers at unfavorable (poor) location.

For this shortened week, the main focus will be on buyers' ability to further retrace the FOMC weakness, following Friday‘s short-covering rally that tagged Wednesday’s halfback, where sellers re-emerged. Acceptance above 6045 signals strength, while a drop below 5960 indicates weakness, opening the door for a revisit of last week's lows.
The weekly Smashlevel is 6005, representing Thursday’s high which ended the daily one-time framing down after being breached on Friday. Break and hold above 6005 would target the Prior ATH at 6045, where sellers were active on Friday. Acceptance above 6045 signals strength, targeting the resistance area from 6090 to the Weekly Extreme High of 6120, where selling activity can be expected. This resistance area is the breakdown point from the FOMC weakness that buyers need to regain to negate the move.
Holding below 6005 would target last week’s most traded price by volume (VPOC) at 5960. Acceptance below 5960 signals weakness, targeting the support area from 5910 to the Weekly Extreme Low of 5880, where buying activity can be expected. Defending this support area is crucial for buyers; otherwise, it opens the door for a move back to the long-term value (90 VPOC) at 5785, effectively filling the gap at 5813.50 in the process.
As usual, a detailed daily plan will be published tomorrow. In the meantime, enjoy the rest of your weekend!
Levels of Interest
In the upcoming week, I will closely observe the behavior around 6005.
Break and hold above 6005 would target 6045 / 6090 / 6120 / 6136 / 6170
Holding below 6005 would target 5960 / 5910 / 5880 / 5856 / 5813
*Weekly Extremes. I exercise caution when initiating trades outside the Weekly Extremes to avoid making impulsive decisions at unfavorable locations. Essentially, the Weekly Extremes serve as a safeguard against emotionally-driven trades, a state that is less than ideal for making well-informed trading decisions.


Thanks, buddy! Had an awesome Friday with longs working in our favor—hope the momentum carries into this short trading week!
Thanks as always! Santa rally or not...