
ES Weekly Plan | December 15-19, 2025
Recap, Market Context & Key Levels for the Week Ahead

Welcome to this week’s plan. Inside, you’ll find a quick review of last week’s price action, key economic events, market structure, context for the week ahead, and the levels I’ll be focusing on. Let’s get prepared.
Contents
Last Week in Review & Bonus Chart
Economic & Earnings Calendar
Market Structure
Contract Rollover
Contextual Analysis & Plan
Key Levels of Interest
Last Week in Review & Bonus Chart
Last week’s plan:

Coming into last week, the key question was whether buyers could sustain upside momentum and extend the pattern of higher lows on the daily chart after Friday retraced its opening strength on December 5. Strength required value to build above the prior week’s VAH at 6868, while failure to do so would open the door for a move toward the unfilled gap at 6792.50.
Monday’s session failed to sustain the pattern of higher lows on the daily chart, opening the door to weakness and bringing the daily back into balance. Returning to the prior week’s value area, two-sided activity was expected heading into Wednesday’s FOMC meeting. On Tuesday, an inside day formed, which came as no surprise.
Change took place on Wednesday, as the market formed a double-distribution trend day to the upside, closing within its upper distribution, away from both the short-term value (5D VPOC) and medium-term value (20D VPOC). The key on Thursday was to monitor whether this trend day would be accepted or rejected. Thursday’s session was eventful, to say the least. Price initially rejected the trend day by opening within Thursday’s lower distribution; however, buyers managed to return into Thursday’s upper distribution, closing above both the prior week’s high and last month’s high at 6905 and 6909, respectively.
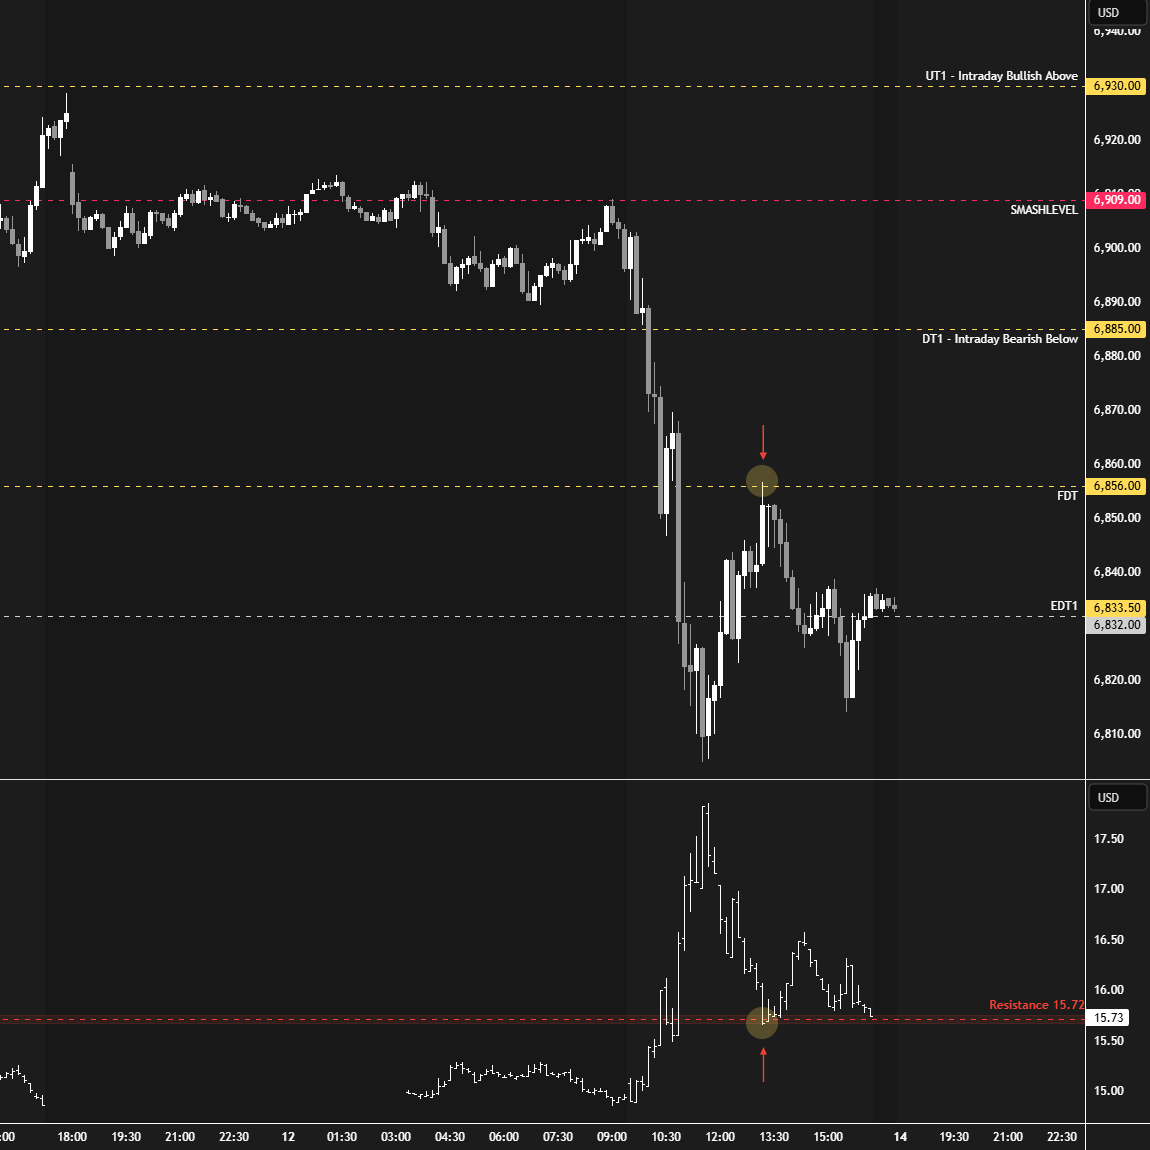
As discussed in Friday’s Plan, the 6905 and 6909 levels were pivotal to observe in order to gauge the market’s strength or weakness. Buyers ultimately failed to maintain 6909, triggering notable weakness that cleared and exceeded all intraday downside targets. Note the significant confluence with Friday’s afternoon rally high, which tagged the FDT 6856 almost to the tick, with the VIX retesting its broken resistance from above (see Figure 1).
Overall, we had another fairly quiet week in terms of range, with price holding between the initial weekly upside target at 6909 and the initial downside target at 6792. I’m switching to the ESH26 (March) contract on Monday.
Price Action vs. Weekly Levels
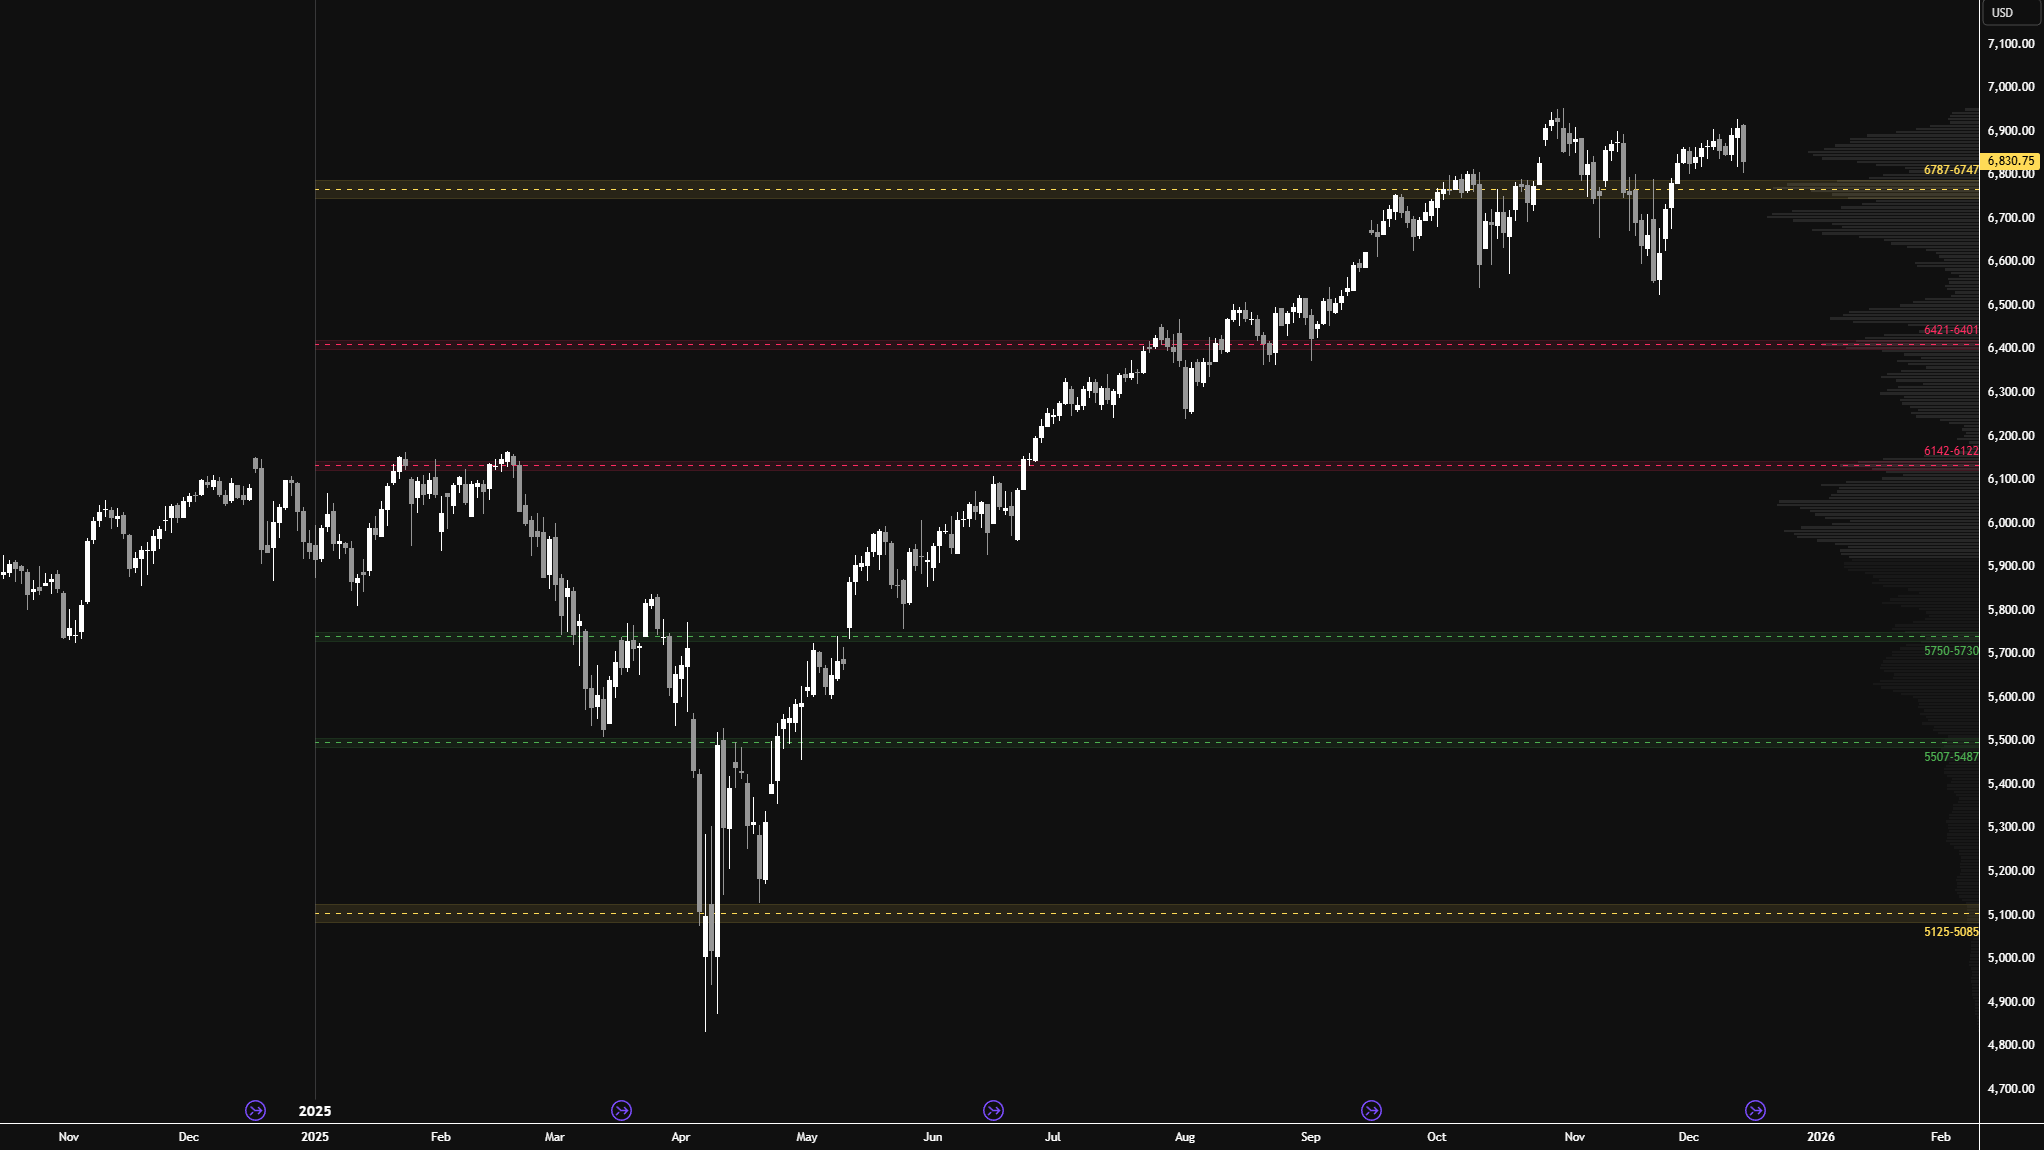
I will continue to include the HTF chart from a good friend of mine, featuring levels generated by one of his models at the start of 2025. As you can see, this year’s price action has respected these levels remarkably well.
The context remains unchanged: buyers remain in control above the 6747–6787 area of interest, meaning caution fading—at least until this area fails. Don’t forget, unfinished business remains at the all-time highs, with an untested overnight ATH still in play.
Higher Time Frame Levels
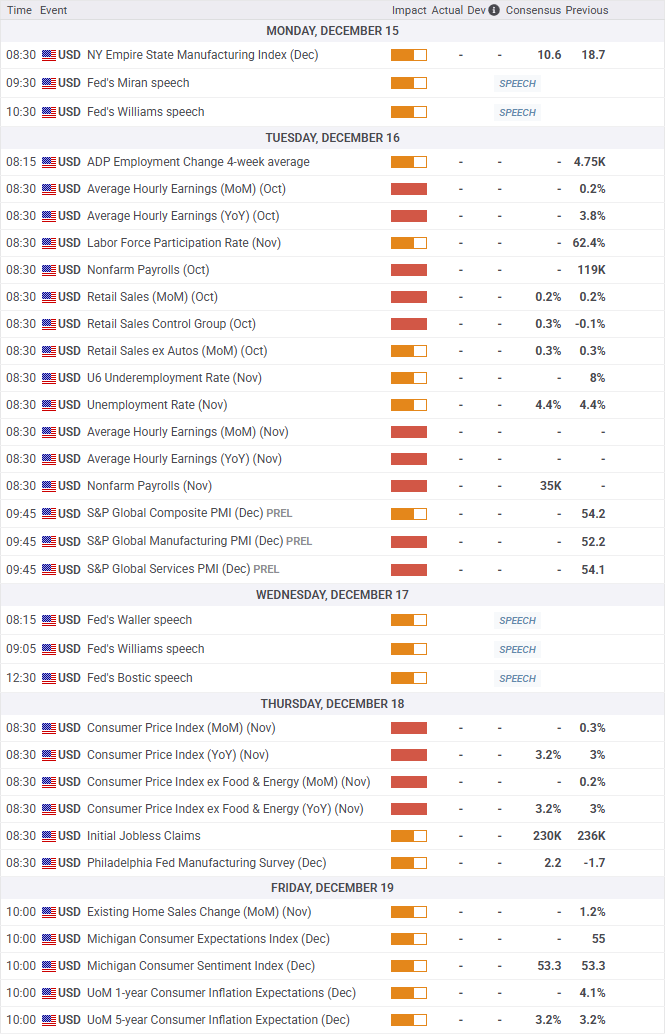
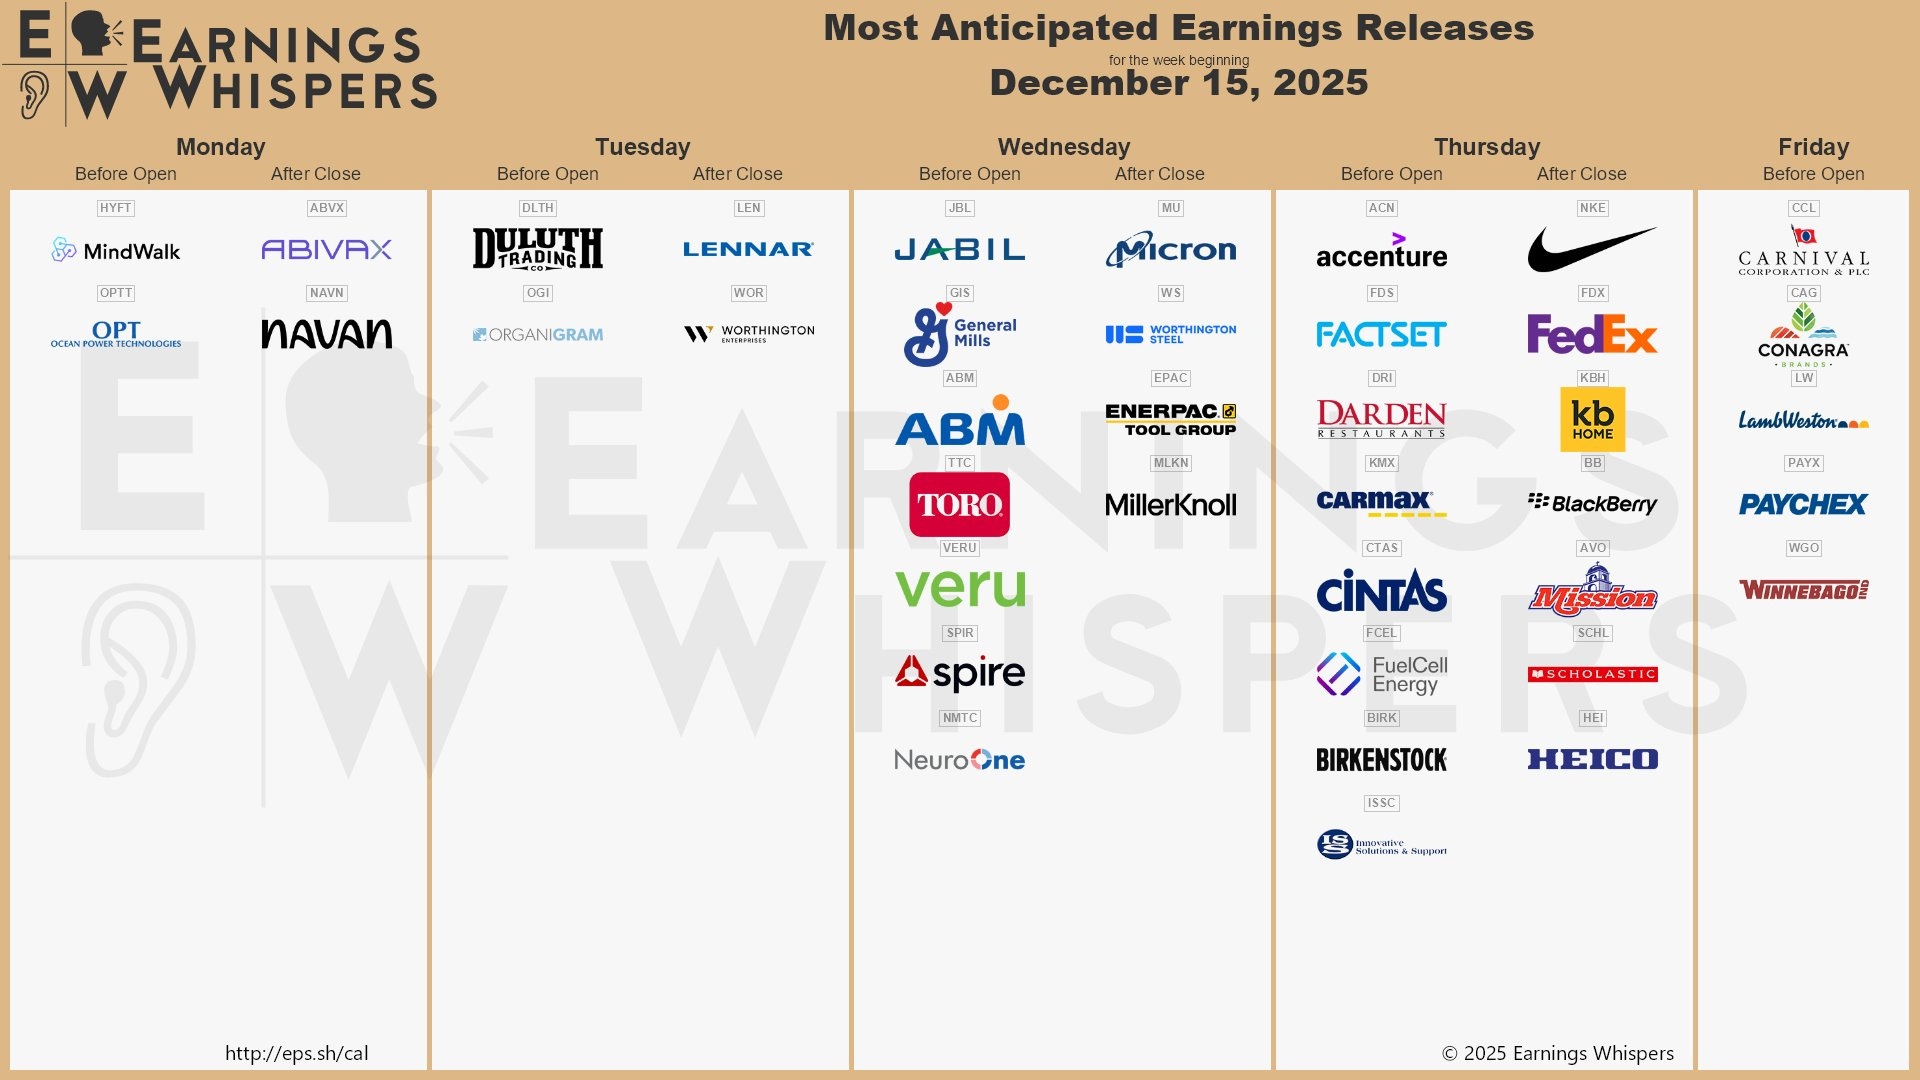
Economic & Earnings Calendar
Central Standard Time
Earnings Whispers
Market Structure
🟨 Daily: BALANCE → 10-Day → High: 6909.25 / Low: 6805
🟨 Weekly: BALANCE → 2-Week → High: 6909.25 / Low: 6805
🟨 Monthly: BALANCE → 2-Month → High: 6952 / Low: 6539
Balance: A market condition where price consolidates within a defined range, reflecting indecision as the market awaits more market-generated information. We apply balance guidelines—favoring fade trades at range extremes (highs/lows) and preparing for breakout setups if balance resolves.
One-Time Framing Up (OTFU): A market condition where each subsequent bar forms a higher low, signaling a strong upward trend.
One-Time Framing Down (OTFD): A market condition where each subsequent bar forms a lower high, signaling a strong downward trend.
FYI: During rollover, one-time framing and balance can look distorted because of the roll gap. I don’t back-adjust my charts, so expect these concepts to be temporarily skewed.
Contract Rollover
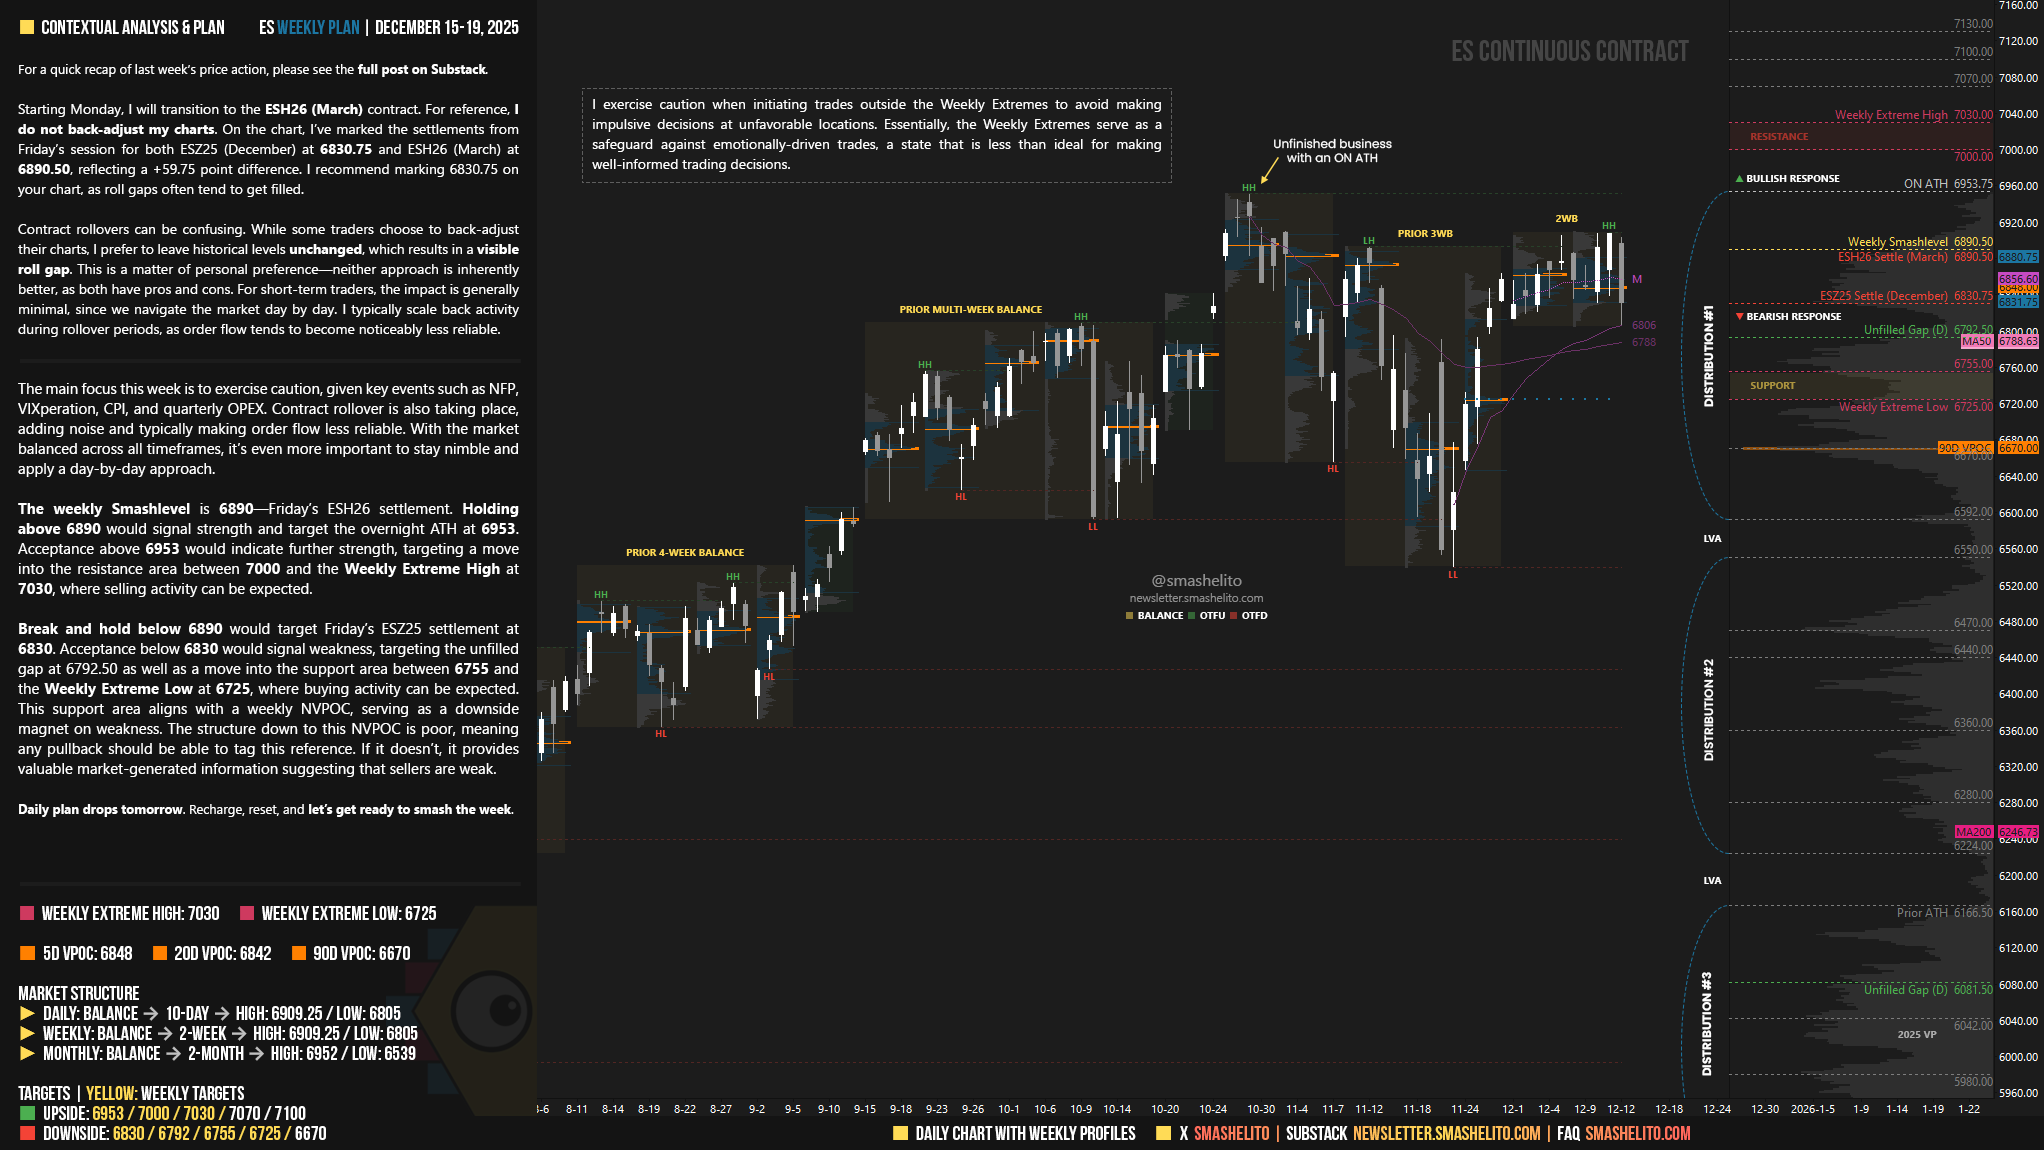
Starting Monday, I will transition to the ESH26 (March) contract. For reference, I do not back-adjust my charts. On the chart, I’ve marked the settlements from Friday’s session for both ESZ25 (December) at 6830.75 and ESH26 (March) at 6890.50, reflecting a +59.75 point difference. I recommend marking 6830.75 on your chart, as roll gaps often tend to get filled.
Contract rollovers can be confusing. While some traders choose to back-adjust their charts, I prefer to leave historical levels unchanged, which results in a visible roll gap. This is a matter of personal preference—neither approach is inherently better, as both have pros and cons. For short-term traders, the impact is generally minimal, since we navigate the market day by day. I typically scale back activity during rollover periods, as order flow tends to become noticeably less reliable.
Contextual Analysis & Plan
The main focus this week is to exercise caution, given key events such as NFP, VIXperation, CPI, and quarterly OPEX. Contract rollover is also taking place, adding noise and typically making order flow less reliable. With the market balanced across all timeframes, it’s even more important to stay nimble and apply a day-by-day approach.
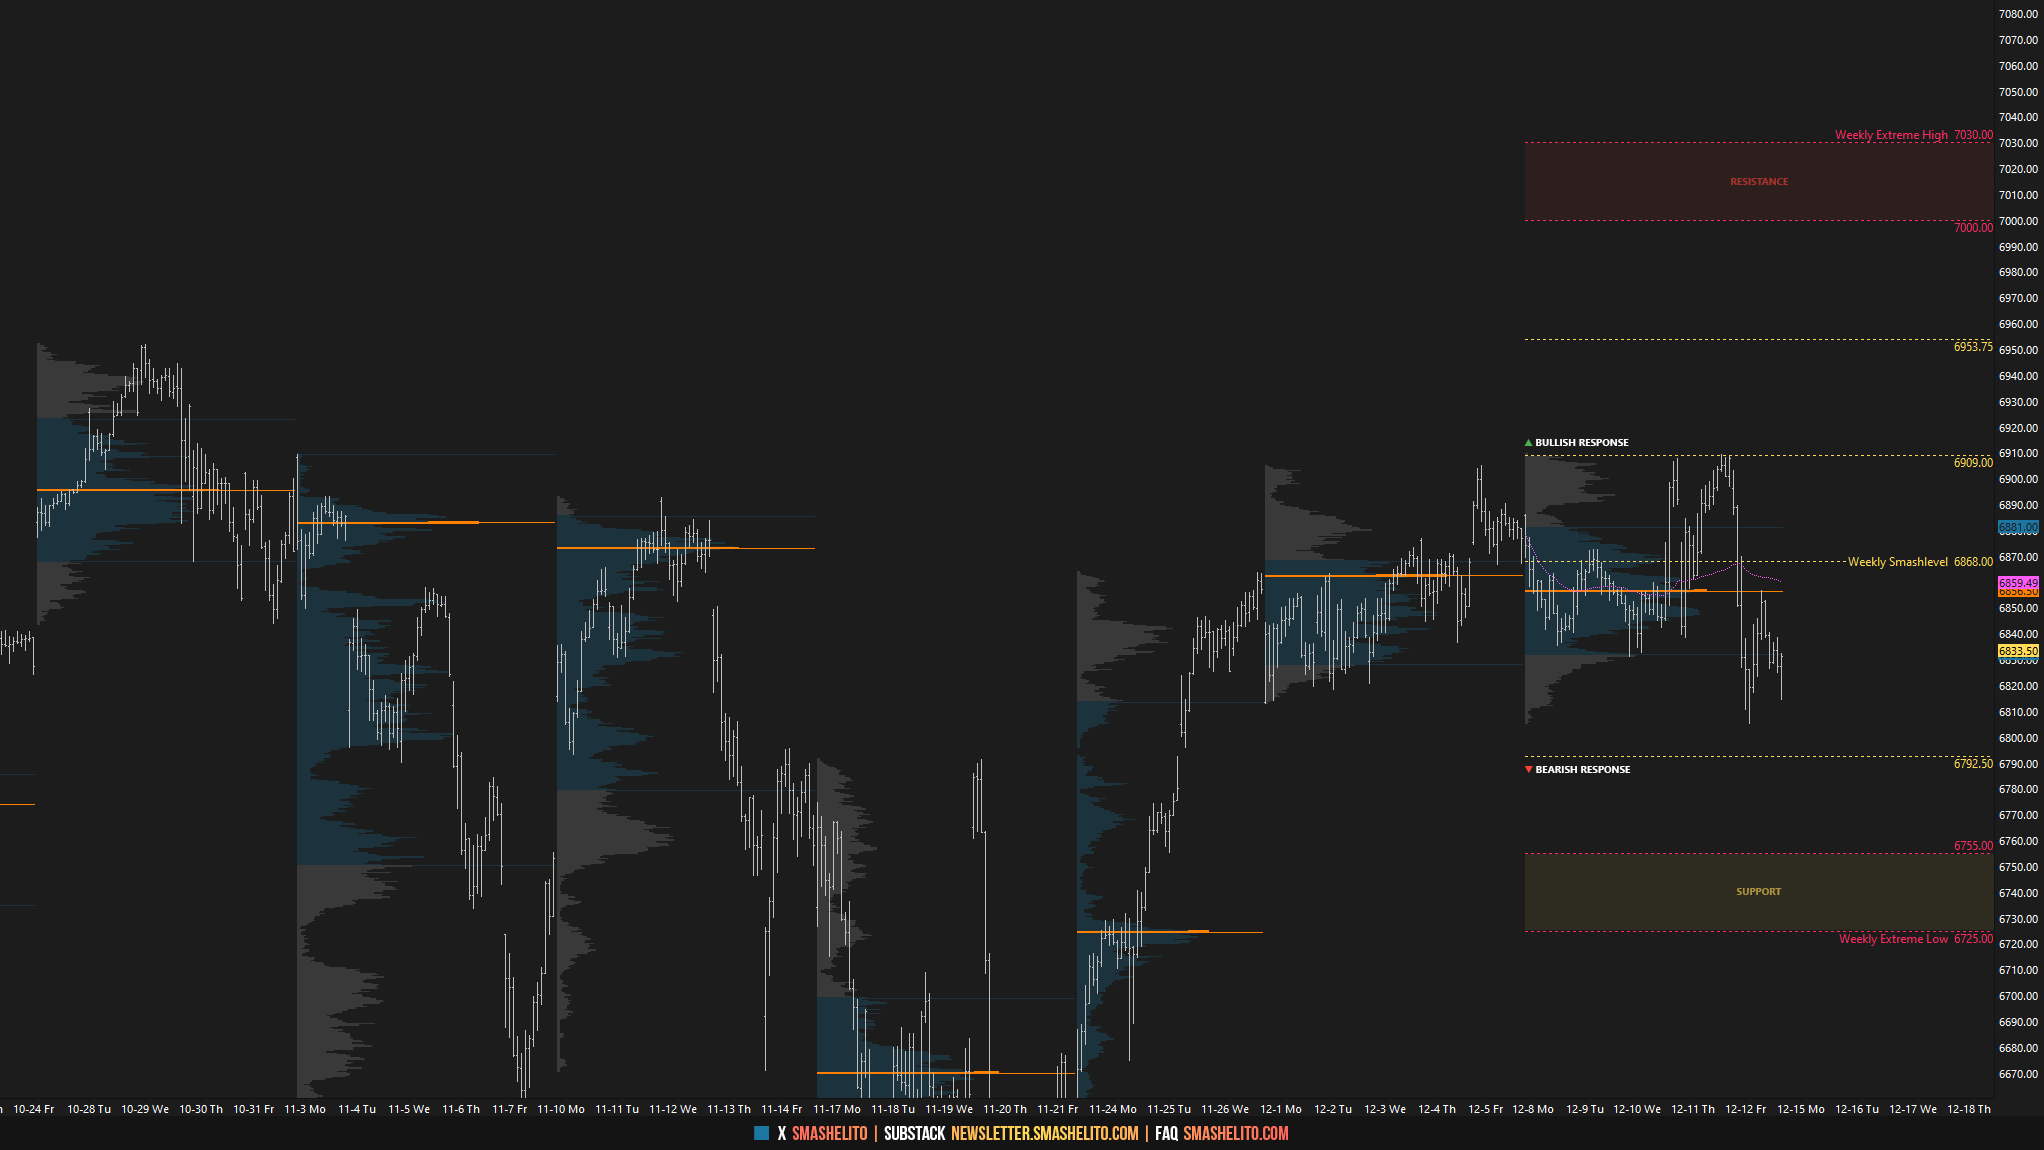
The weekly Smashlevel is 6890—Friday’s ESH26 settlement. Holding above 6890 would signal strength and target the overnight ATH at 6953. Acceptance above 6953 would indicate further strength, targeting a move into the resistance area between 7000 and the Weekly Extreme High at 7030, where selling activity can be expected.
Break and hold below 6890 would target Friday’s ESZ25 settlement at 6830. Acceptance below 6830 would signal weakness, targeting the unfilled gap at 6792.50 as well as a move into the support area between 6755 and the Weekly Extreme Low at 6725, where buying activity can be expected. This support area aligns with a weekly NVPOC, serving as a downside magnet on weakness. The structure down to this NVPOC is poor, meaning any pullback should be able to tag this reference. If it doesn’t, it provides valuable market-generated information suggesting that sellers are weak.
Key Levels of Interest
In the upcoming week, I will closely observe the behavior around 6890.
Holding above 6890 would target 6953 / 7000 / 7030* / 7070 / 7100
Break and hold below 6890 would target 6830 / 6792 / 6755 / 6725* / 6670
*Weekly Extremes. I exercise caution when initiating trades outside the Weekly Extremes to avoid making impulsive decisions at unfavorable locations. Essentially, the Weekly Extremes serve as a safeguard against emotionally-driven trades, a state that is less than ideal for making well-informed trading decisions.
Daily plan drops tomorrow. Recharge, reset, and let’s get ready to smash the week.
Thanks as ever. I have to say that last week's smash level at the PW VAH was absolutely spot on and served as a useful guide for bias consideration.
Great work, thank you 🙏