ES Weekly Plan | December 11-15, 2023
My expectations for the upcoming week.
Visual Representation
Market Structure
🟩 DAILY: OTFU | ENDS: 4578.25
🟩 WEEKLY: OTFU | ENDS: 4552
🟨 MONTHLY: BALANCE | 5M | H: 4633.50 L: 4122.25
Contextual Analysis
Starting from Monday, I will be transitioning to the ESH24 (March) contract. Please note that I do not back-adjust my charts. On the chart, I have marked the settlements for both ESZ23 (December) (4607.50) and ESH24 (March) (4660.25) from Friday’s session (+52.75 difference). I suggest marking 4607.50 on your chart, as roll gaps often tend to get filled. The levels for next week are based on Friday’s session from the ESH24 (March) contract. Contract rollovers often give rise to confusion. While some traders choose to back-adjust their charts, I personally prefer to keep my past levels unchanged without adopting this approach and simply deal with the roll gap. Nevertheless, regardless of your choice to back-adjust or not, the pivotal aspect is that the weekly levels of interest remain the same.
During the previous week, the market maintained its state of short-term balance until the Friday session, during which an attempt was made to break out of this consolidation phase.

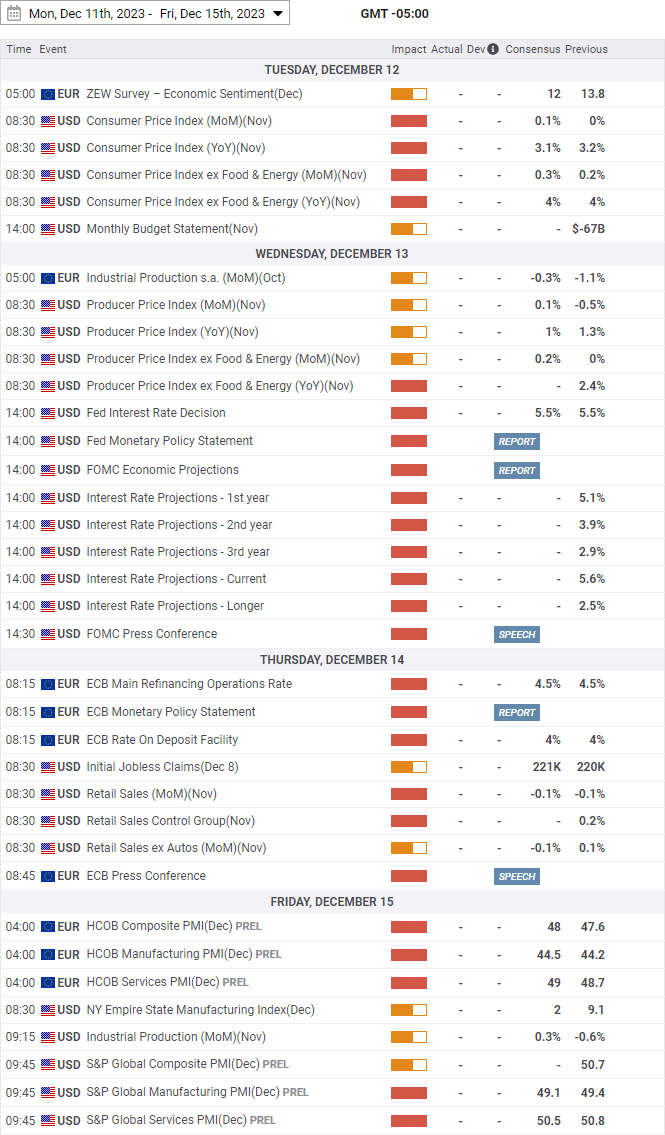
For this week, a series of significant events is set to unfold, including CPI, PPI, FOMC, Retail Sales, and OPEX. This lineup suggests that there is limited justification for making any bold market predictions regarding its direction. The emphasis on day-by-day navigation continues to be paramount.
The weekly level of interest is 4660, which represents Friday’s ESH24 (March) settlement. Holding above 4660, indicating continuation of this imbalance, would target the high volume area from late 2021 at 4690. Break and hold above 4690, would target the resistance area from 4715 to the Weekly Extreme High of 4745, where selling activity can be expected. Take note of the all time high (ATH) at 4808.25 (non-back adjusted).
Break and hold below 4660 would target the high of July at 4633.50. Break and hold below 4633.50 would target the ESZ23 (December) settlement at 4607.50, as well as the support area from 4600 to the Weekly Extreme Low of 4570, where buying activity can be expected. Note how this support area coincides with the high volume node (HVN) observed over the past four weeks. For any significant change to occur in the bigger picture, the sellers would need to break and hold below the Weekly Extreme Low. A preference is placed on achieving a weekly close below this level, as it would indicate the potential for a more profound decline.
As usual, a detailed daily plan will be published tomorrow. In the meantime, enjoy the rest of your weekend!
Levels of Interest
In the upcoming week, I will observe 4660
Holding above 4660 would target 4690 / 4715 / 4745* / 4780 / 4808
Break and hold below 4660 would target 4633 / 4600 / 4570* / 4550 / 4520
*Weekly Extremes. I exercise caution when initiating trades outside the Weekly Extremes to avoid making impulsive decisions at unfavorable locations. Essentially, the Weekly Extremes serve as a safeguard against emotionally-driven trades, a state that is less than ideal for making well-informed trading decisions.
Economic Calendar
Disclaimer: Futures and options trading involves a high level of risk, with the potential for substantial losses. The information provided in this newsletter is for informational purposes only and is not intended to be a trade recommendation. It is the responsibility of the reader to make their own investment decisions and they should seek the advice of a qualified securities professional before making any investments. The owners/authors of this newsletter are not certified as registered financial professionals or investment advisers.


Most of the times your 1st level lower or 1st level higher are very accurate. Thanks.
For that reason , Monday very early in the morning, we might see 4633.
Also because there's not any data to stimulate to the upside the ES_F.
The opposite, BoJ make announcements for hiking rates . Which is impacting directly UST 10ys bonds. Are getting higher due to the significant reduction of the carry trade. ES_F rallies because of lthe lowering of 2ys and 10ys yields. If higher , it will roll over.
Good to note all important Data readings. They're influencing a lot institutional traders , who move the needle significantly.
Monday 11 December, 13.00hr EST 10ys auction. Bond market starts getting volatile,
20 min earlier. Consequently, ES_F becomes volatile too.
Hope that the auction will go well and ES_F will go up. The BoJ decisions , earlier in Monday have an impact on UST 10ys bonds.