
ES Weekly Plan | December 1-5, 2025
Recap, Market Context & Key Levels for the Week Ahead

Welcome to this week’s plan. Inside, you’ll find a quick review of last week’s price action, key economic events, market structure, context for the week ahead, and the levels I’ll be focusing on. Let’s get prepared.
Contents
Last Week in Review & Bonus Chart
Economic & Earnings Calendar
Market Structure
Contextual Analysis & Plan
Key Levels of Interest
Last Week in Review & Bonus Chart
Last week’s plan:

Heading into this shortened week, the main focus was on the behavior around last month’s low at 6592, which marks the prior multi-week balance low. Sellers breached this level last week, officially ending the monthly one-time framing up, yet both pushes below 6592 were met with responsive buying—making this a critical area to monitor.
A positive response would involve reclaiming the high volume node at 6670, a level that buyers struggled to hold the prior week. Accomplishing this would open the door to cleaning up Thursday’s poor structure following the emotional trend day.
Sellers aimed to maintain downside pressure by breaking—and establishing acceptance below—6592, effectively trapping 10 weeks’ worth of inventory and opening the door to a deeper correction.
Monday kicked off the week with sellers defending the high volume node at 6670 overnight, resulting in a solid move lower (see Figure 1). This liquidation break was completely retraced prior to the RTH open.
Buyers then managed to reclaim 6670 during the RTH session, a positive development that set the stage for cleaning up poor structure left behind the last week. A double distribution trend day was established in the process.
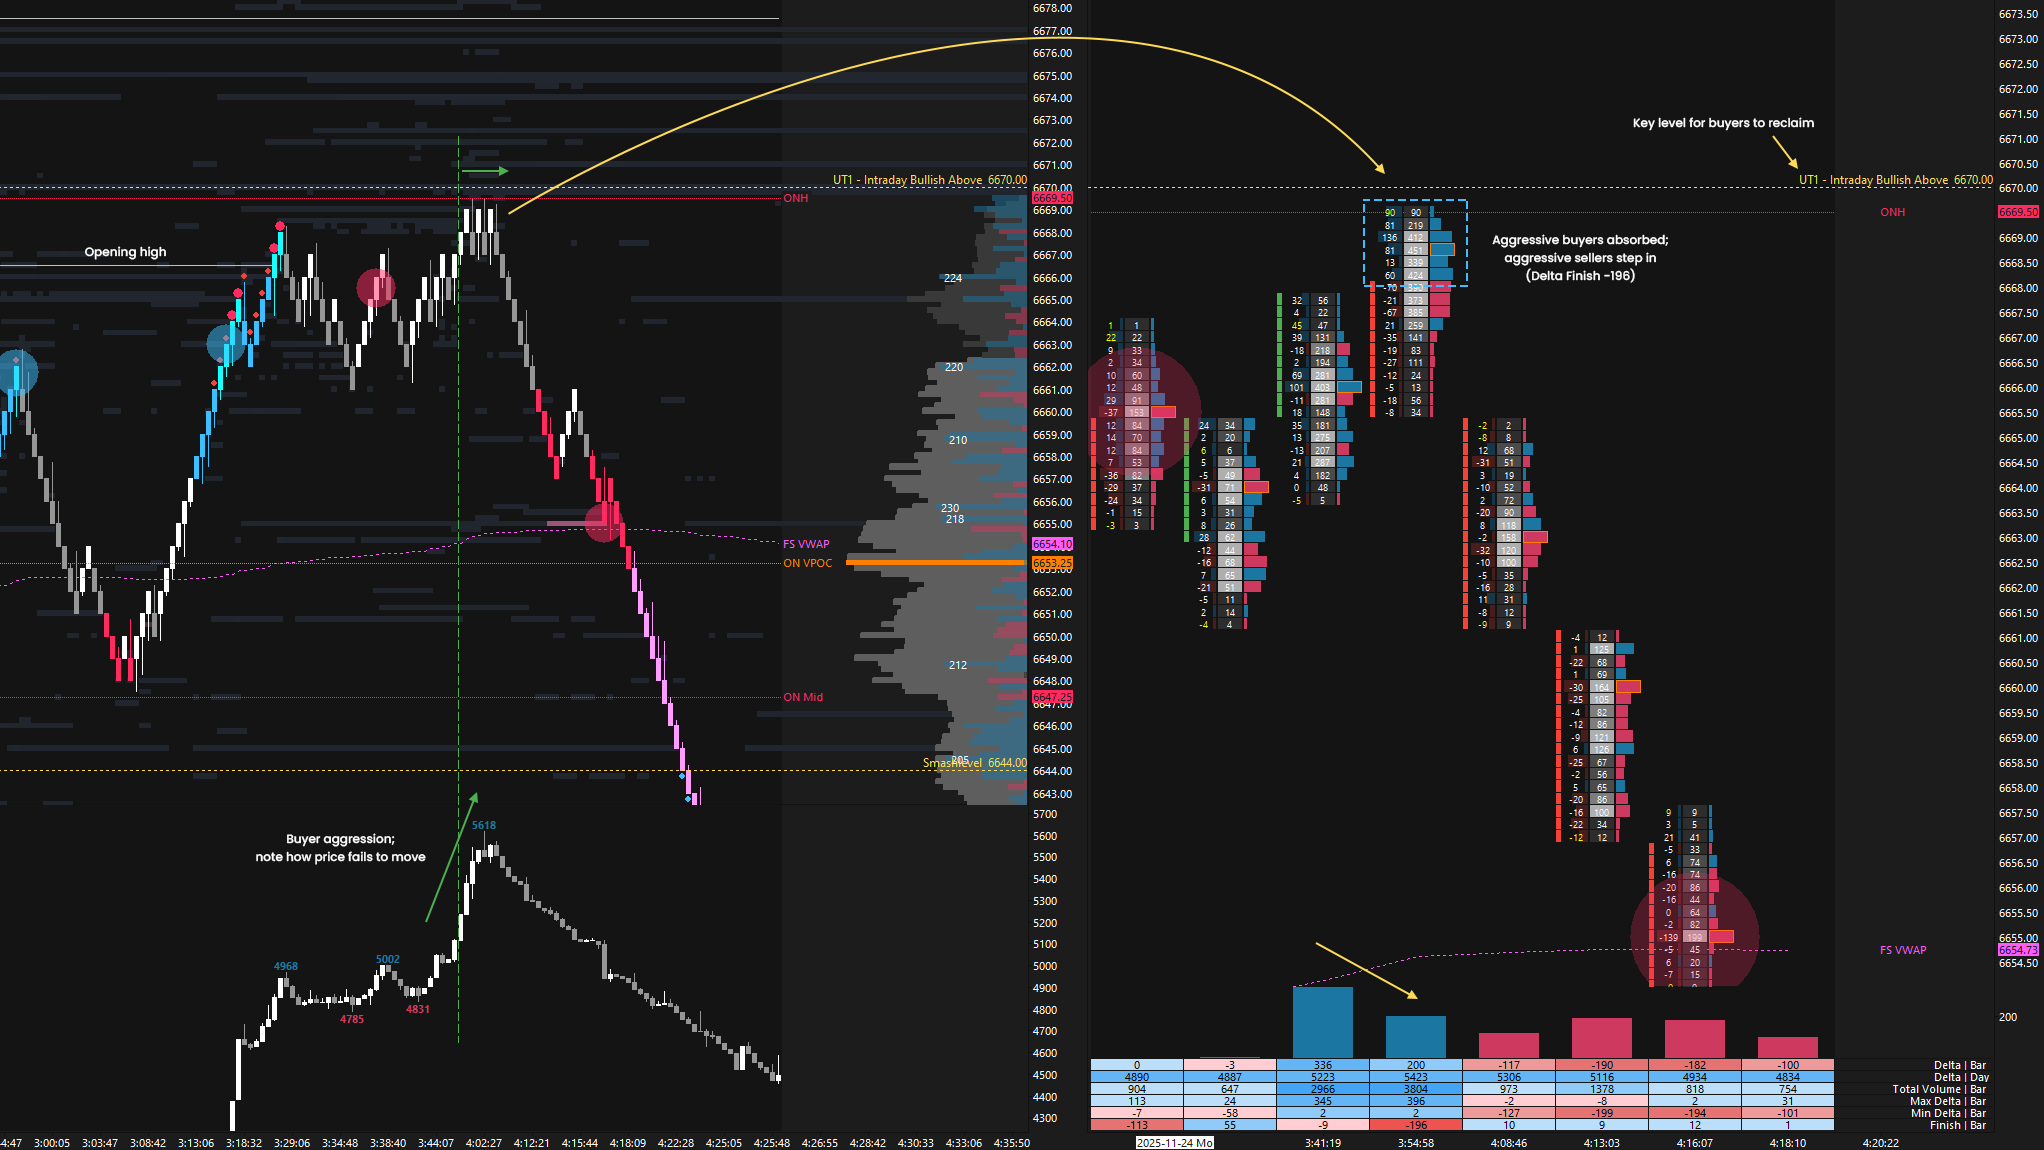
Monday’s Auction

Tuesday’s session saw an early attempt from sellers to negate Monday’s double-distribution trend day—an attempt that ultimately failed, as sellers were unable to gain traction within Monday’s lower distribution, where responsive buyers stepped in. The afternoon session provided an excellent pullback that buyers absorbed, resulting in upside continuation in alignment with the short-term strength (see Figure 2).
Another double distribution formed, fully cleaning up the poor structure from last week and ending the weekly one-time framing down—not a scenario stronger sellers would have allowed after last week’s weakness.
The Weekly Extreme High at 6790, aligning with last week’s high, was the key level heading into Wednesday’s session, as discussed in the daily plan. For the market to remain directional, 6790 was the level buyers needed to reclaim.
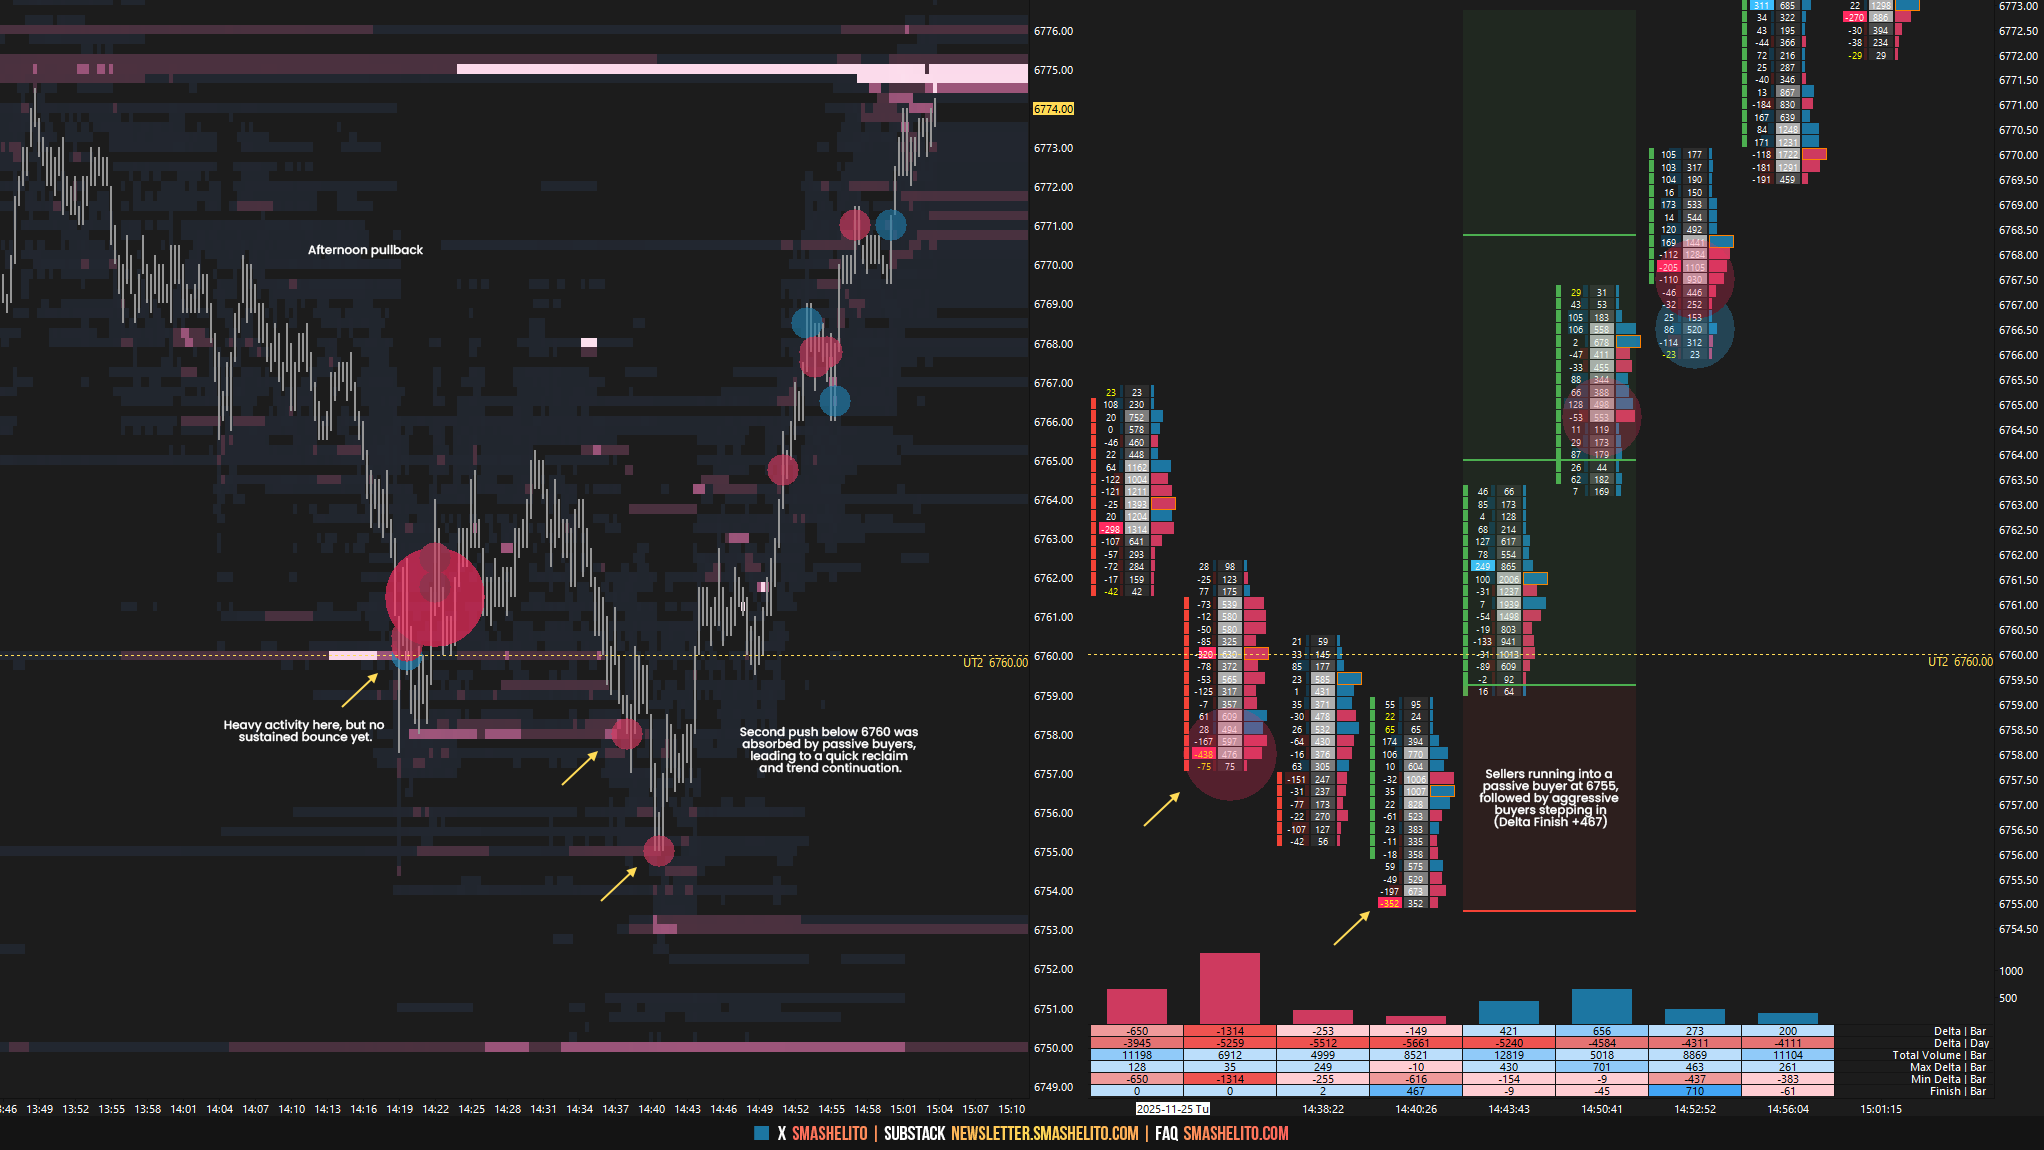
Tuesday’s Auction
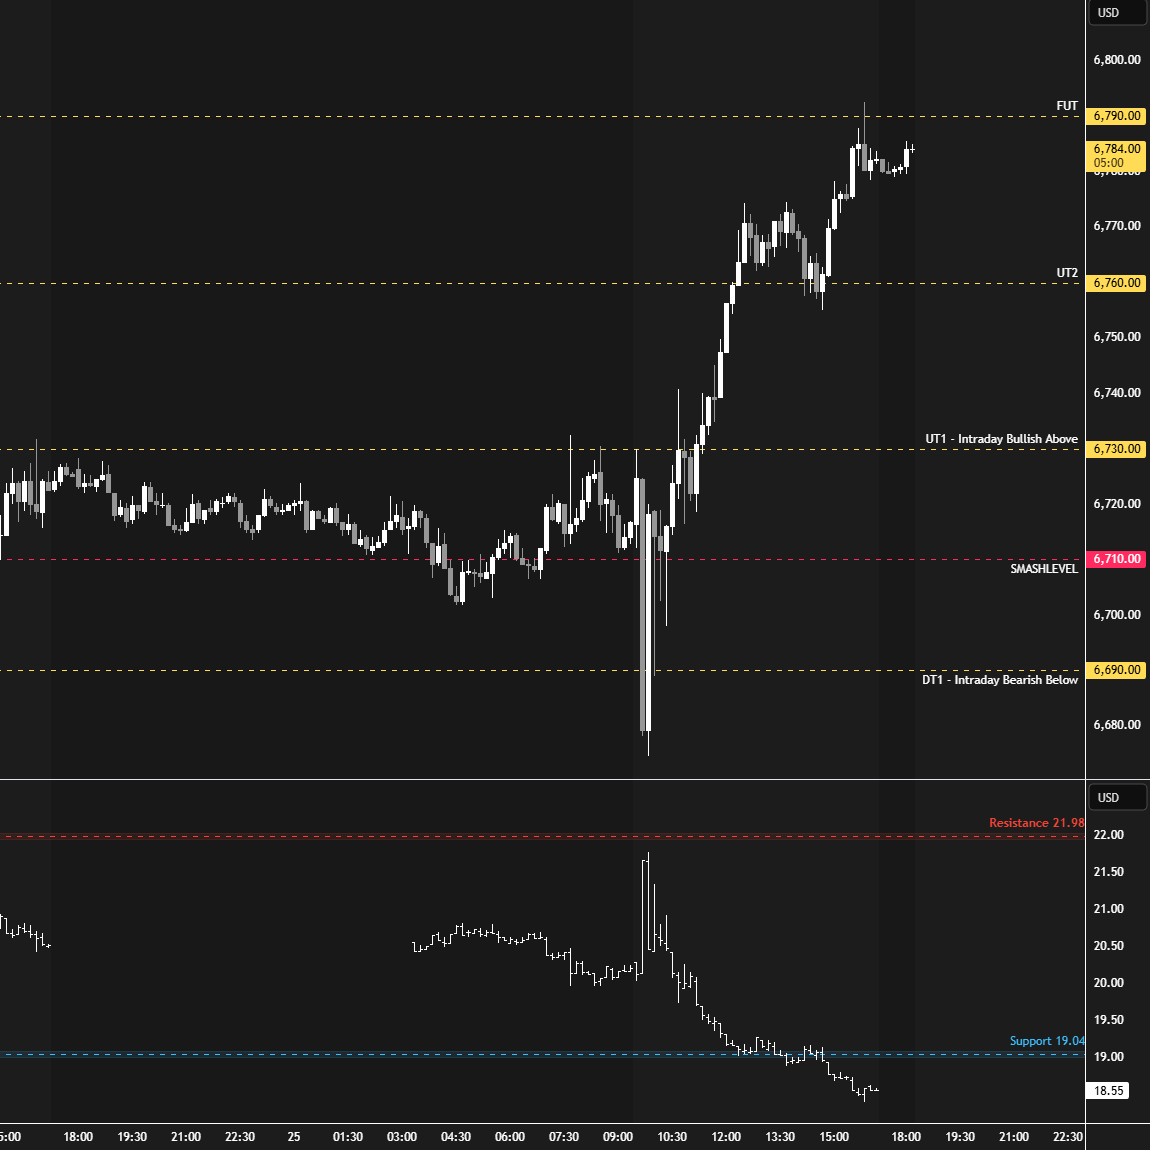
On Wednesday, buyers reclaimed 6790 and held the retest, signaling a continued directional market. The RTH session opened on a true gap up, and sellers failed to fill it, confirming buyers were firmly in control.
Wednesday’s Auction

The Smashlevel, the intraday pivot heading into Thursday’s holiday session and Friday’s shortened session, was 6824. Holding above it opened the door to filling the gap above at 6852, while acceptance below would shift focus to Wednesday’s gap at 6792.50.
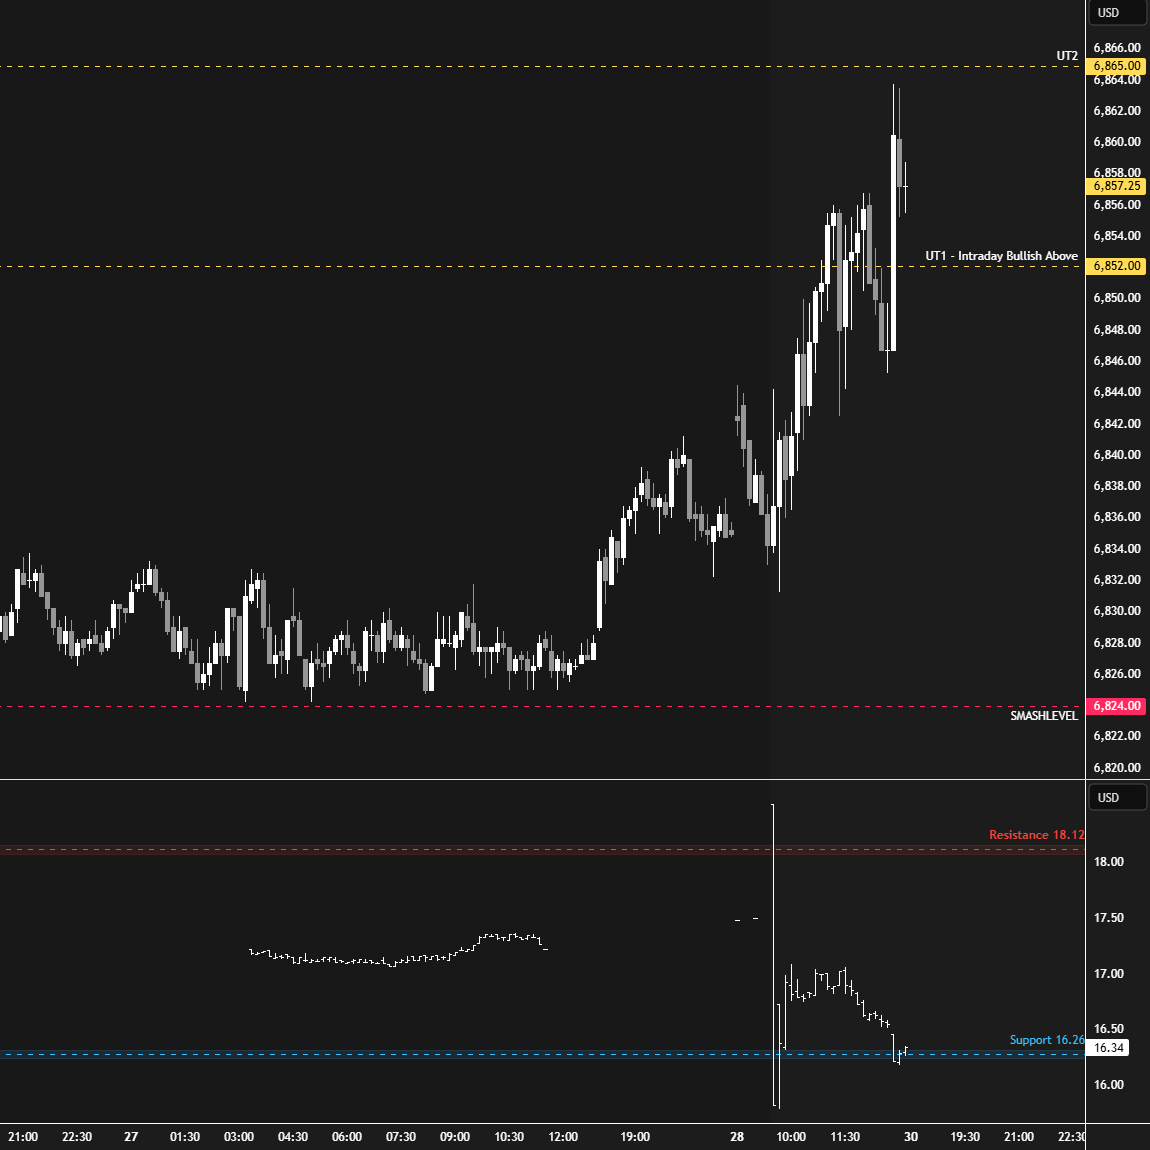
Buyers defended 6824 almost to the tick (6824.25), which ultimately resulted in filling the 6852 gap on Friday.
Friday’s Auction
Price Action vs. Weekly Levels
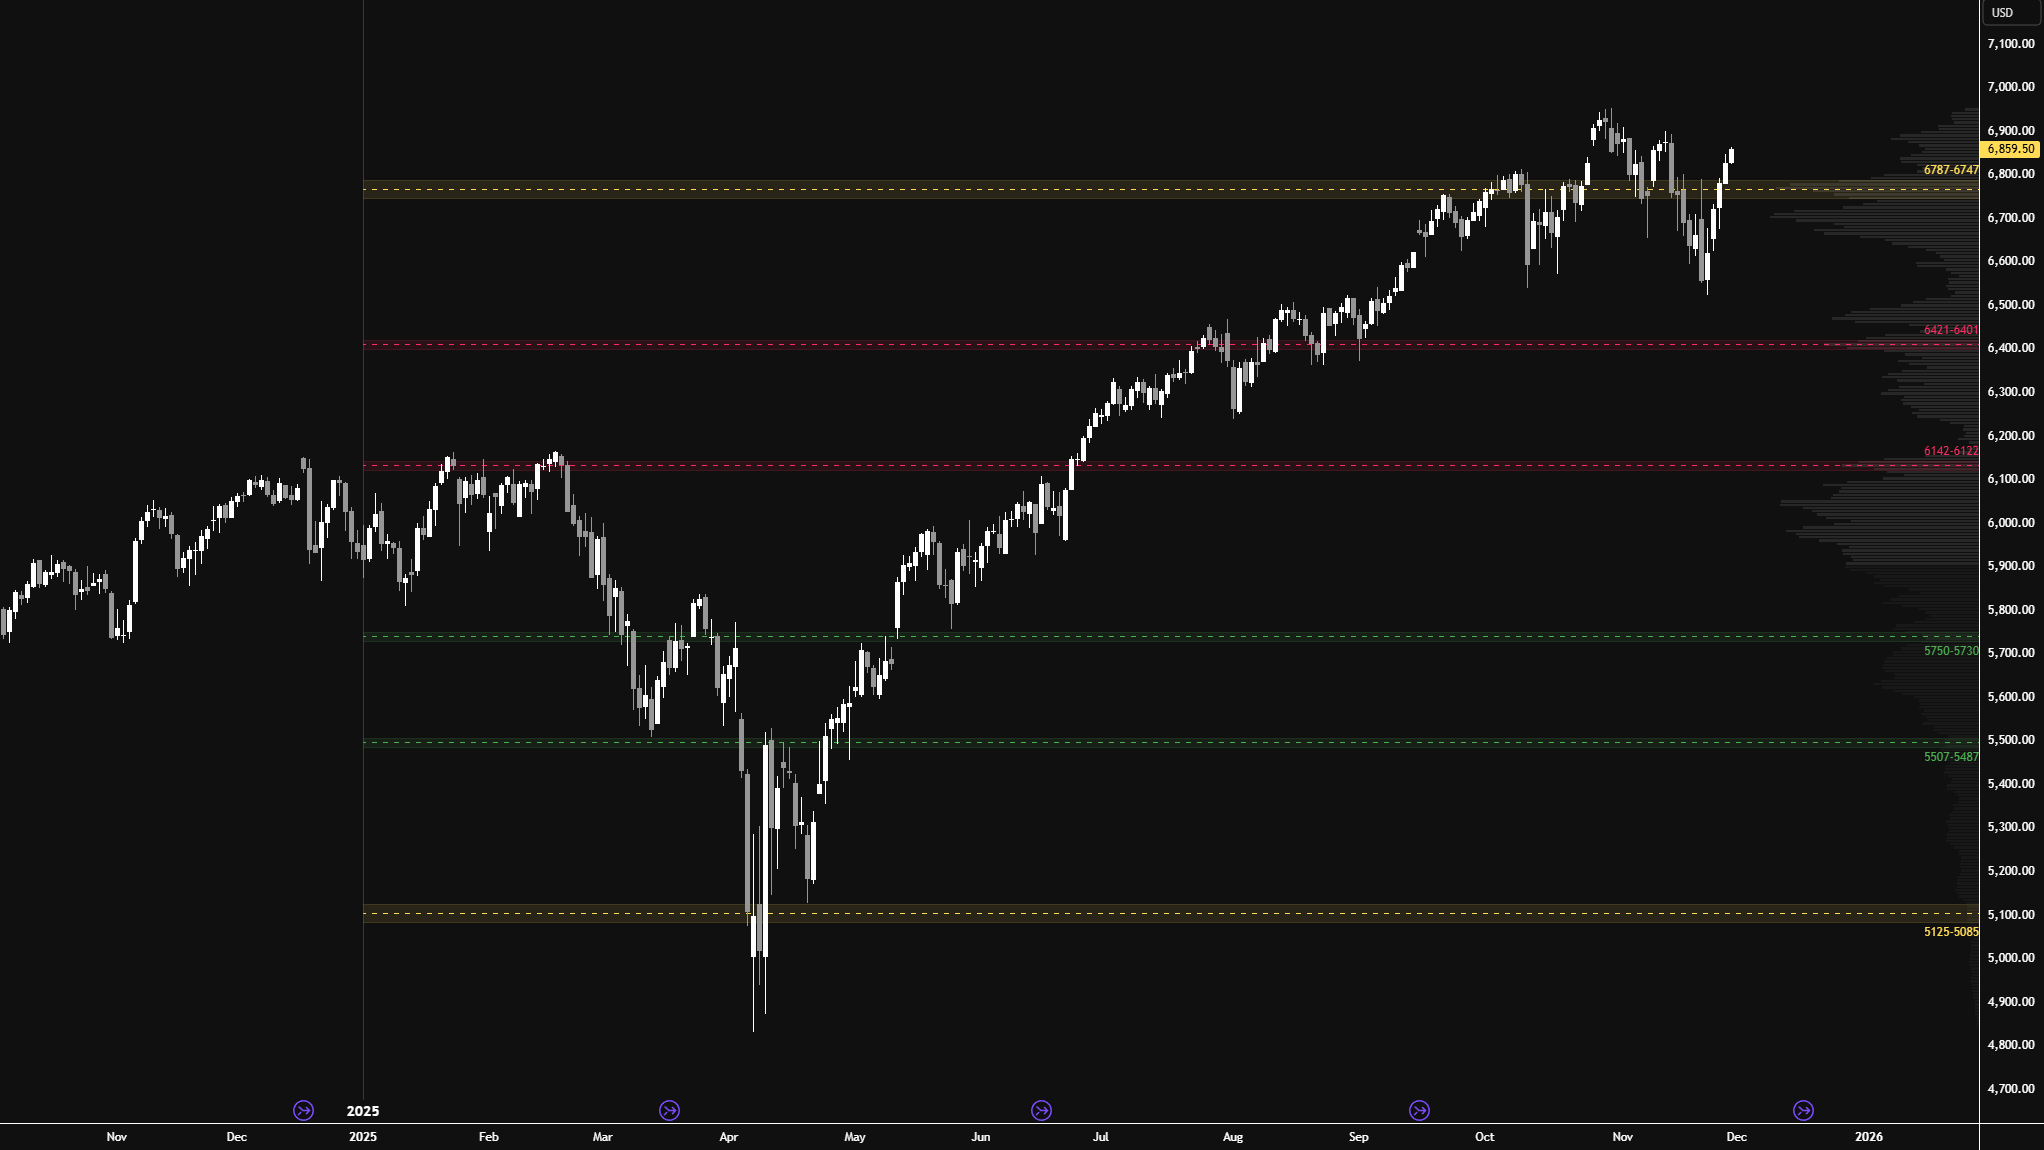
I will continue to include the HTF chart from a good friend of mine, featuring levels generated by one of his models at the start of 2025. As you can see, this year’s price action has respected these levels remarkably well.
The main takeaway from this chart is that sellers, despite holding trapped inventory above the 6747–6787 area of interest, haven’t been able to inflict more than a 5% correction. We are now back above this area, meaning caution fading—at least until this area fails. Don’t forget, unfinished business remains at the all-time highs, with an untested overnight ATH still in play.
Higher Time Frame Levels
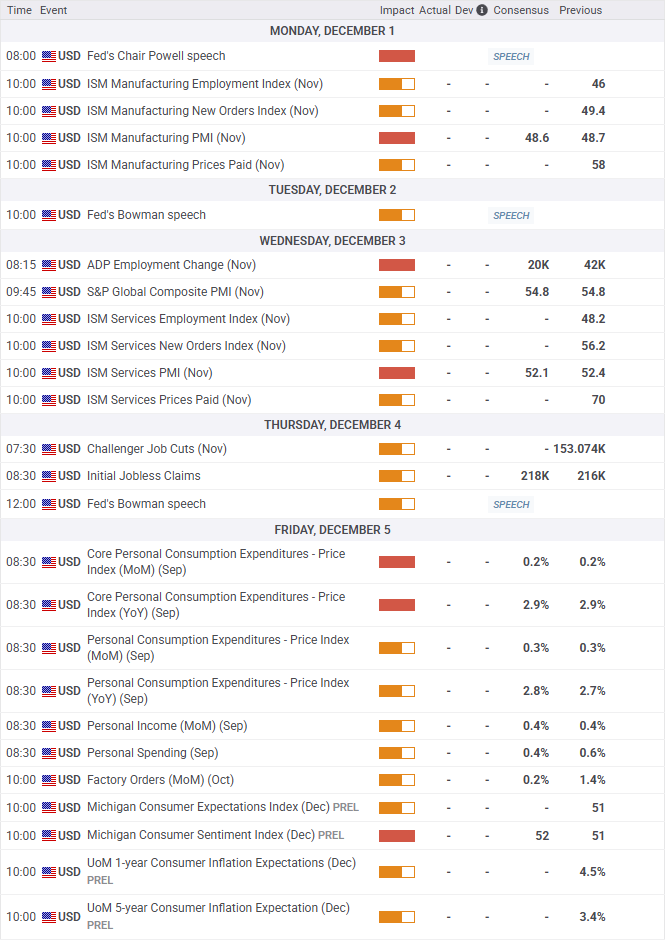
Economic & Earnings Calendar
Central Standard Time
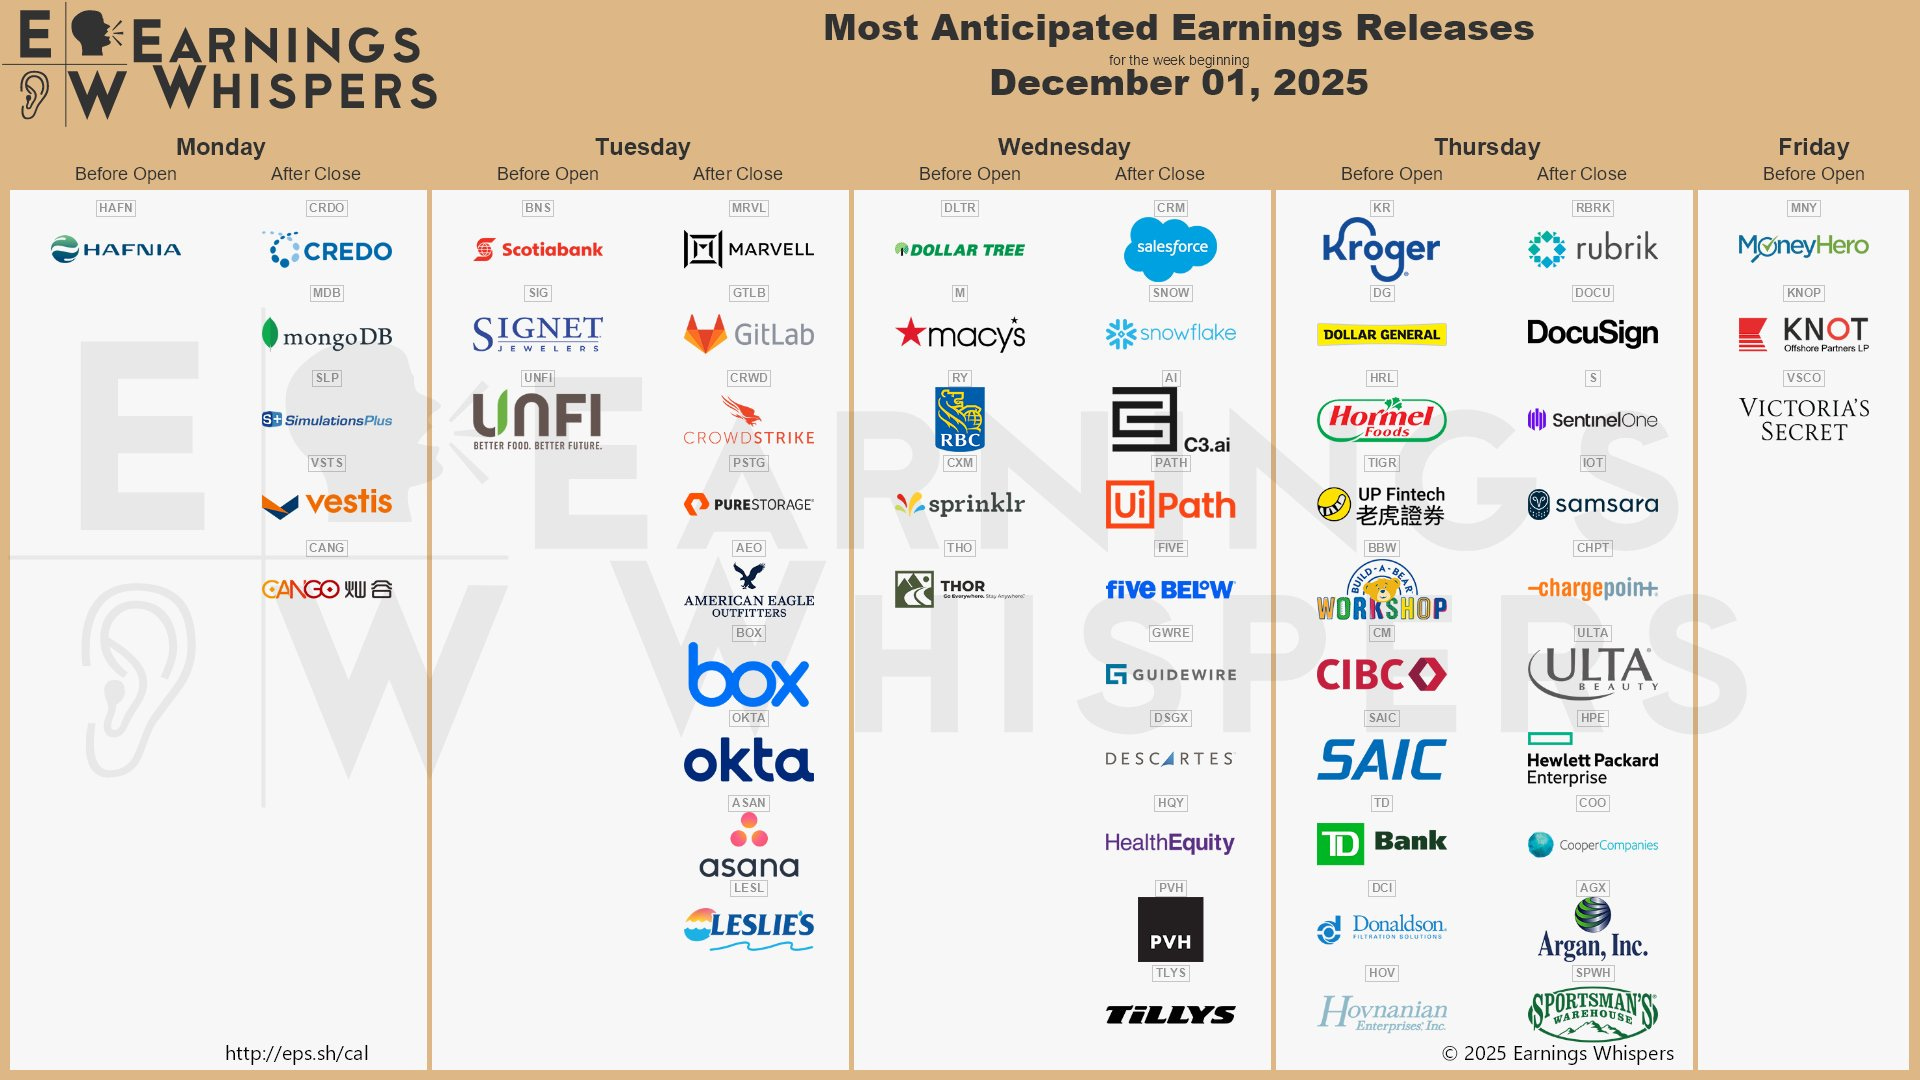
Earnings Whispers
Market Structure
🟩 Daily: OTFU → Ends at: 6831.25
🟨 Weekly: BALANCE → 3-Week → High: 6892.75 / Low: 6539
🟨 Monthly: BALANCE → 2-Month → High: 6952 / Low: 6539
Balance: A market condition where price consolidates within a defined range, reflecting indecision as the market awaits more market-generated information. We apply balance guidelines—favoring fade trades at range extremes (highs/lows) and preparing for breakout setups if balance resolves.
One-Time Framing Up (OTFU): A market condition where each subsequent bar forms a higher low, signaling a strong upward trend.
One-Time Framing Down (OTFD): A market condition where each subsequent bar forms a lower high, signaling a strong downward trend.
Contextual Analysis & Plan
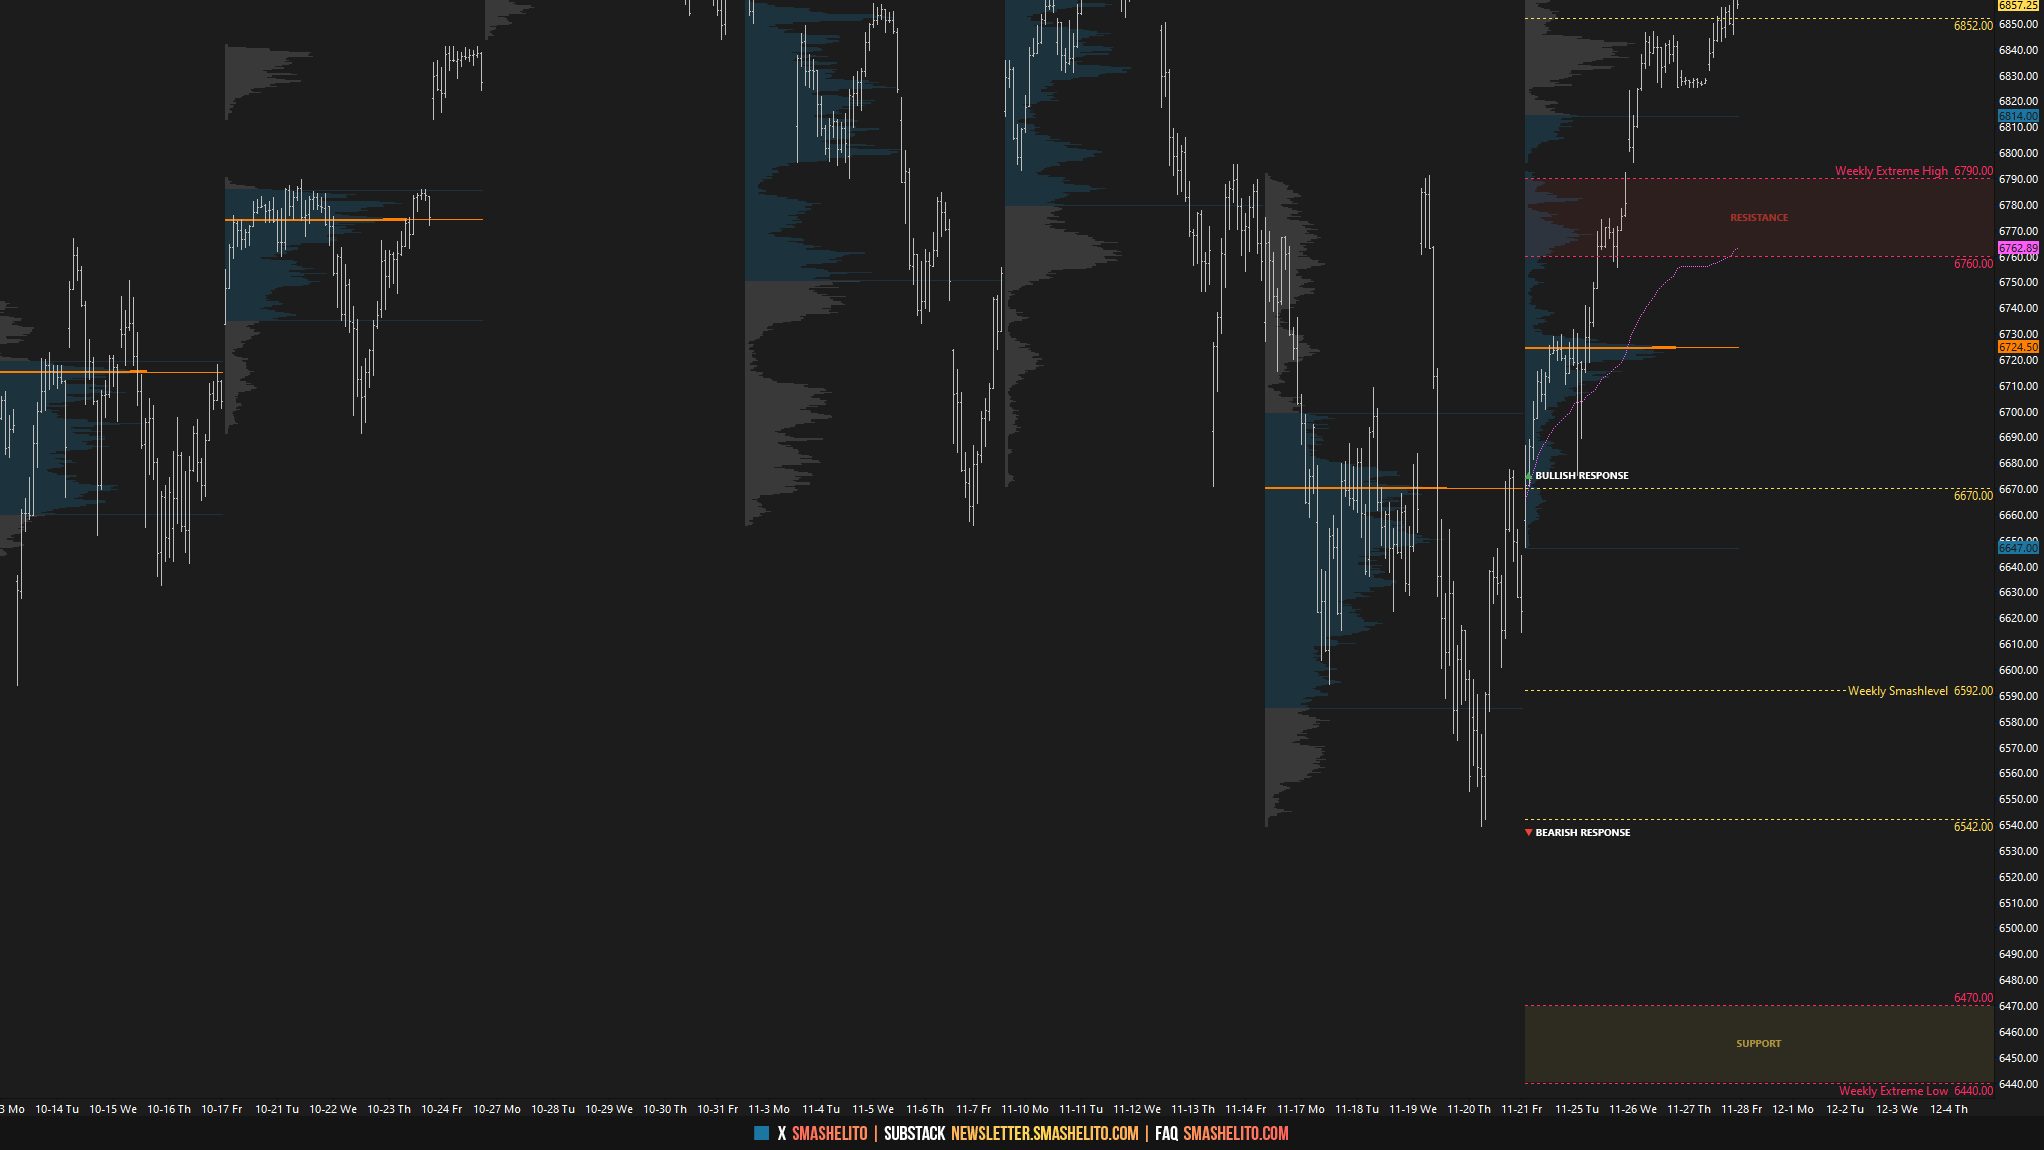
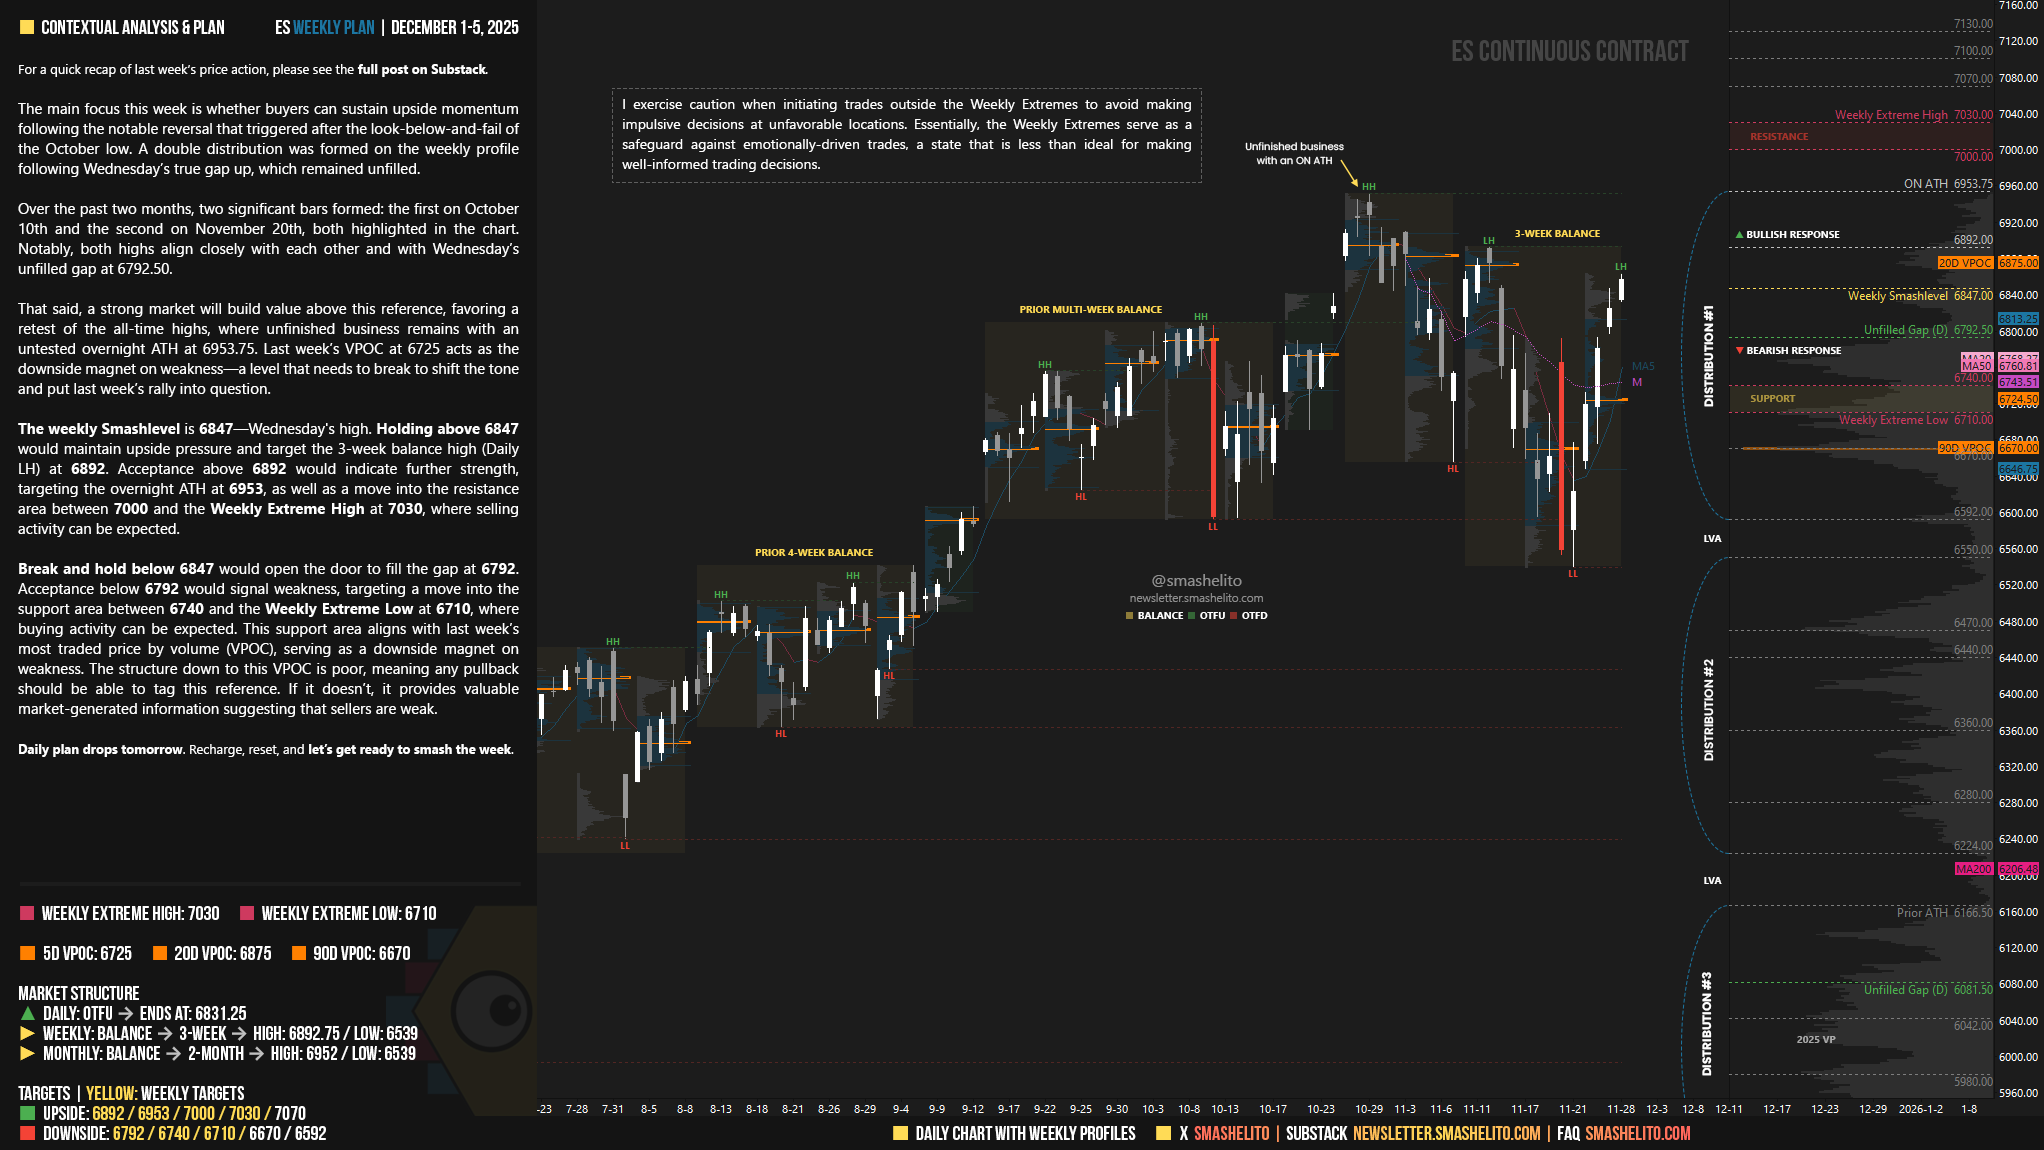
The main focus this week is whether buyers can sustain upside momentum following the notable reversal that triggered after the look-below-and-fail of the October low. A double distribution was formed on the weekly profile following Wednesday’s true gap up, which remained unfilled.
Over the past two months, two significant bars formed: the first on October 10th and the second on November 20th, both highlighted in the chart. Notably, both highs align closely with each other and with Wednesday’s unfilled gap at 6792.50.
That said, a strong market will build value above this reference, favoring a retest of the all-time highs, where unfinished business remains with an untested overnight ATH at 6953.75. Last week’s VPOC at 6725 acts as the downside magnet on weakness—a level that needs to break to shift the tone and put last week’s rally into question.
The weekly Smashlevel is 6847—Wednesday’s high. Holding above 6847 would maintain upside pressure and target the 3-week balance high (Daily LH) at 6892. Acceptance above 6892 would indicate further strength, targeting the overnight ATH at 6953, as well as a move into the resistance area between 7000 and the Weekly Extreme High at 7030, where selling activity can be expected.
Break and hold below 6847 would open the door to fill the gap at 6792. Acceptance below 6792 would signal weakness, targeting a move into the support area between 6740 and the Weekly Extreme Low at 6710, where buying activity can be expected. This support area aligns with last week’s most traded price by volume (VPOC), serving as a downside magnet on weakness. The structure down to this VPOC is poor, meaning any pullback should be able to tag this reference. If it doesn’t, it provides valuable market-generated information suggesting that sellers are weak.
Key Levels of Interest
In the upcoming week, I will closely observe the behavior around 6847.
Holding above 6847 would target 6892 / 6953 / 7000 / 7030* / 7070
Break and hold below 6847 would target 6792 / 6740 / 6710* / 6670 / 6592
*Weekly Extremes. I exercise caution when initiating trades outside the Weekly Extremes to avoid making impulsive decisions at unfavorable locations. Essentially, the Weekly Extremes serve as a safeguard against emotionally-driven trades, a state that is less than ideal for making well-informed trading decisions.
Daily plan drops tomorrow. Recharge, reset, and let’s get ready to smash the week.
Thank you as always!
Thanks Smash!