
ES Weekly Plan | August 4-8, 2025
Recap, Market Context & Key Levels for the Week Ahead

Welcome to this week’s plan. Inside, you’ll find a quick review of last week’s price action, key economic events, market structure, context for the week ahead, and the levels I’ll be focusing on. Let’s get prepared.
Contents
Last Week in Review & Bonus Chart
Economic & Earnings Calendar
Market Structure
Contextual Analysis & Plan
Key Levels of Interest
Last Week in Review & Bonus Chart
Last week’s plan: ES Weekly Plan | July 28 - August 1, 2025
Heading into last week, the main focus was whether buyers could sustain the directional move away from the prior 3-week balance area following the previous week’s breakout. Immediate attention was on Friday’s double distribution trend day—specifically, the single prints separating the two distributions, which would provide clues of strength or lack thereof.
As discussed, a strong market would remain within Friday’s upper distribution, supporting continued upside pressure. Acceptance into Friday’s lower distribution, however, would open the door for technical fills of the breakout structure. Only acceptance back into the prior 3-week balance area would meaningfully shift the tone—so a pullback alone wasn’t necessarily bearish.
The market kicked off the week with an overnight gap on Sunday, printing a new all-time high. That initiating overnight activity was retraced ahead of Monday’s RTH session, during which the market tested Friday’s lower distribution—where responsive buyers stepped in.
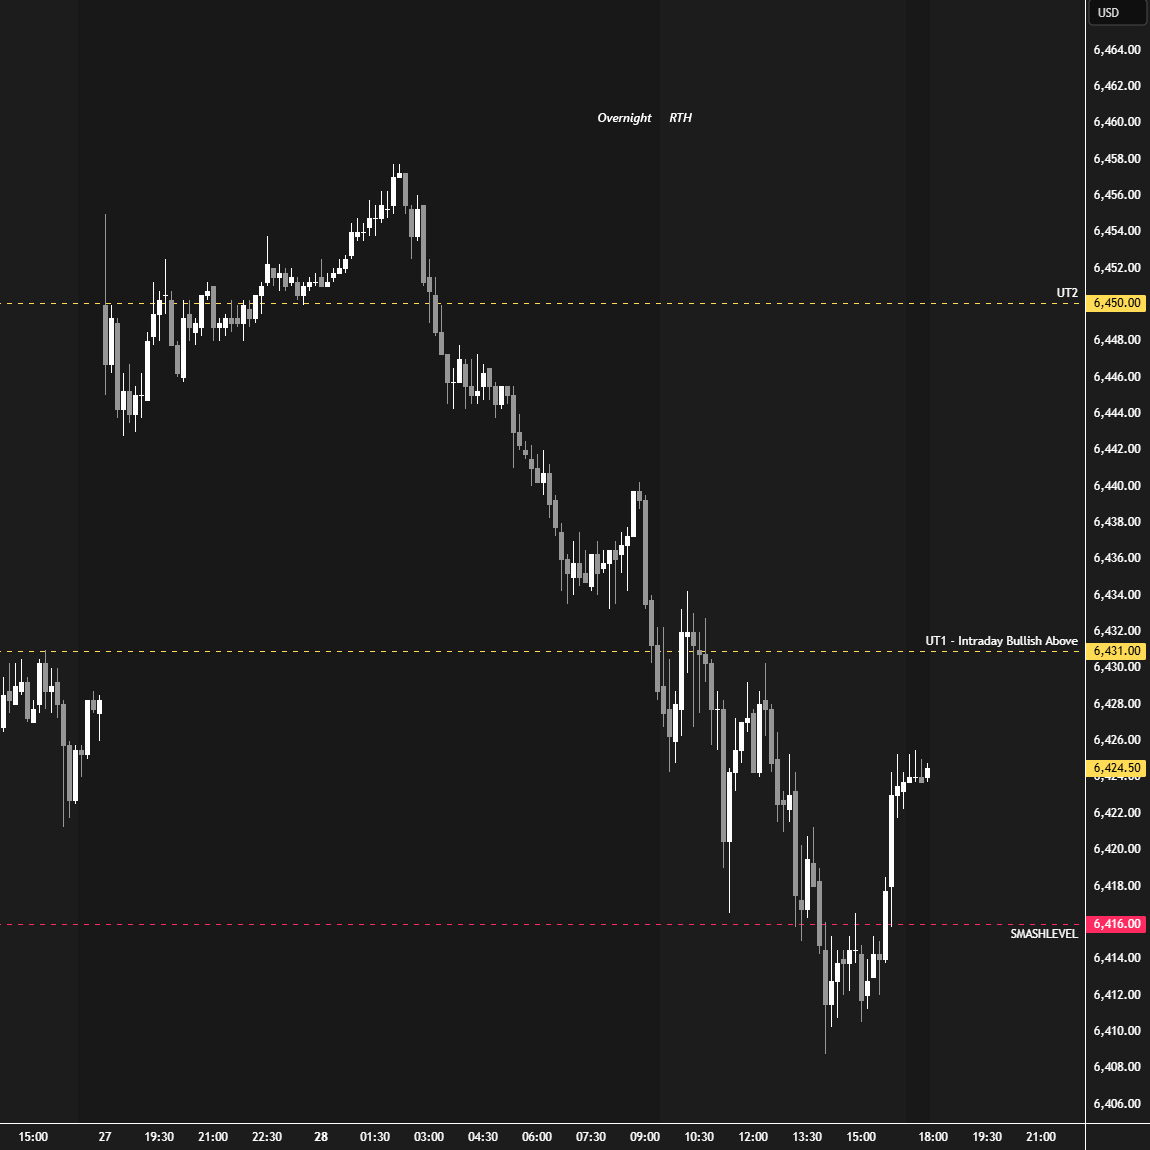
Tuesday’s session opened on a true gap higher, which buyers failed to sustain—unable to hold above last week’s high at 6431. This ultimately resulted in an outside day down, closing back within Friday’s lower distribution, below the important 6416 level.
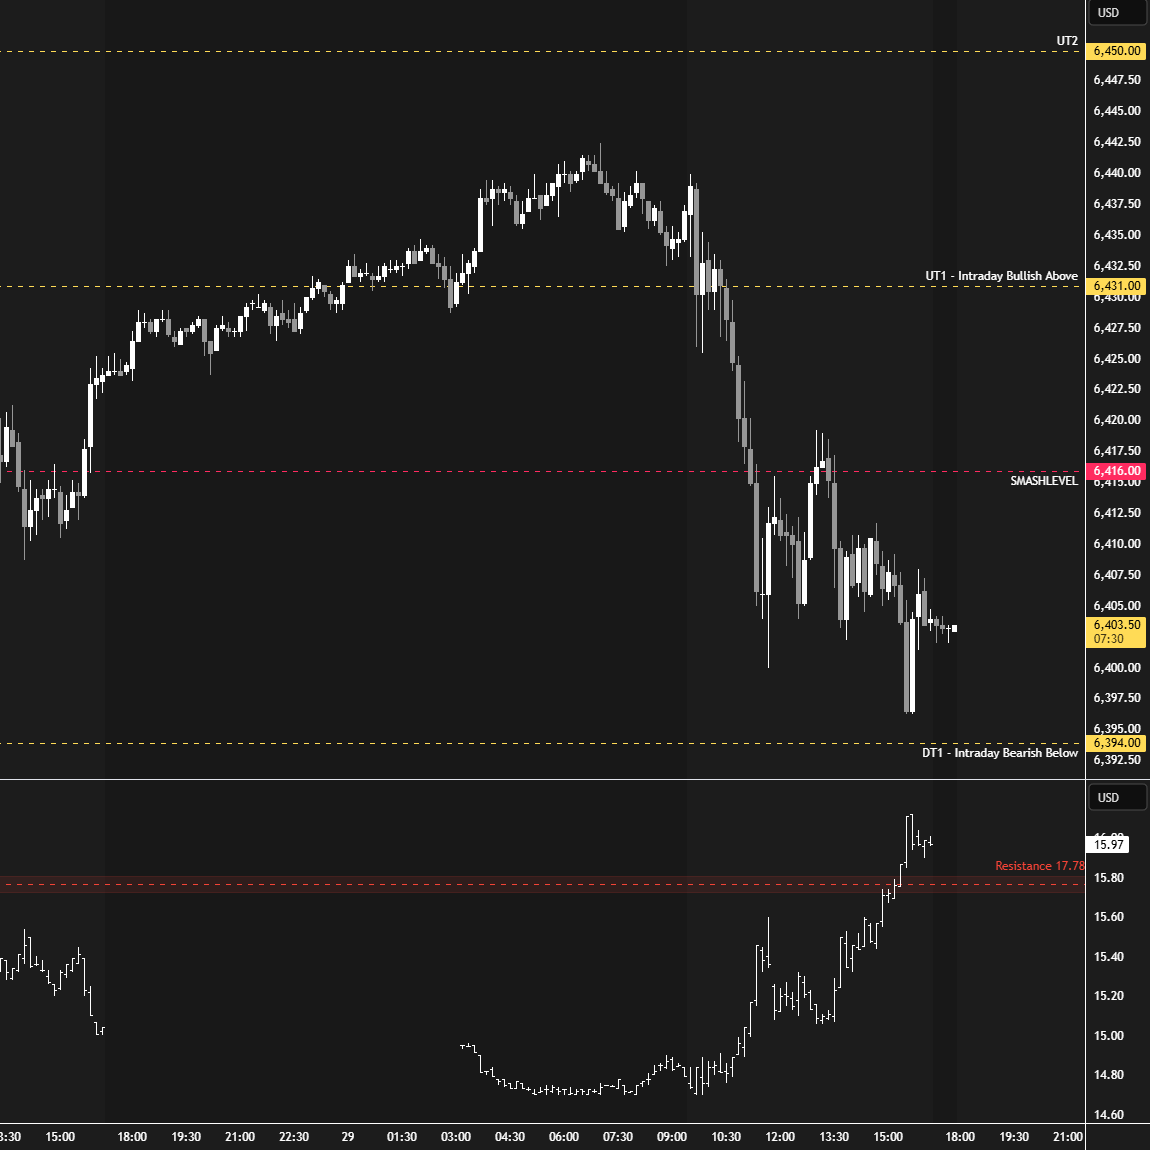
On Wednesday, trading remained uneventful until the FOMC meeting, during which a nasty liquidation break unfolded, pushing the market out of balance. In the process, the key level at 6374—where change took place the prior week—was tagged, offering a great reversal opportunity in confluence with the intraday VIX levels outlined in each daily plan.
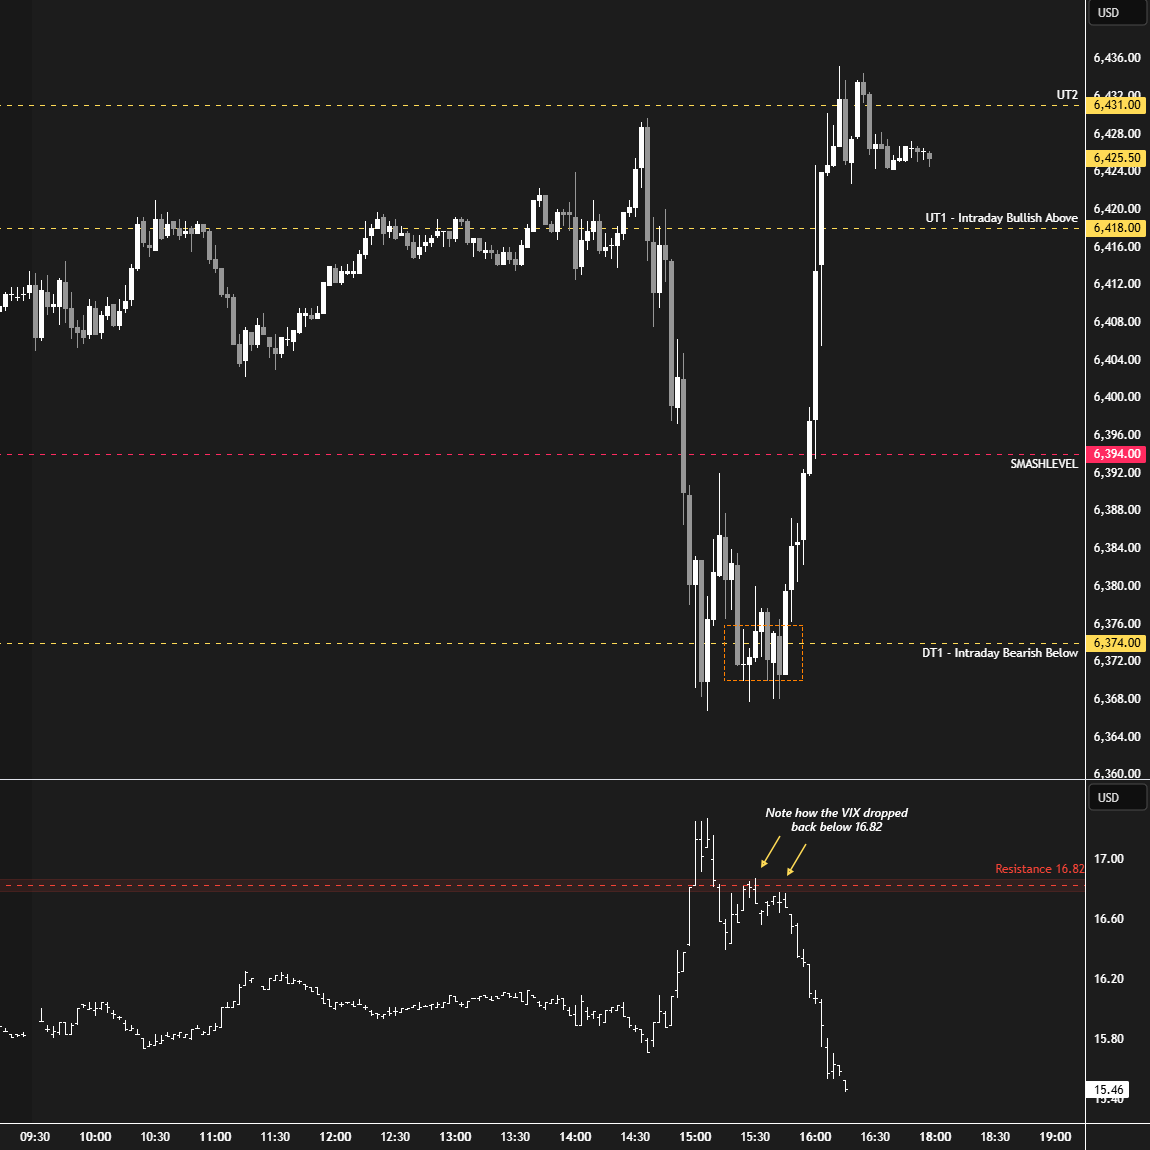
Heading into Thursday’s session, the key question was whether Wednesday’s liquidation break had attracted stronger buyers for an attempt to clean up the unfinished business above—namely, the overnight all-time high. Strong earnings from META and MSFT led to a second true gap higher for the week in the RTH session—one that ultimately failed to hold as well. Note the accuracy of the intraday levels for Thursday’s session.
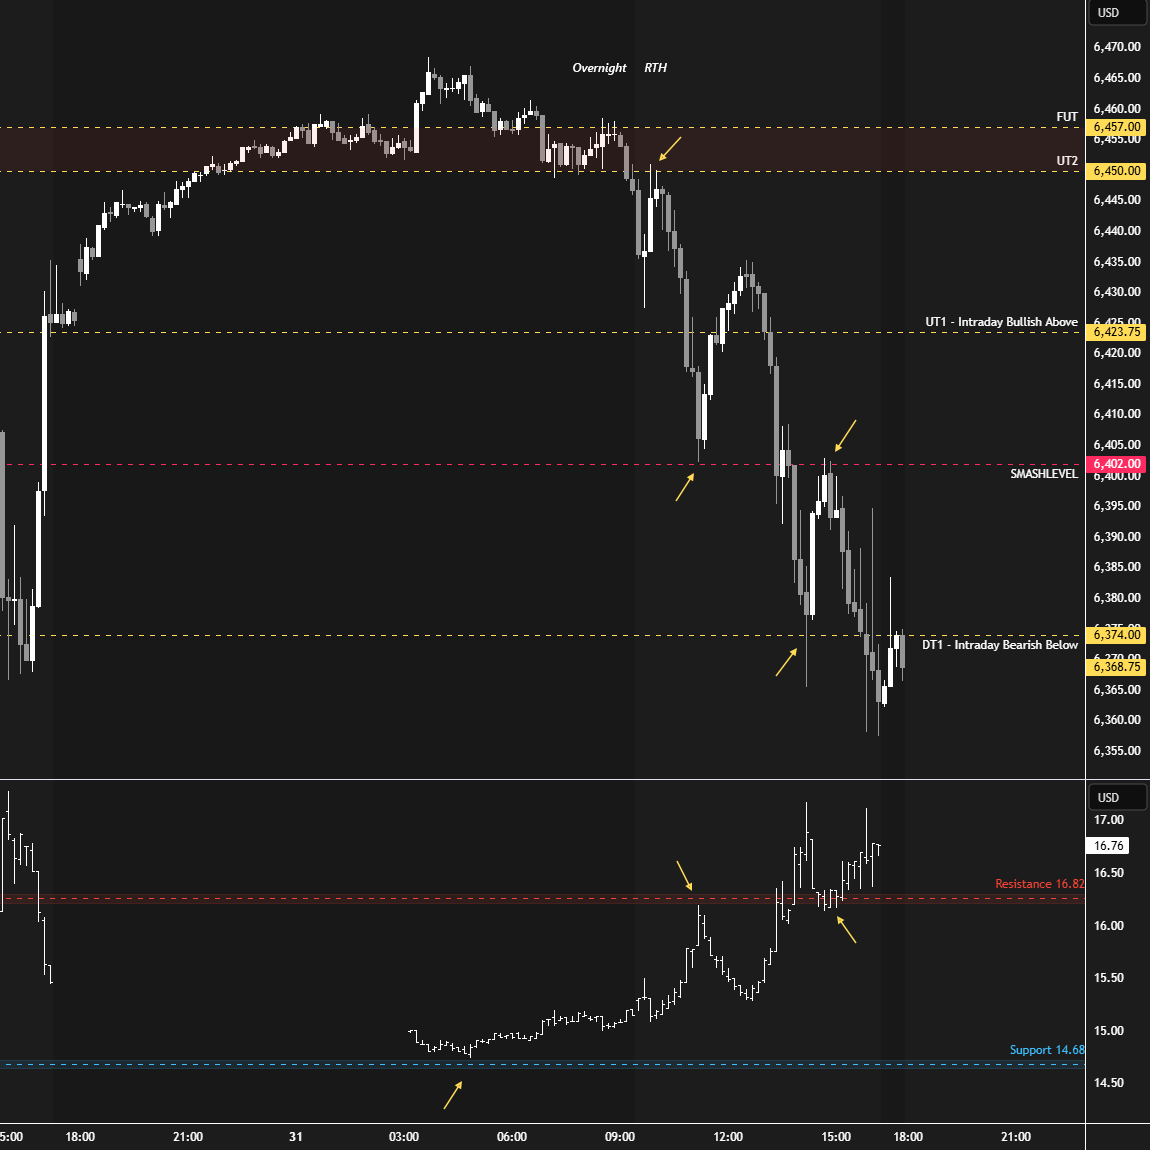
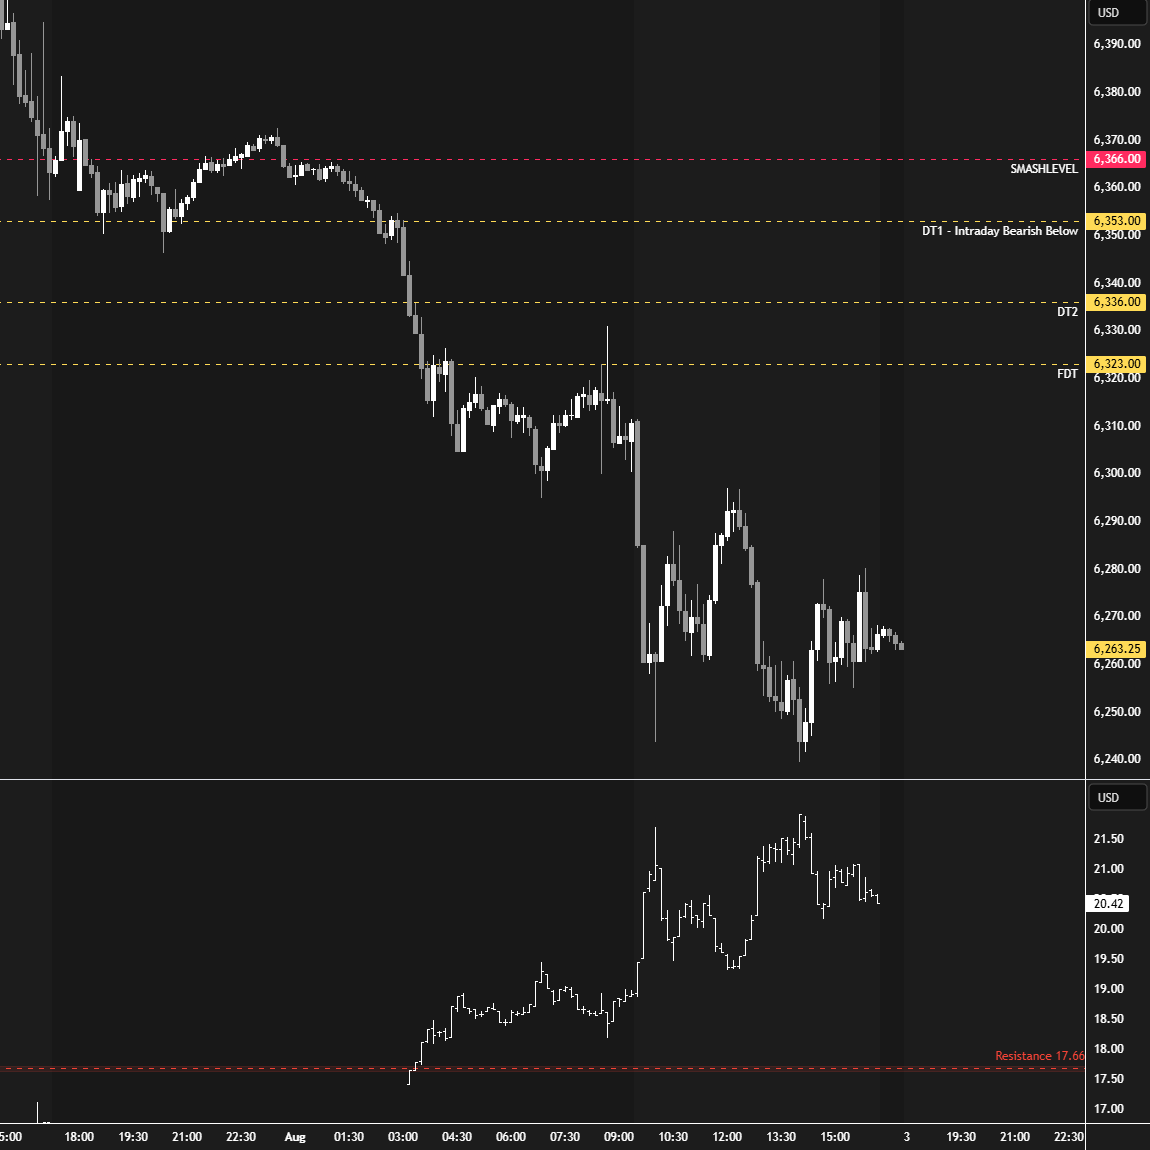
Two true gaps higher that failed to see continuation ultimately resulted in a notable sell-off on Friday, which, in turn, opened with a true gap down and go. It’s worth noting that Friday’s RTH session opened below its final intraday downside target at 6323, while the VIX held above its resistance level at 17.66—confirming weakness. Regular readers of this newsletter know I generally avoid fading in such scenarios, as they often signal potential for further downside—a simple yet powerful concept that helps avoid fighting the trend. In the process, the Weekly Extreme Low at 6305 was breached and failed to be reclaimed—a notable achievement from sellers.
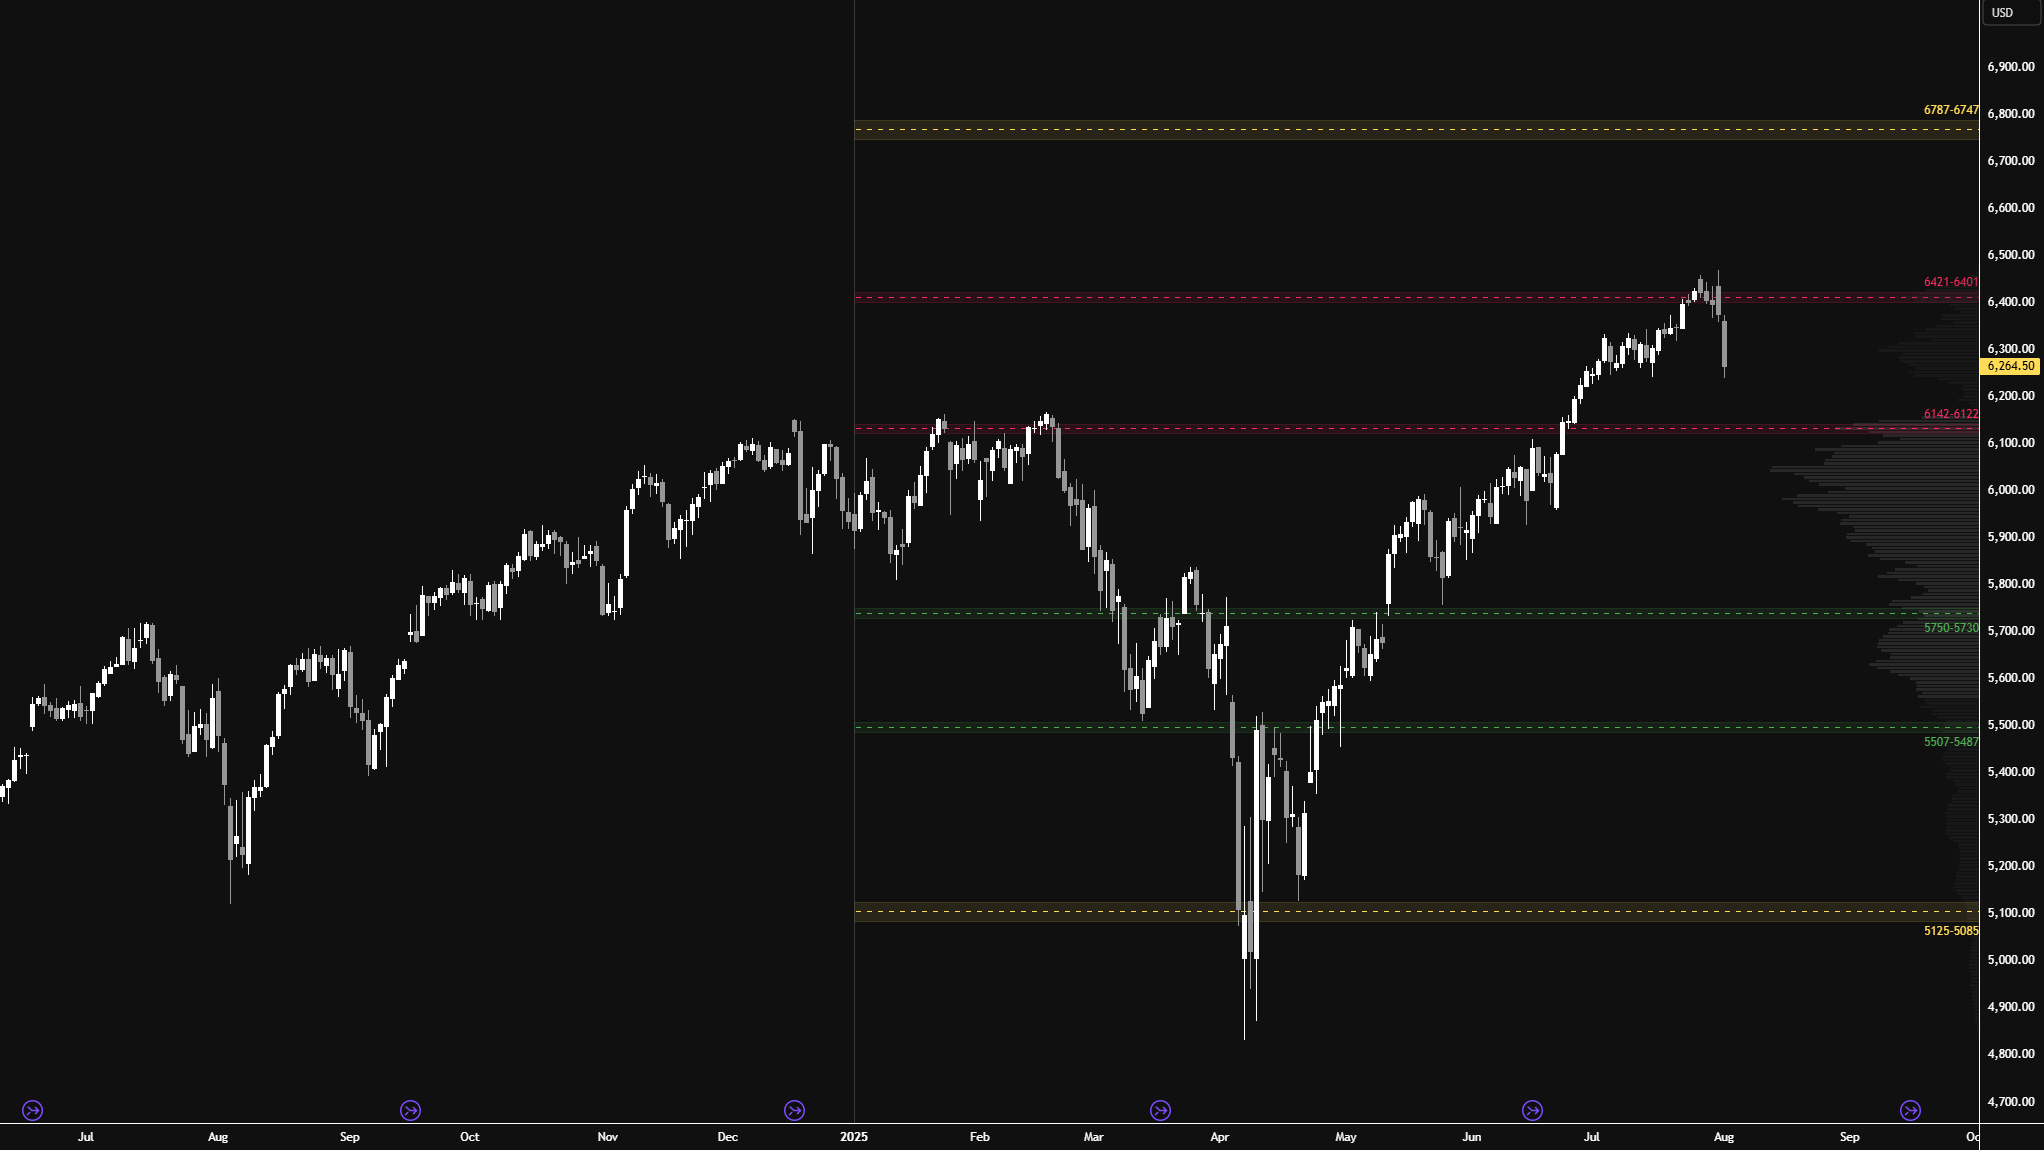
Last week, I shared a chart from a good friend of mine (see Figure 1), featuring levels generated by one of his models at the start of 2025. As you can see, price action this year has respected these levels remarkably well. The key takeaway was that we had reached the 6421–6401 area of interest—an area we intended to keep a close eye on moving forward.
The market did, in fact, react from this area, as a pullback is now underway. As mentioned last week, in the event of a deeper pullback, the obvious area that needs to hold is the prior all-time high from earlier this year, which roughly aligns with the 6142–6122 area—also the location of the year’s value area high. This area also roughly corresponds to a 5% correction from the all-time highs. Acceptance below 6142–6122 would mark the beginning of potential real trouble for buyers. Why? Because acceptance within this year’s value area could trigger a value traverse—a 15% correction.
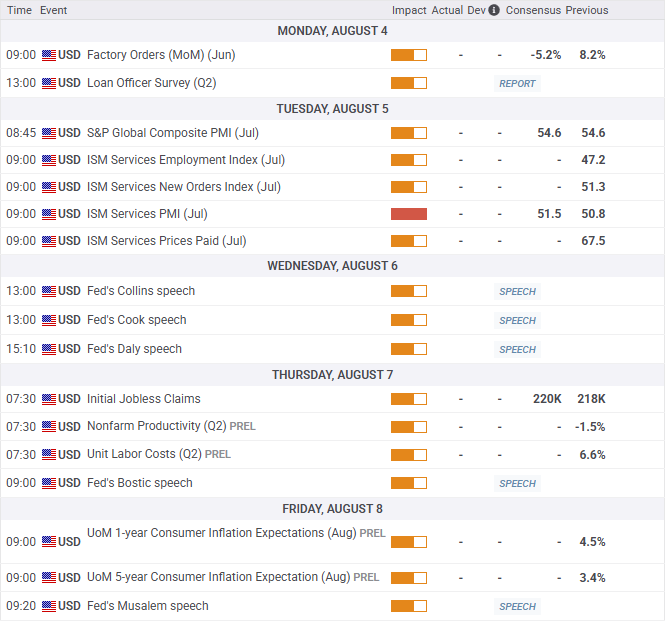
Economic & Earnings Calendar

Market Structure
🟥 Daily: OTFD → Ends at: 6311.50
🟨 Weekly: BALANCE → 5-Week → High: 6451 / Low: 6224.25
🟩 Monthly: OTFU → Ends at: 6227.50
Balance: A market condition where price consolidates within a defined range, reflecting indecision as the market awaits more market-generated information. We apply balance guidelines—favoring fade trades at range extremes (highs/lows) and preparing for breakout setups if balance resolves.
One-Time Framing Up (OTFU): A market condition where each subsequent bar forms a higher low, signaling a strong upward trend.
One-Time Framing Down (OTFD): A market condition where each subsequent bar forms a lower high, signaling a strong downward trend.
Contextual Analysis & Plan
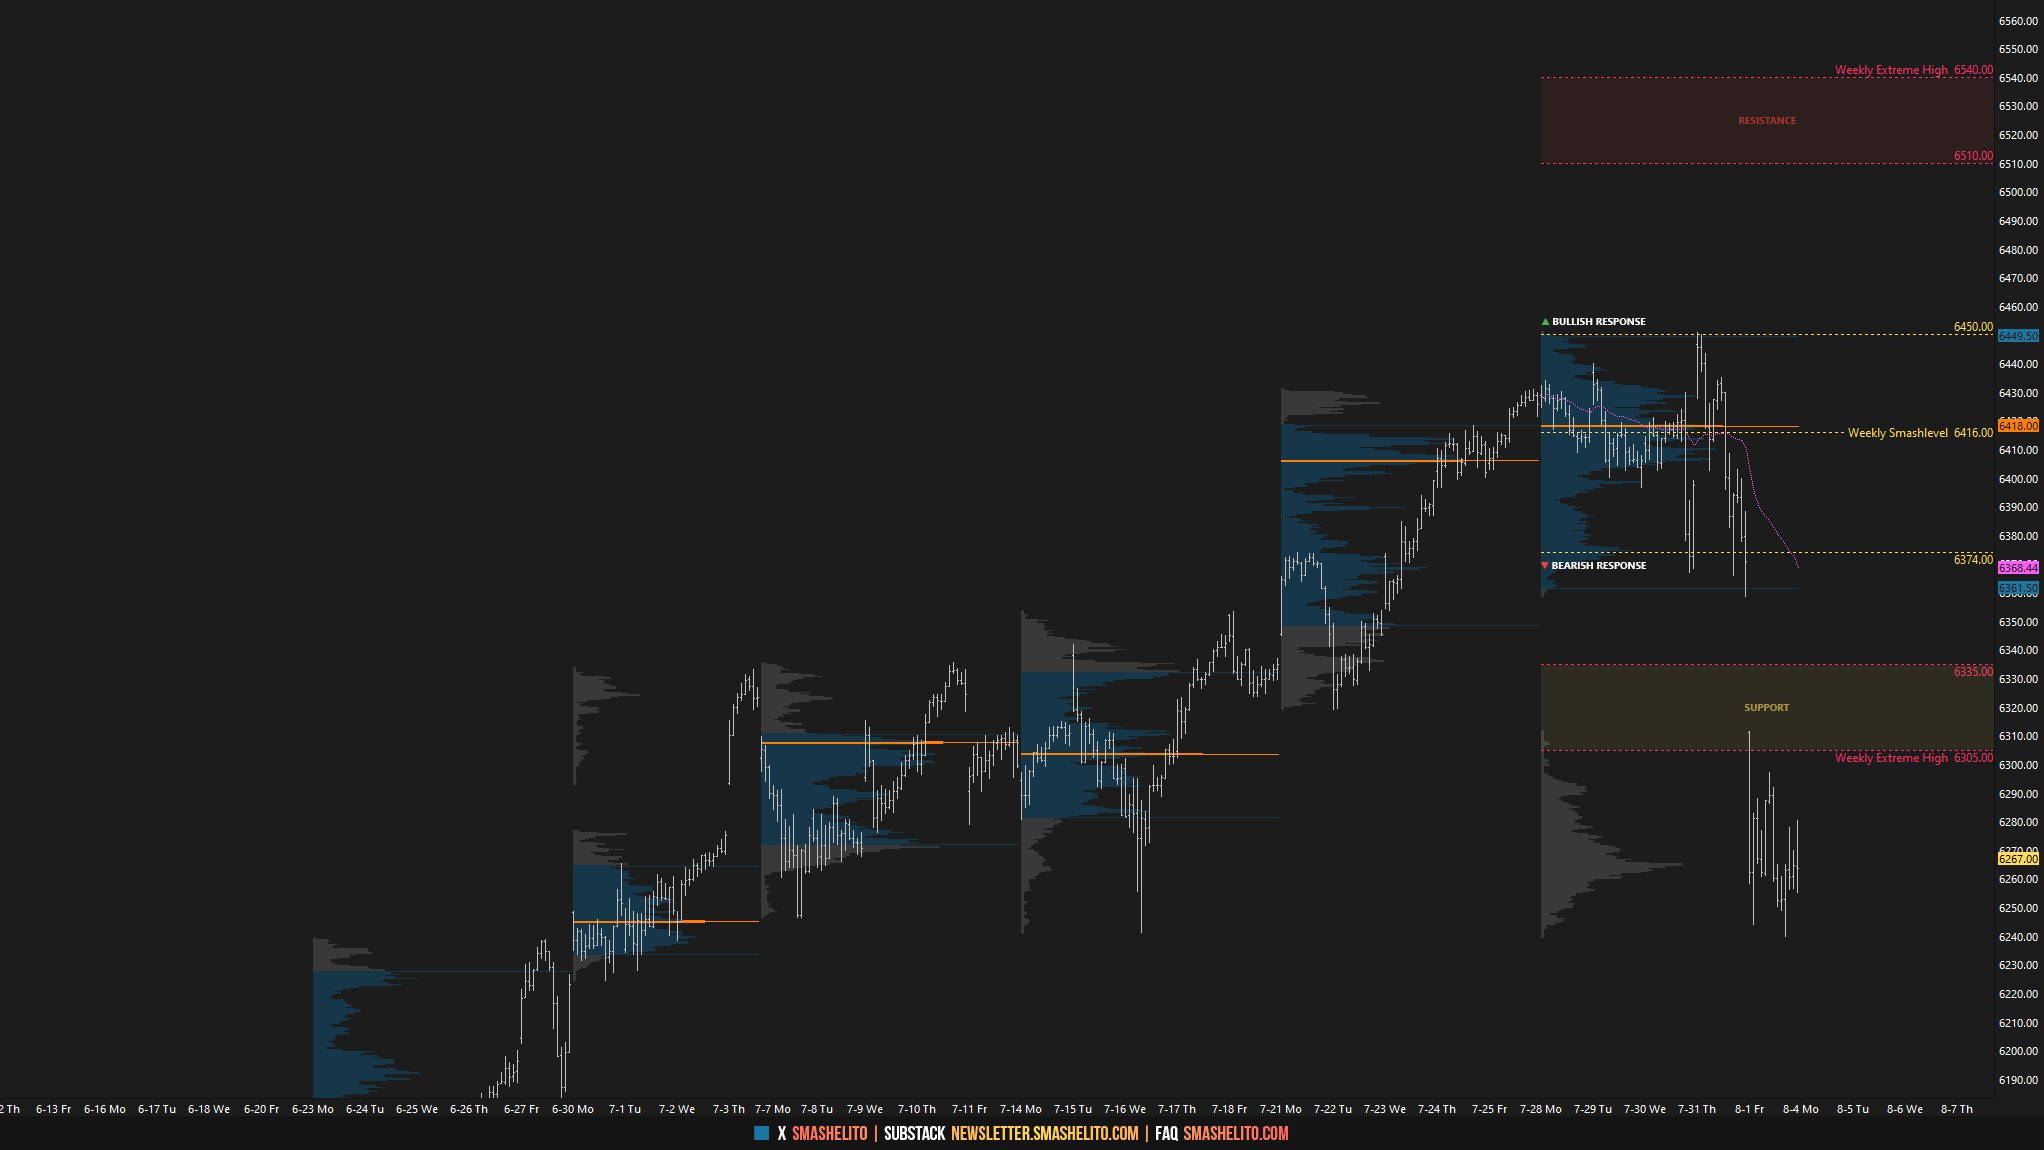
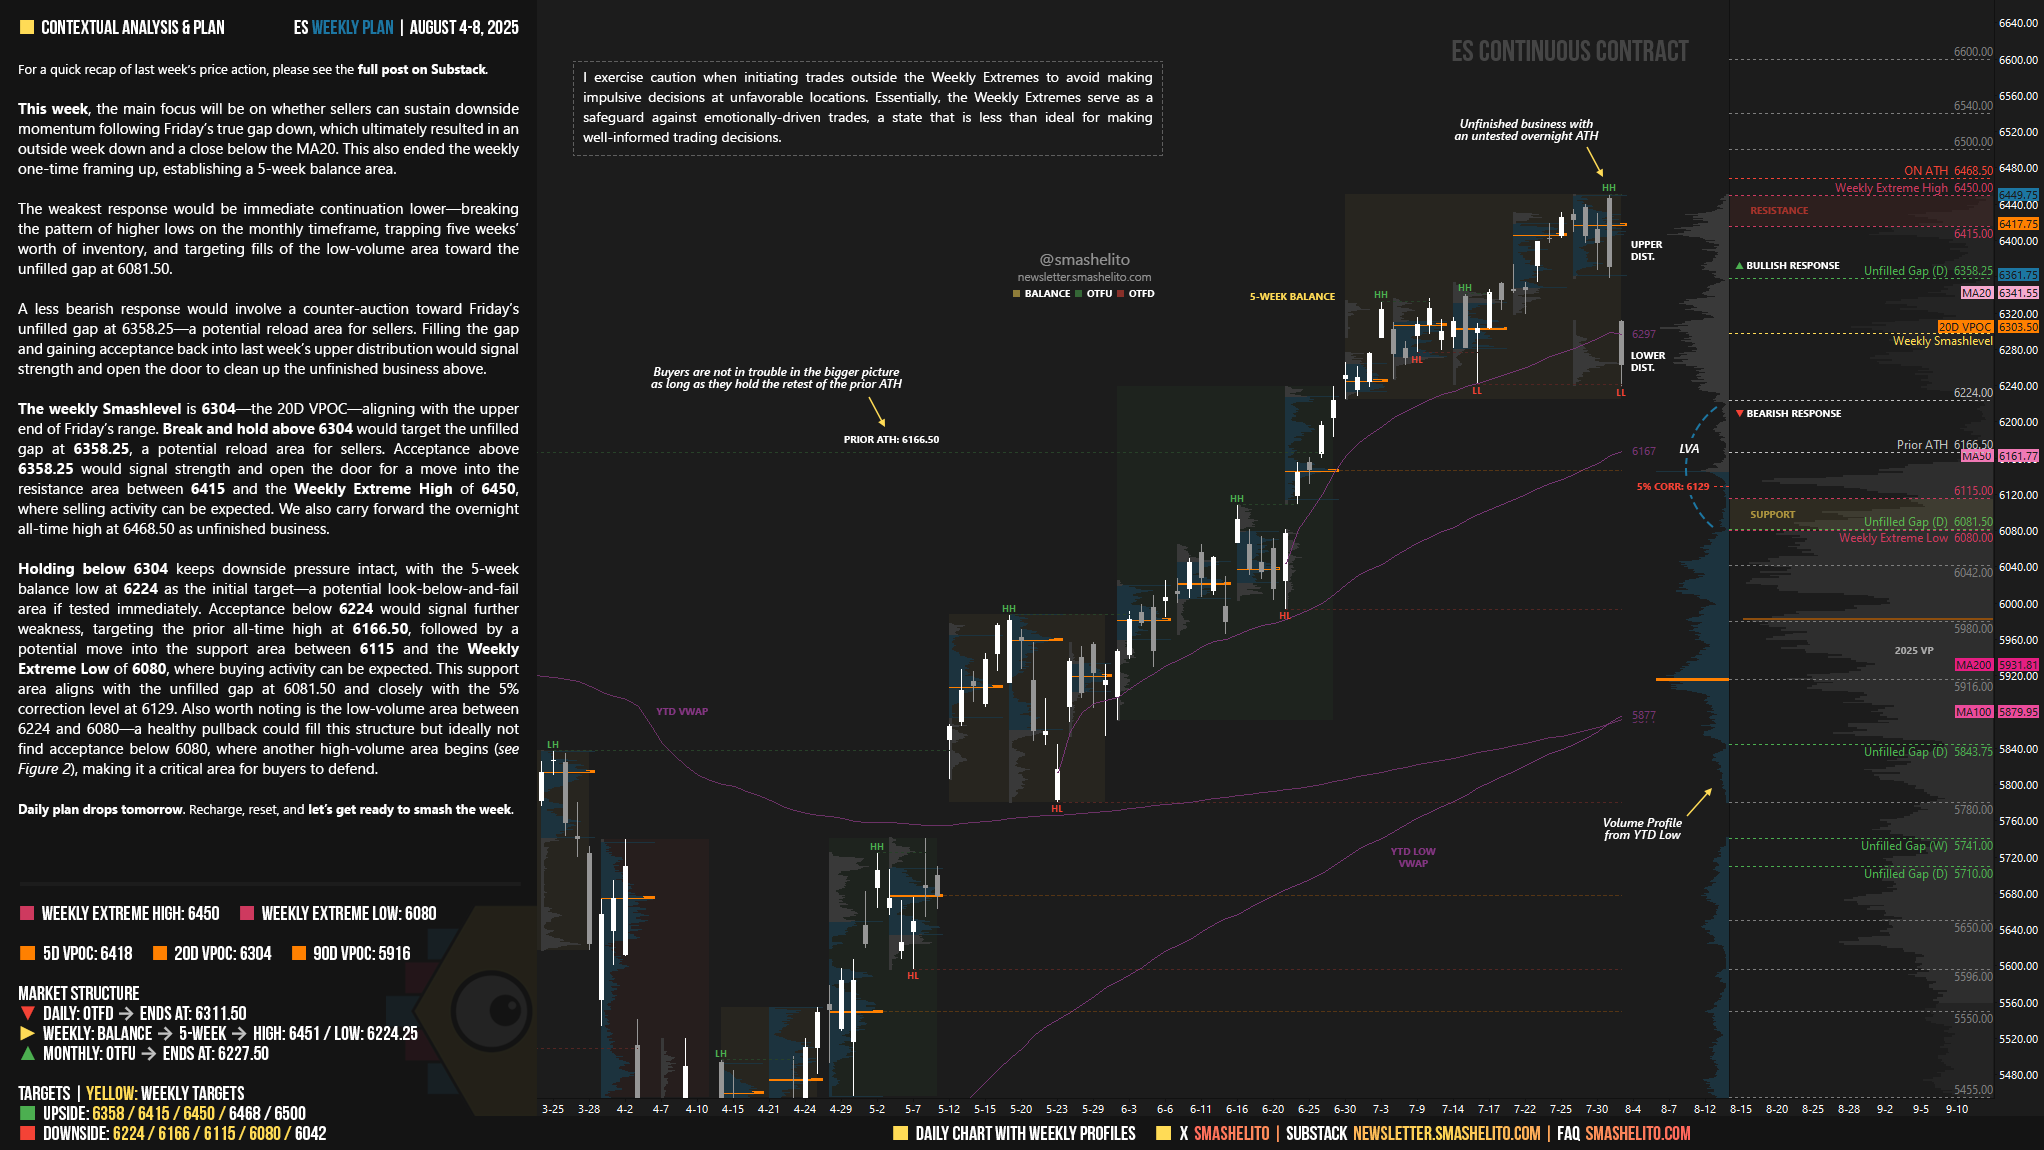
This week, the main focus will be on whether sellers can sustain downside momentum following Friday’s true gap down, which ultimately resulted in an outside week down and a close below the MA20. This also ended the weekly one-time framing up, establishing a 5-week balance area.
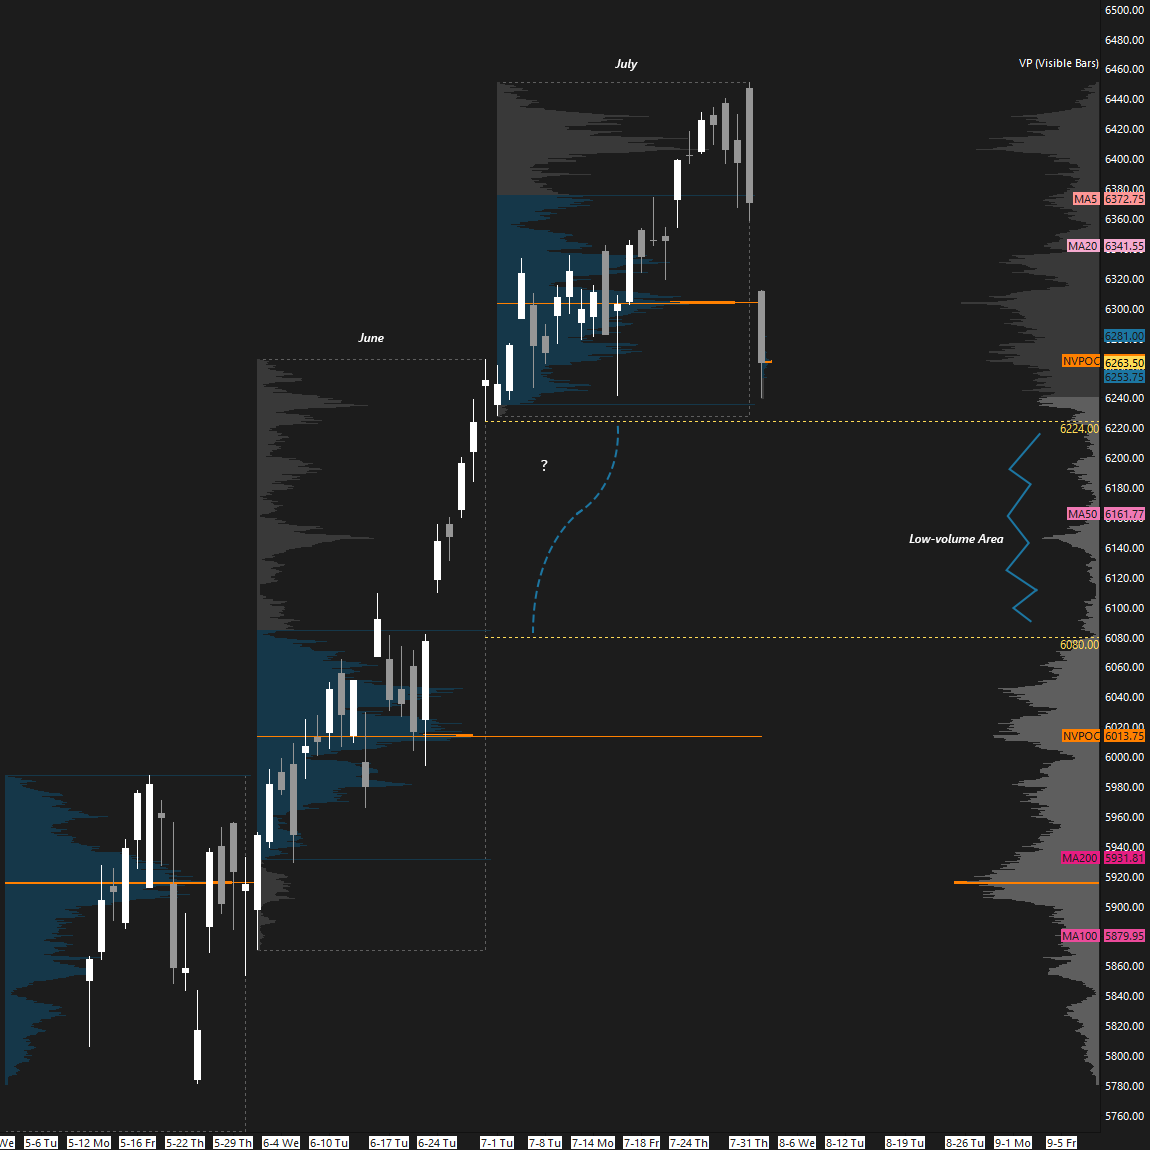
The weakest response would be immediate continuation lower—breaking the pattern of higher lows on the monthly timeframe, trapping five weeks’ worth of inventory, and targeting fills of the low-volume area toward the unfilled gap at 6081.50.
A less bearish response would involve a counter-auction toward Friday’s unfilled gap at 6358.25—a potential reload area for sellers. Filling the gap and gaining acceptance back into last week’s upper distribution would signal strength and open the door to clean up the unfinished business above.
The weekly Smashlevel is 6304—the 20D VPOC—aligning with the upper end of Friday’s range. Break and hold above 6304 would target the unfilled gap at 6358.25, a potential reload area for sellers. Acceptance above 6358.25 would signal strength and open the door for a move into the resistance area between 6415 and the Weekly Extreme High of 6450, where selling activity can be expected. We also carry forward the overnight all-time high at 6468.50 as unfinished business.
Holding below 6304 keeps downside pressure intact, with the 5-week balance low at 6224 as the initial target—a potential look-below-and-fail area if tested immediately. Acceptance below 6224 would signal further weakness, targeting the prior all-time high at 6166.50, followed by a potential move into the support area between 6115 and the Weekly Extreme Low of 6080, where buying activity can be expected. This support area aligns with the unfilled gap at 6081.50 and closely with the 5% correction level at 6129. Also worth noting is the low-volume area between 6224 and 6080—a healthy pullback could fill this structure but ideally not find acceptance below 6080, where another high-volume area begins (see Figure 2), making it a critical area for buyers to defend.
Key Levels of Interest
In the upcoming week, I will closely observe the behavior around 6304.
Break and hold above 6304 would target 6358 / 6415 / 6450* / 6468 / 6500
Holding below 6304 would target 6224 / 6166 / 6115 / 6080* / 6042
*Weekly Extremes. I exercise caution when initiating trades outside the Weekly Extremes to avoid making impulsive decisions at unfavorable locations. Essentially, the Weekly Extremes serve as a safeguard against emotionally-driven trades, a state that is less than ideal for making well-informed trading decisions.
Daily plan drops tomorrow. Recharge, reset, and let’s get ready to smash the week.
Really good reading with levels and explanation. Thanks for sharing your invaluable knowledge with us, for free.
Wow 😮 thanks for revision of last week and now I’m ready to smash the upcoming week. Thank you brotha 🗽❤️