
ES Weekly Plan | August 11-15, 2025
Recap, Market Context & Key Levels for the Week Ahead

Welcome to this week’s plan. Inside, you’ll find a quick review of last week’s price action, key economic events, market structure, context for the week ahead, and the levels I’ll be focusing on. Let’s get prepared.
Contents
Last Week in Review & Bonus Chart
Economic & Earnings Calendar
Market Structure
Contextual Analysis & Plan
Key Levels of Interest
Last Week in Review & Bonus Chart
Last week’s plan: ES Weekly Plan | August 4-8, 2025
Heading into last week, the main focus was whether sellers could sustain downside momentum after the previous week's notable true gap down on Friday, which ultimately resulted in an outside week down and a close below the MA20.
As discussed, a weak market would see an immediate downside continuation, breaking the pattern of higher lows on the monthly timeframe. A less bearish response would involve a counter-auction first, attempting to fill Friday’s true gap at 6358.25, while a strong market would not only fill the gap but also gain acceptance back within the prior week’s upper distribution.
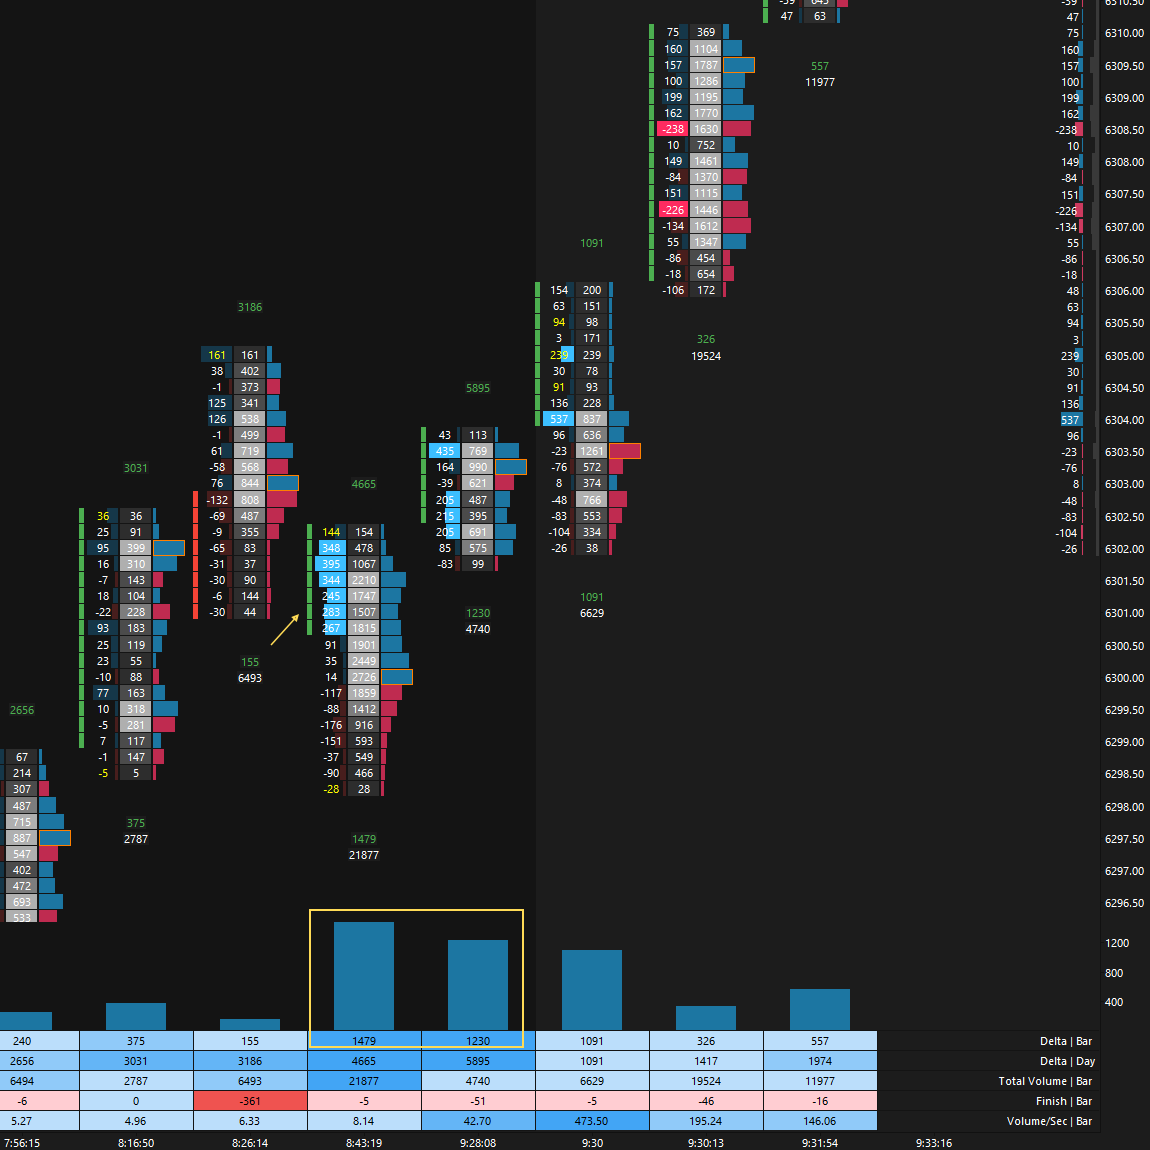
The market kicked off the week with a counter-auction on Monday that fully retraced Friday’s true gap—something stronger sellers wouldn’t have allowed. The Smashlevel for the session was at 6249, and after printing a low (ONL) at 6251.25, the market reversed sharply, rallying over 100 handles. Notable aggressive buying was observed pre-RTH open, suggesting intent (see Figure 1).
Tuesday’s session opened on a true gap up that buyers failed to sustain, triggering long liquidation and resulting in a double distribution trend day down. This essentially defined the week: short-covering rallies followed by long liquidation—a market driven by weak-handed traders quick to exit their positions.
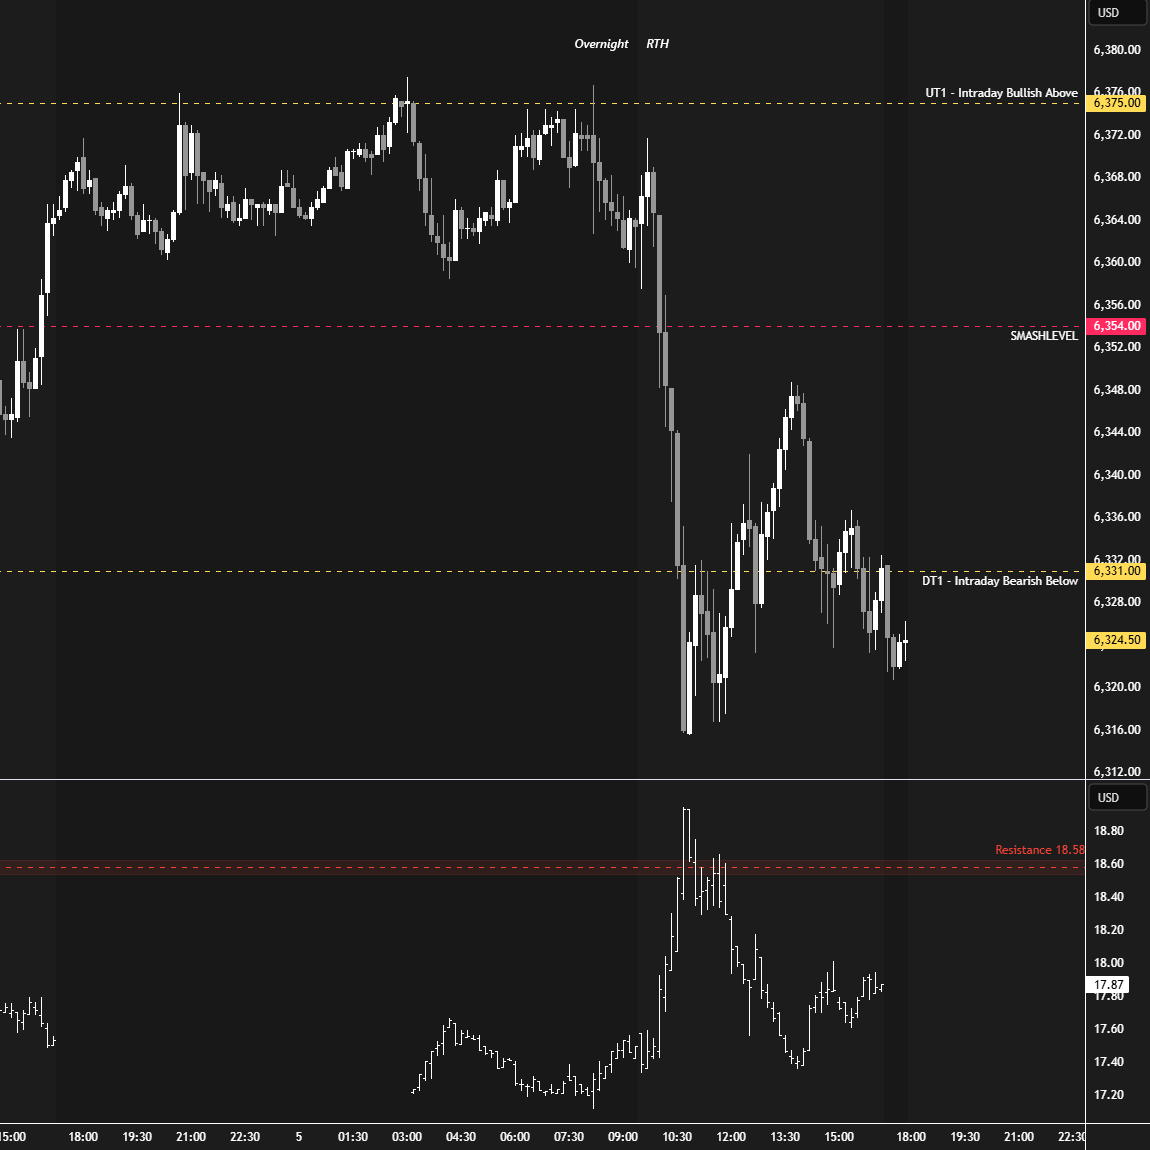
Tuesday’s trend day down failed to attract further initiating selling on Wednesday, resulting in a short-covering rally, with the market managing to close above the 6358 level—meaning within the prior week’s upper distribution. The key now was to monitor whether buyers could continue building value above 6358, as failure to do so would likely see a return to Monday’s and Tuesday’s value.
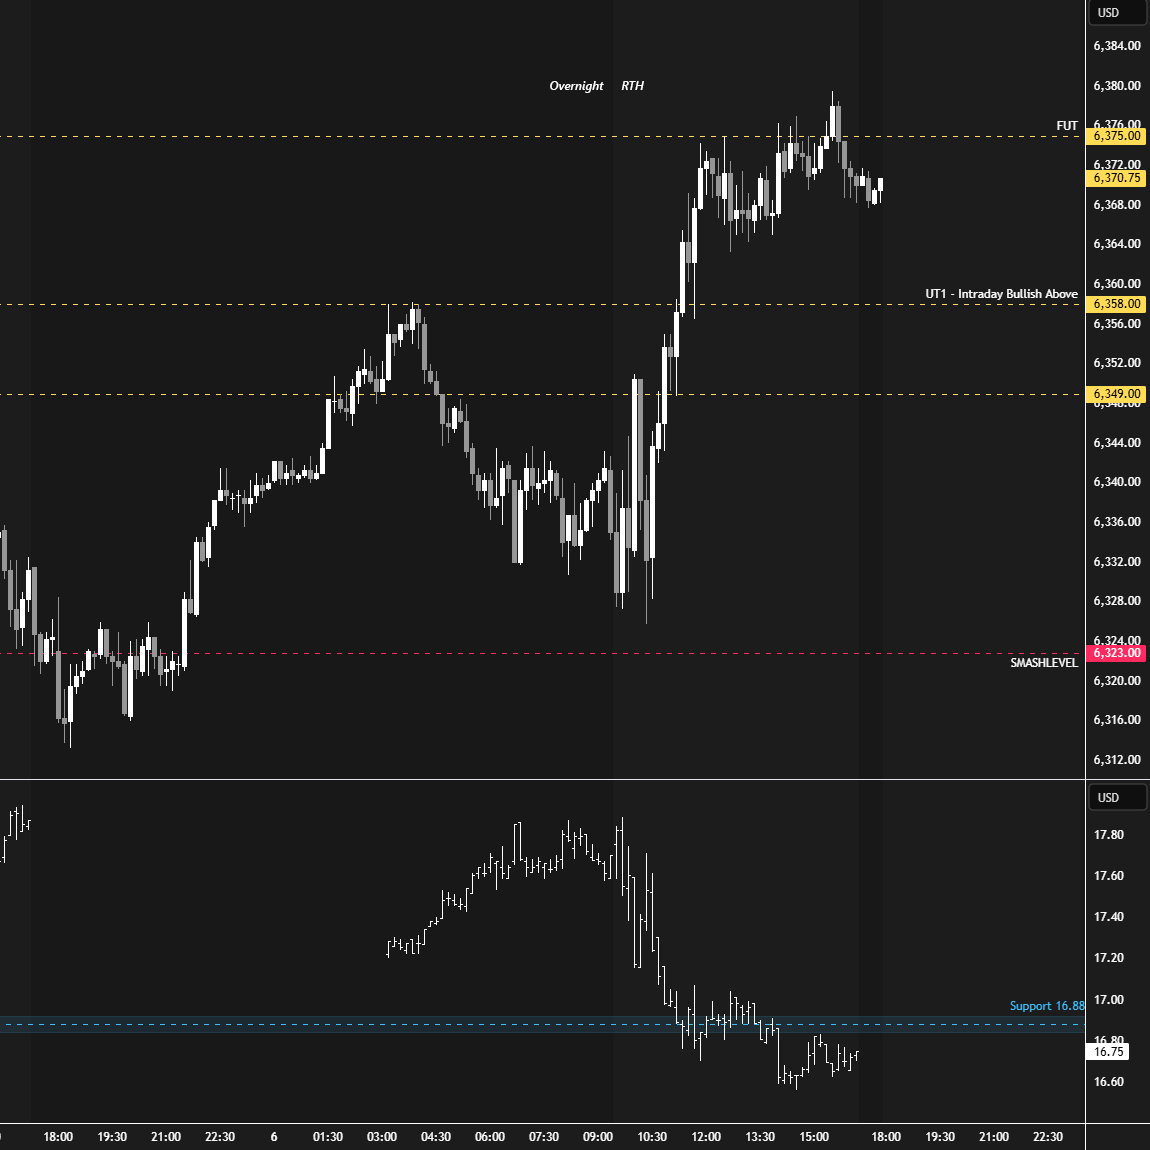
Thursday’s session was reminiscent of Tuesday’s—a double distribution trend day down following a failed attempt by buyers to shift the tone with a true gap higher. Note that the overnight session essentially tagged the final upside target at 6428, from which the market reversed nearly 100 handles. Heading into Friday, the key question was whether Thursday’s sellers would be squeezed like Tuesday’s, or if they could break the pattern.
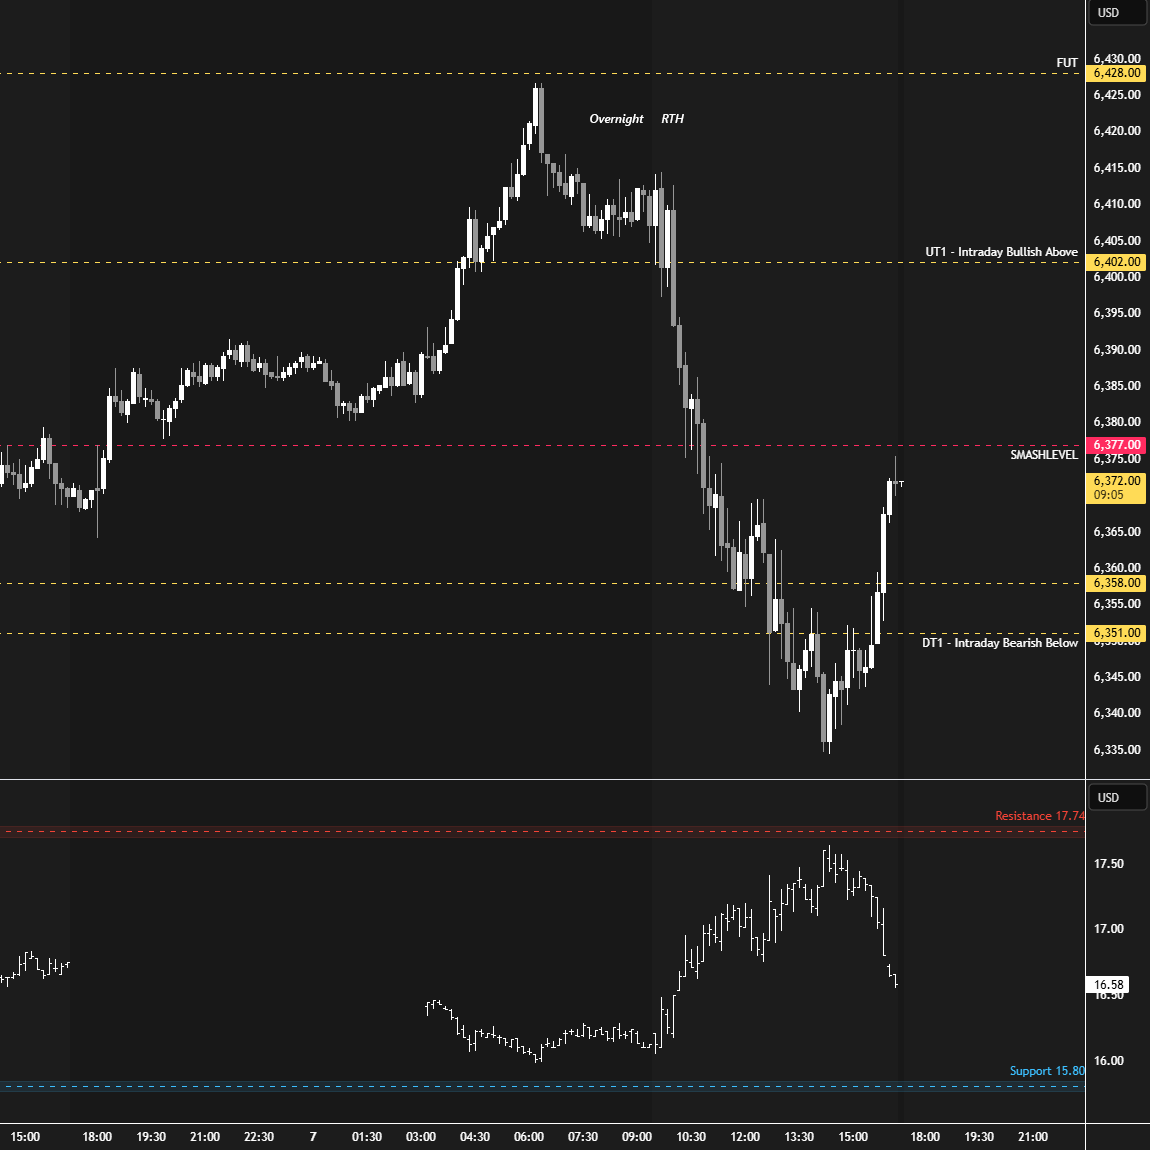
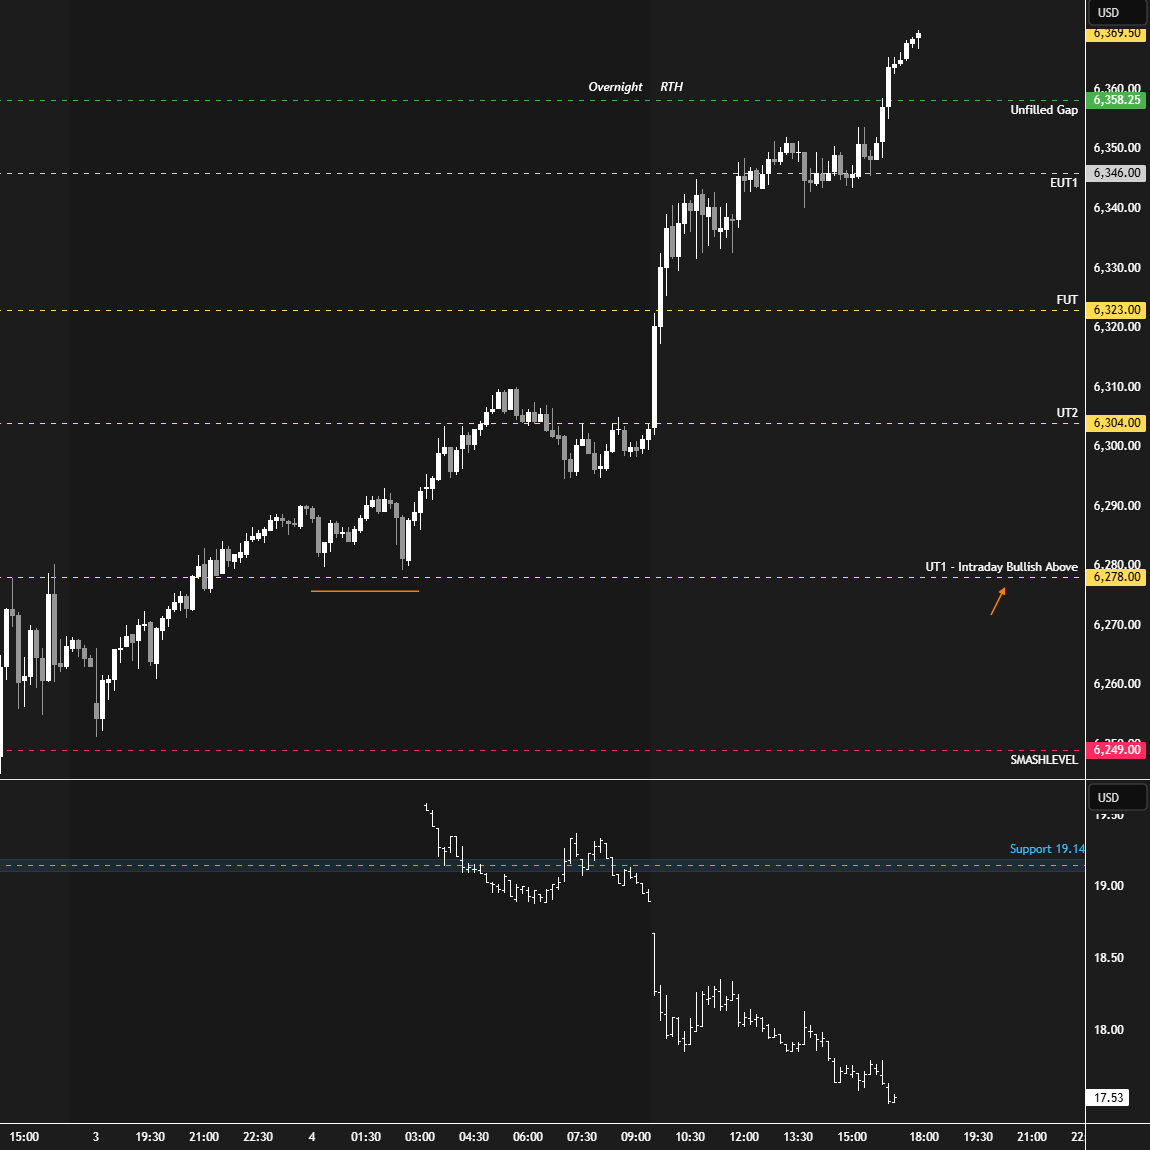
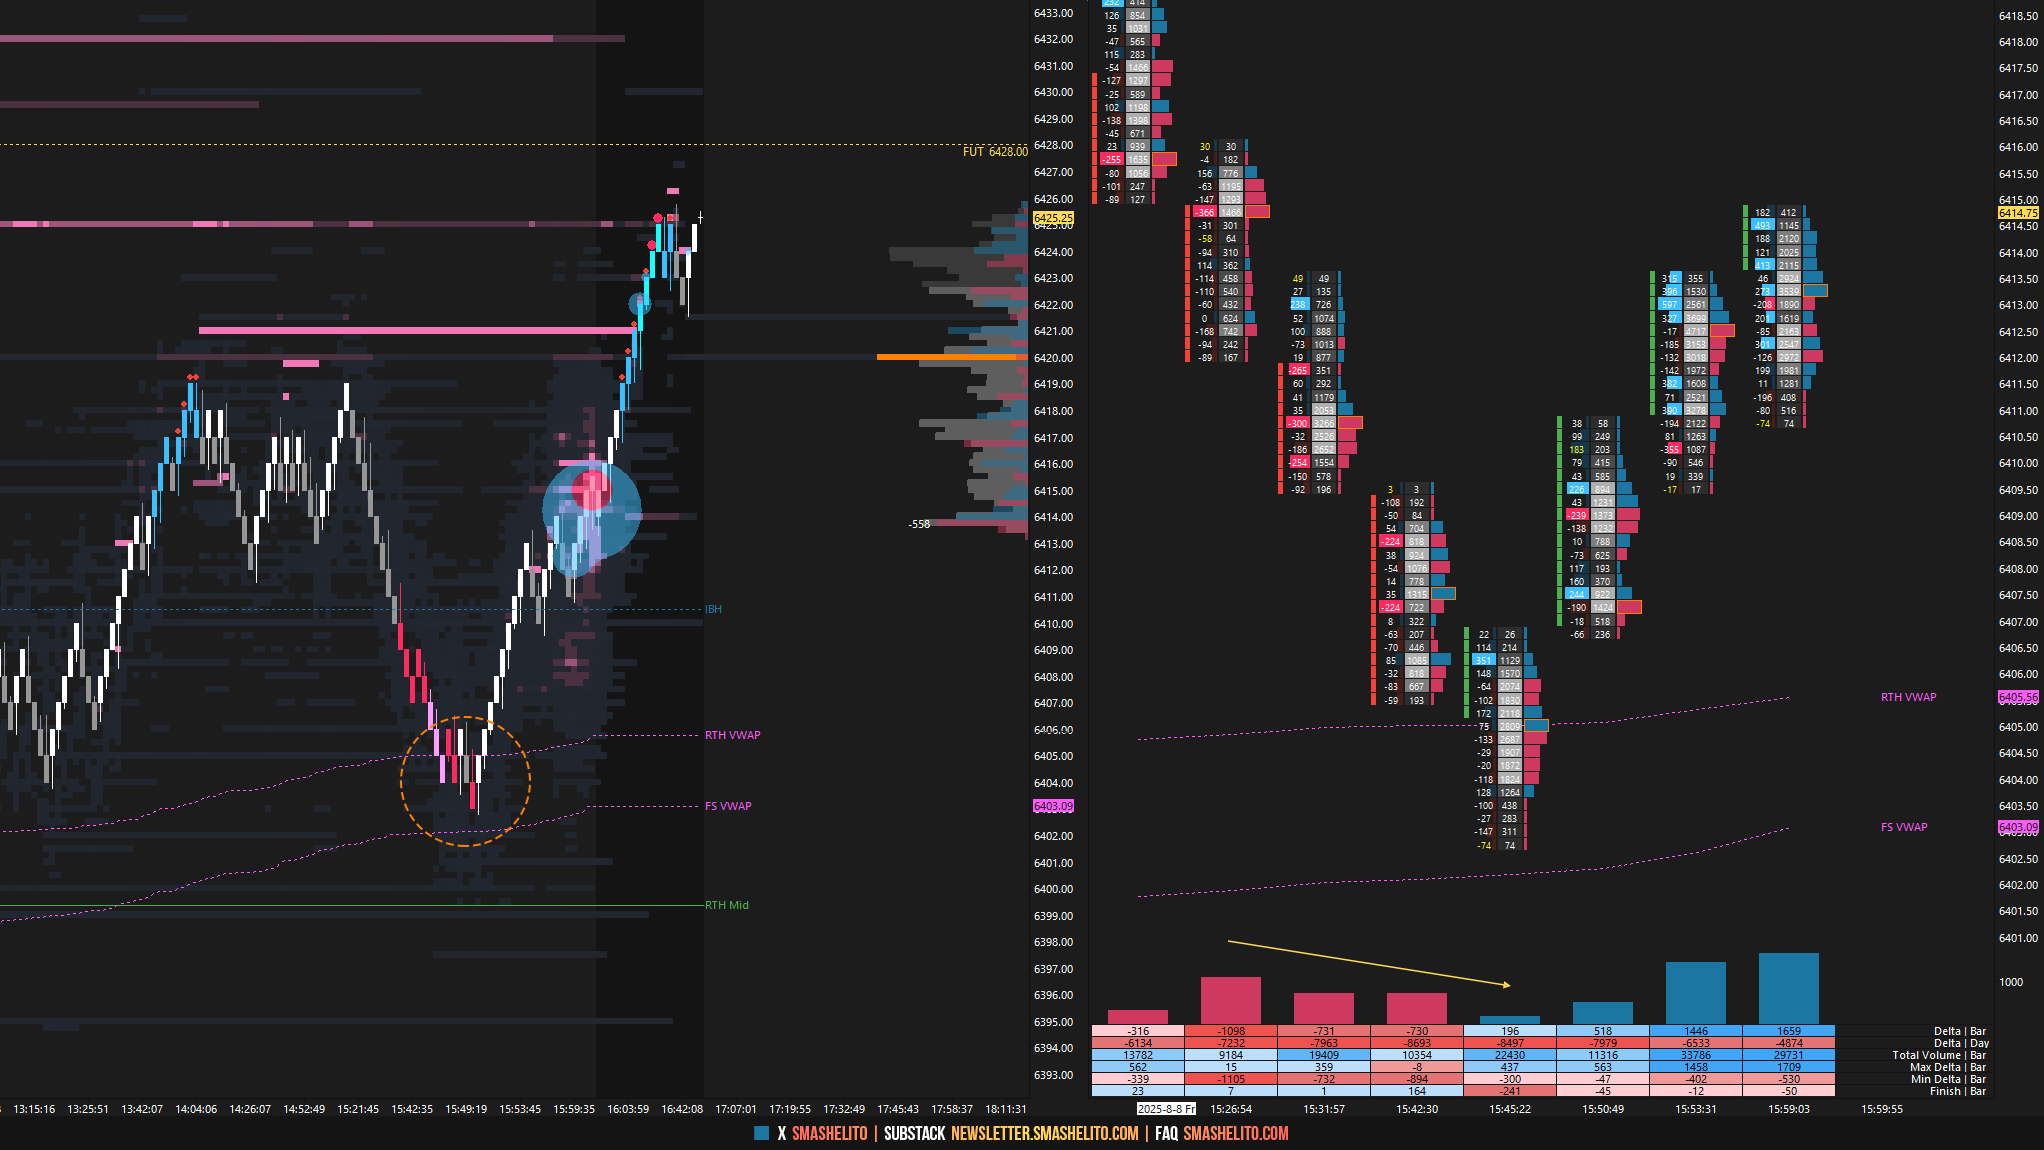
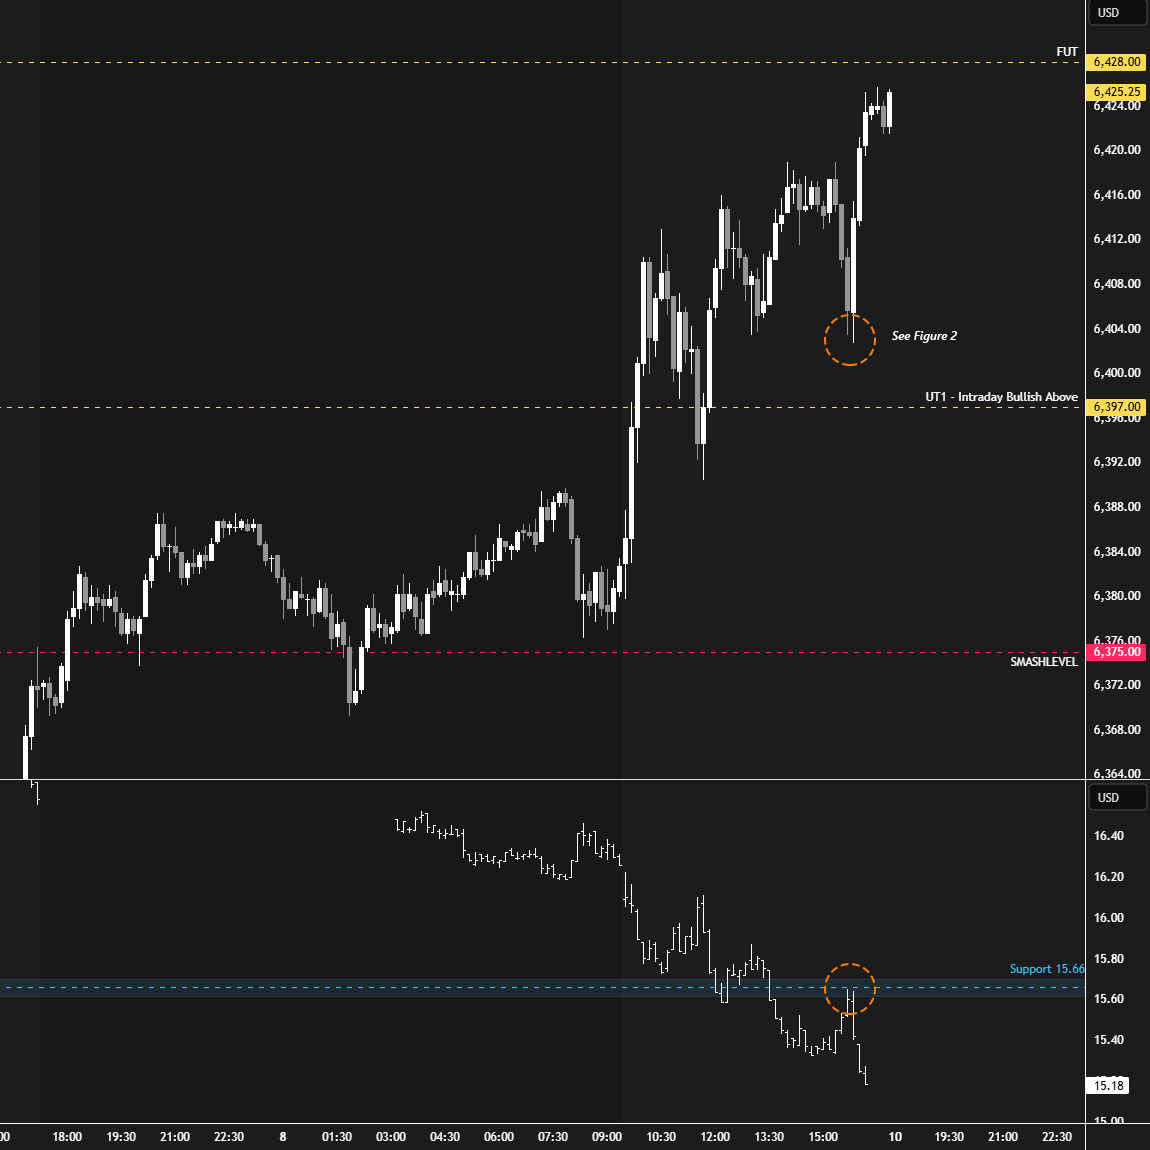
On Friday, the Smashlevel was at 6375—a key level for sellers to defend to maintain downside pressure after Thursday’s trend day. The 6375 level was immediately reclaimed and defended overnight, opening the door for the market to do exactly what Wednesday’s session did—squeeze sellers. This week was all about shaking off the prior day’s bias and quickly adapting to new information. I want to highlight the closing dip that was bought, aligning perfectly with a retest of the broken support level at 15.66 for the VIX, as well as the RTH and FS VWAP (see Figure 2).
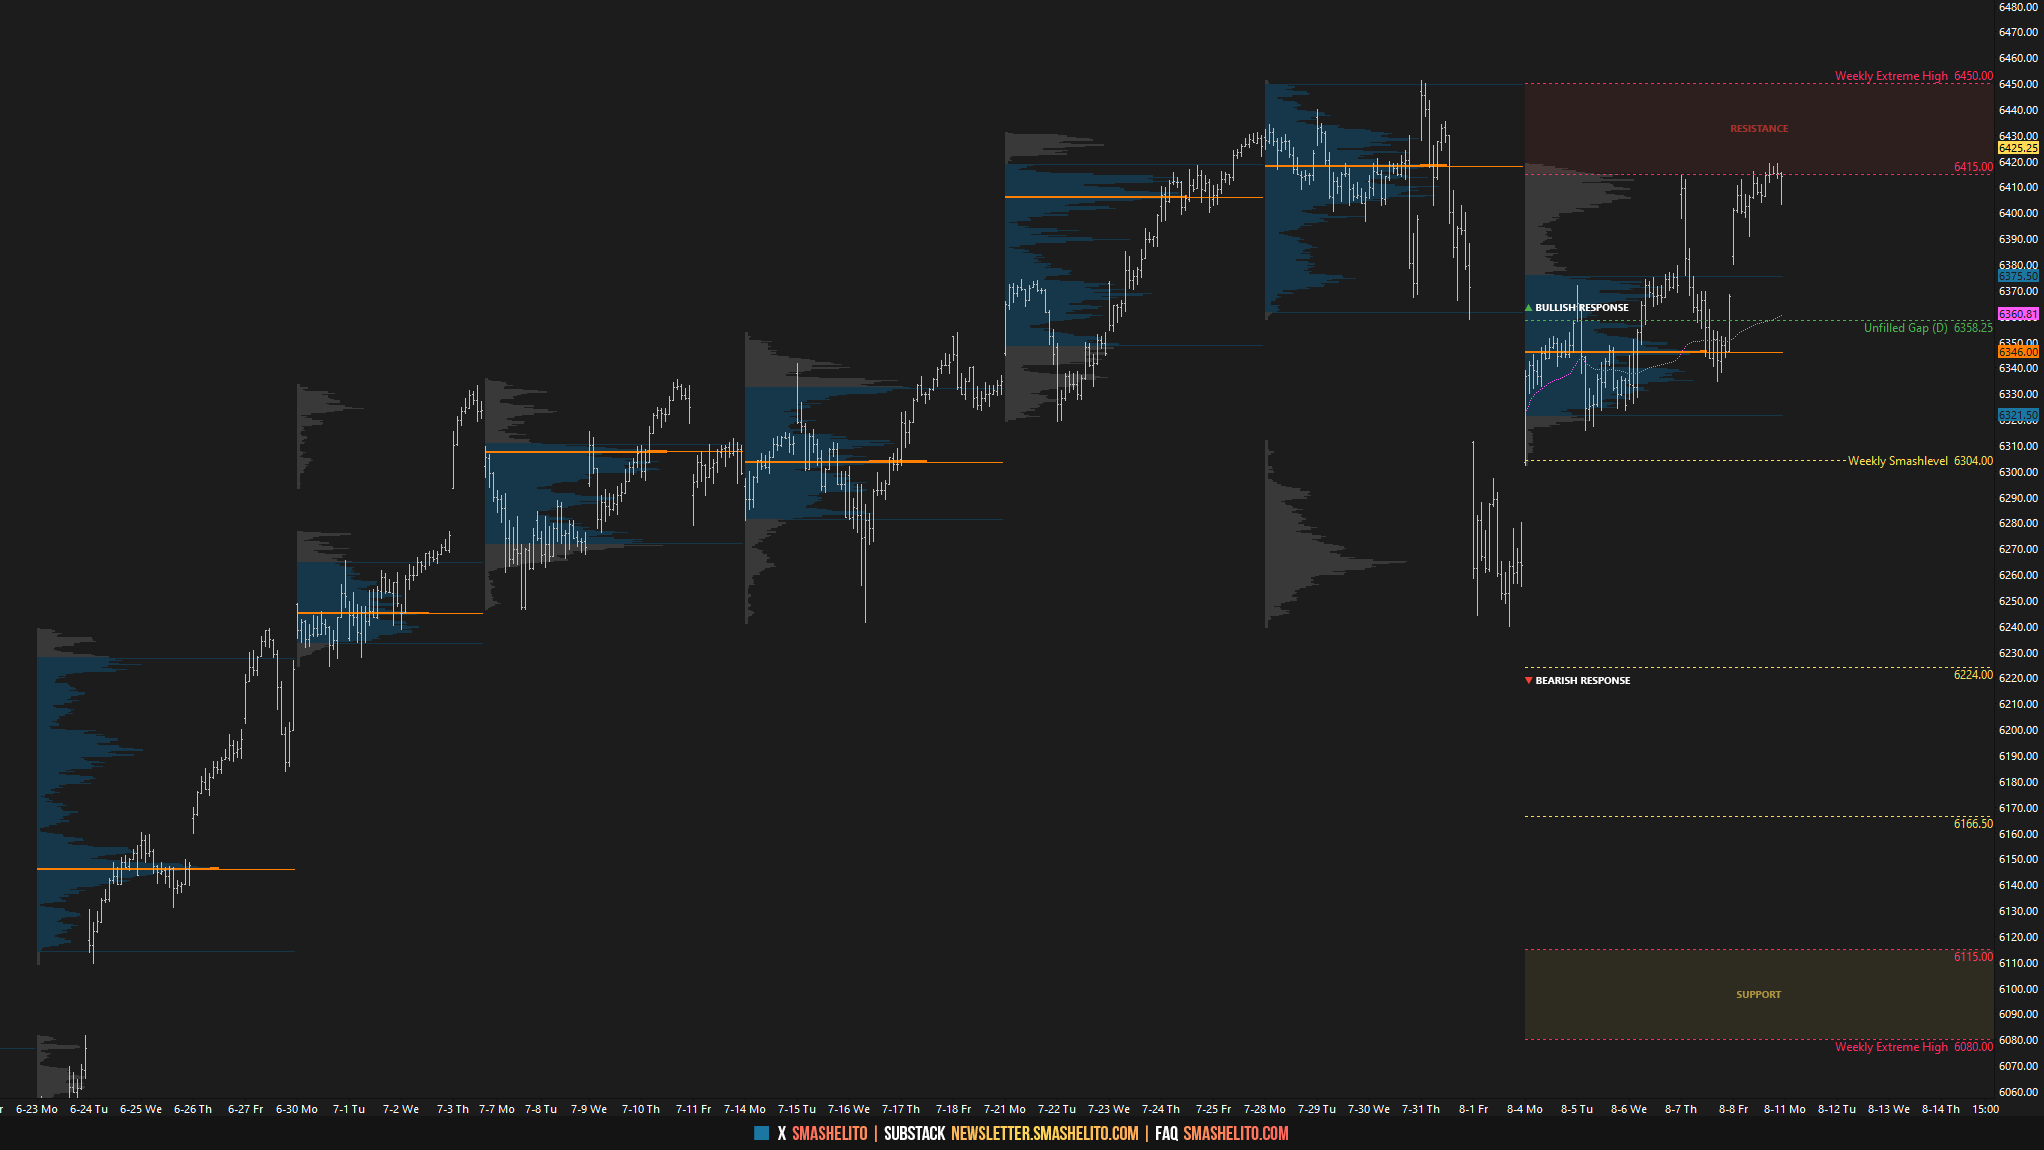
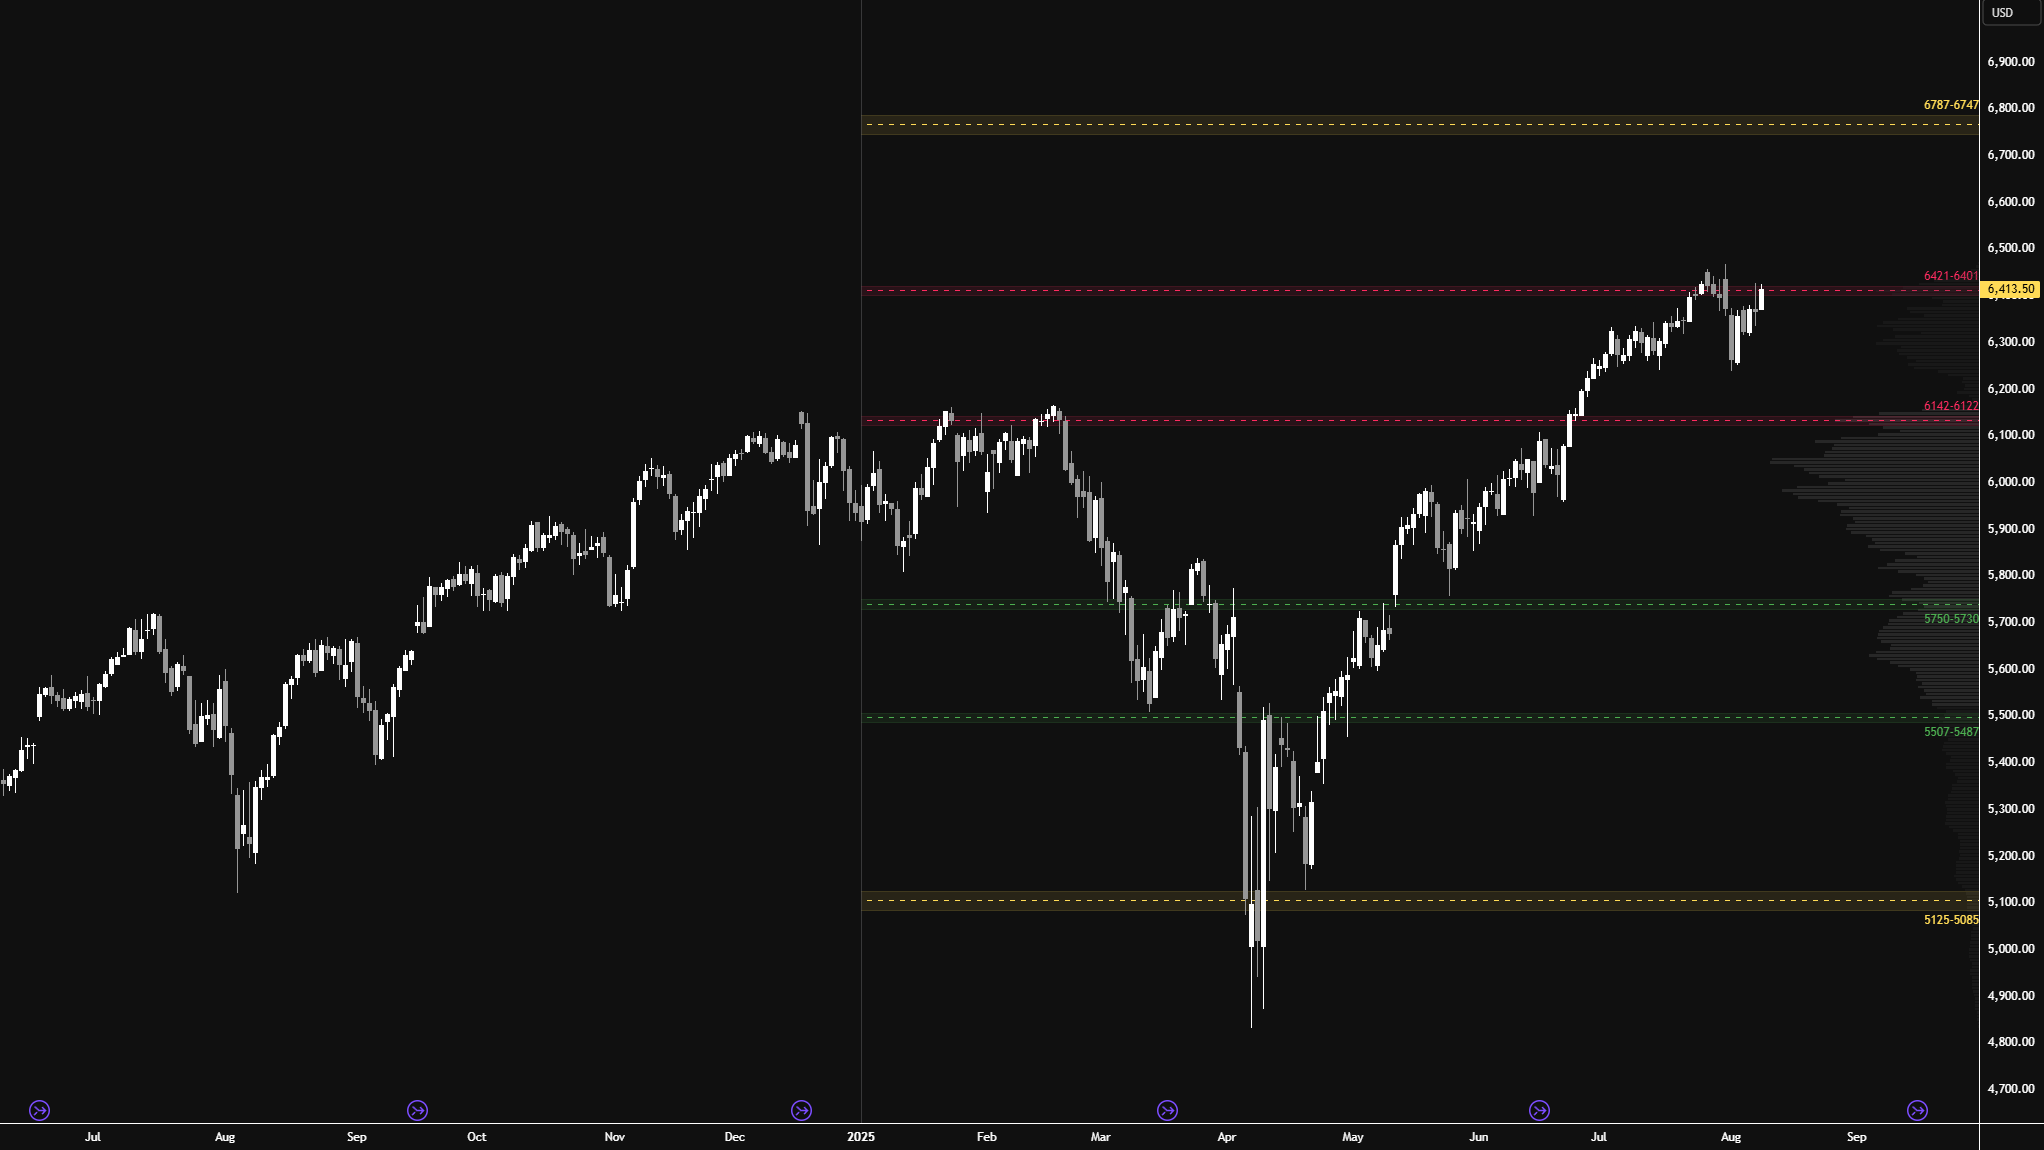
Last week, I shared a chart from a good friend of mine (see Figure 3), featuring levels generated by one of his models at the start of 2025. As you can see, price action this year has respected these levels remarkably well.
The market did react to this area, providing a pullback; however, we are already retesting it. Reclaiming the 6421–6401 area of interest would be a sign of strength, while failure to do so could create a challenging environment—much like at the start of the year, when the 6142–6122 area was tested multiple times.
As mentioned last week, in the event of a deeper pullback, the obvious area that needs to hold is the prior all-time high from earlier this year, which roughly aligns with the 6142–6122 area—also the location of the year’s value area high. This area also roughly corresponds to a 5% correction from the all-time highs. Acceptance below 6142–6122 would mark the beginning of potential real trouble for buyers. Why? Because acceptance within this year’s value area could trigger a value traverse—a 15% correction.
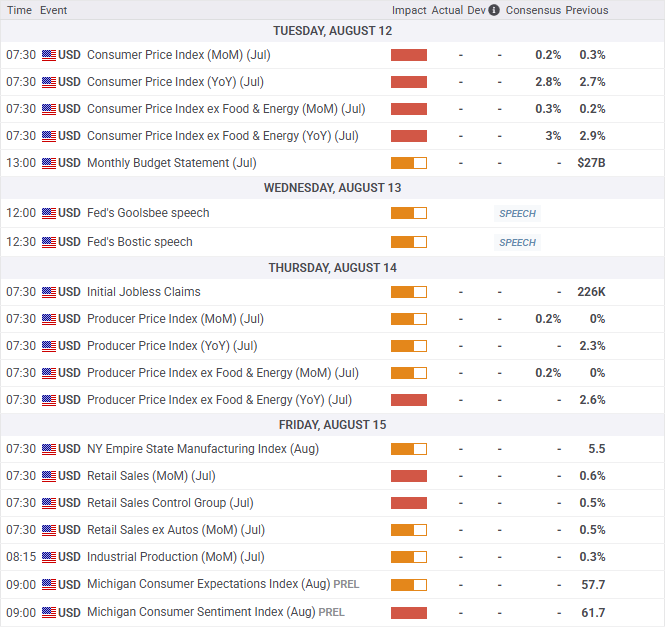
Economic & Earnings Calendar
Market Structure
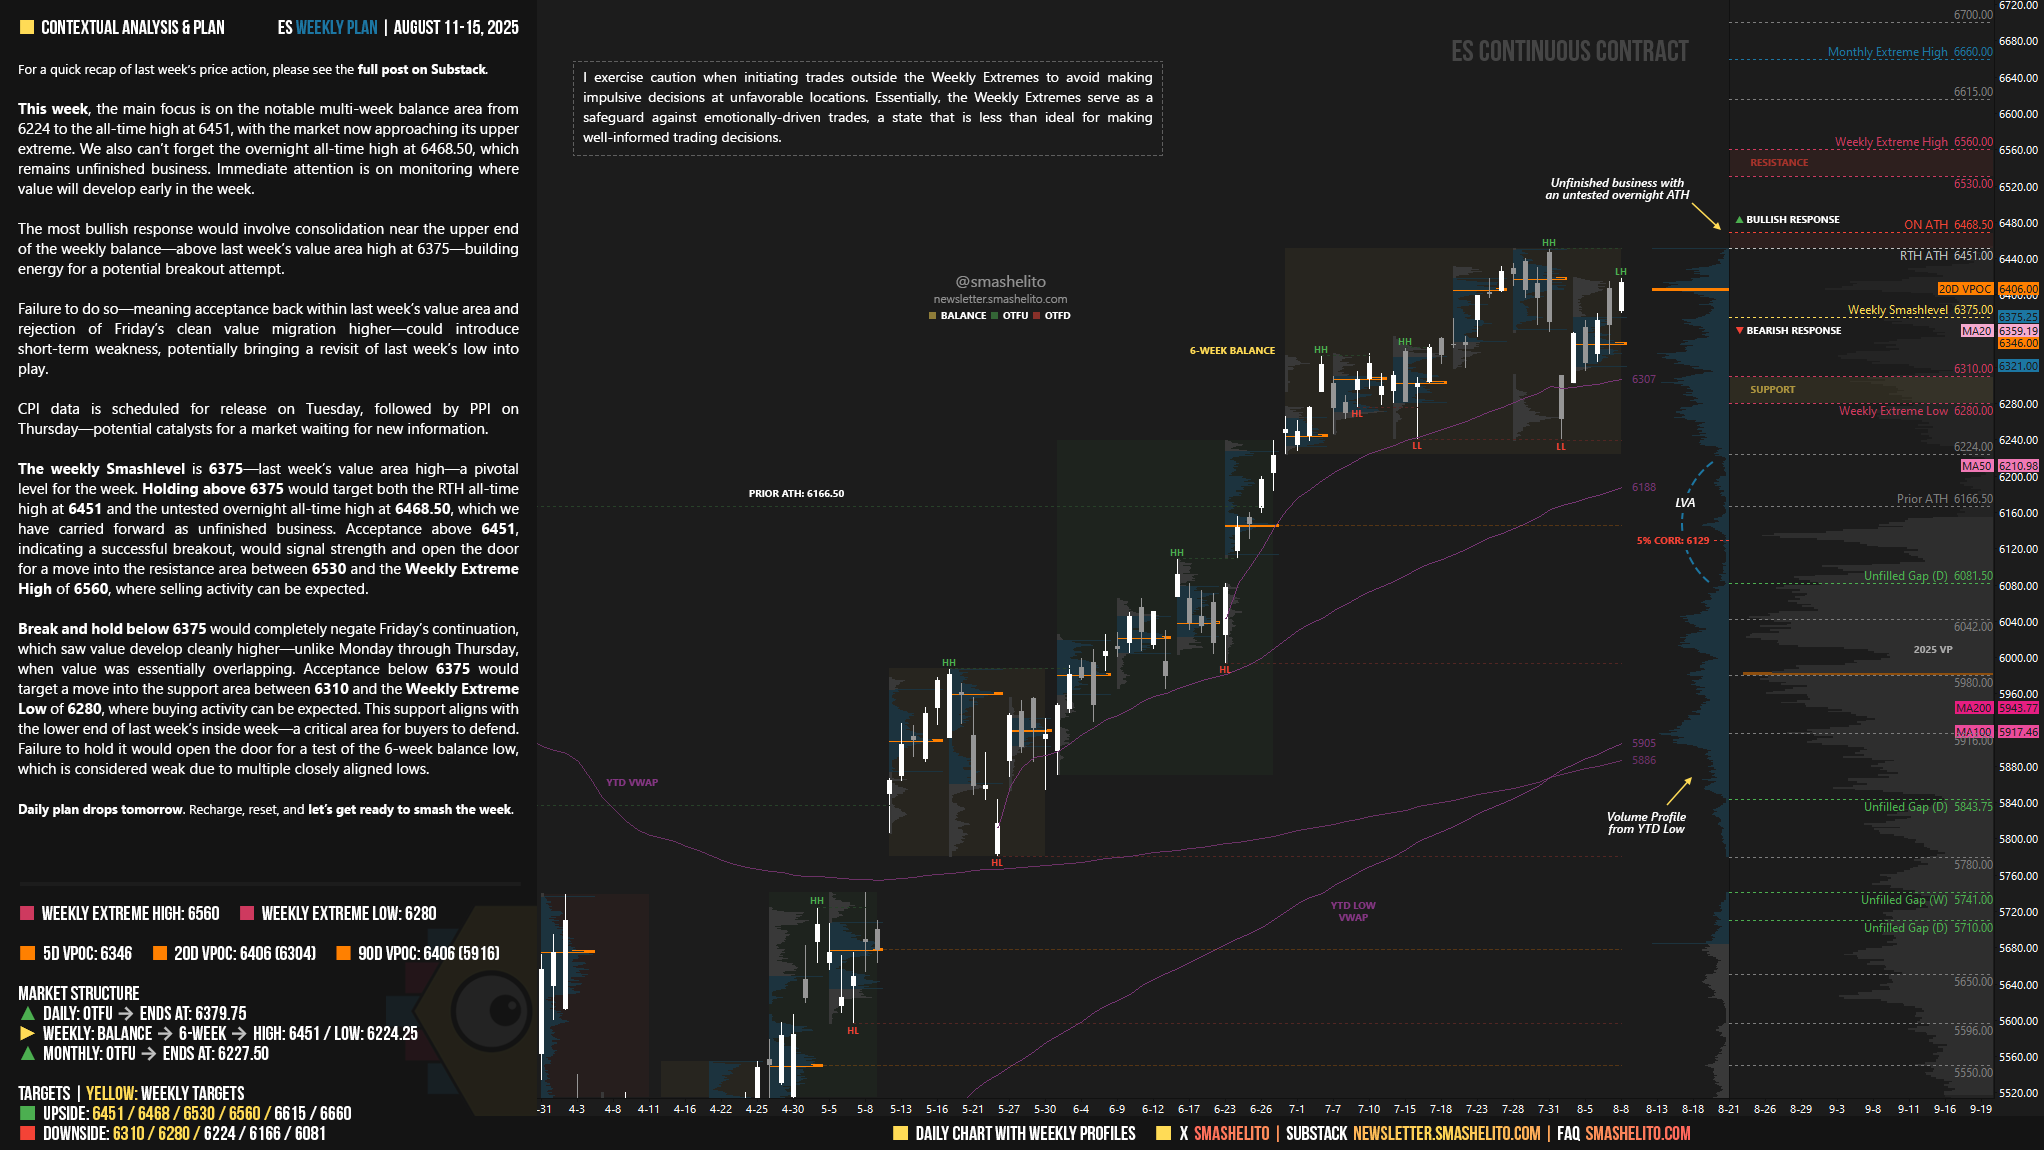
🟩 Daily: OTFU → Ends at: 6379.75
🟨 Weekly: BALANCE → 6-Week → High: 6451 / Low: 6224.25
🟩 Monthly: OTFU → Ends at: 6227.50
Balance: A market condition where price consolidates within a defined range, reflecting indecision as the market awaits more market-generated information. We apply balance guidelines—favoring fade trades at range extremes (highs/lows) and preparing for breakout setups if balance resolves.
One-Time Framing Up (OTFU): A market condition where each subsequent bar forms a higher low, signaling a strong upward trend.
One-Time Framing Down (OTFD): A market condition where each subsequent bar forms a lower high, signaling a strong downward trend.
Contextual Analysis & Plan
This week, the main focus is on the notable multi-week balance area from 6224 to the all-time high at 6451, with the market now approaching its upper extreme. We also can’t forget the overnight all-time high at 6468.50, which remains unfinished business. Immediate attention is on monitoring where value will develop early in the week.
The most bullish response would involve consolidation near the upper end of the weekly balance—above last week’s value area high at 6375—building energy for a potential breakout attempt.
Failure to do so—meaning acceptance back within last week’s value area and rejection of Friday’s clean value migration higher—could introduce short-term weakness, potentially bringing a revisit of last week’s low into play.
CPI data is scheduled for release on Tuesday, followed by PPI on Thursday—potential catalysts for a market waiting for new information.
The weekly Smashlevel is 6375—last week’s value area high—a pivotal level for the week. Holding above 6375 would target both the RTH all-time high at 6451 and the untested overnight all-time high at 6468.50, which we have carried forward as unfinished business. Acceptance above 6451, indicating a successful breakout, would signal strength and open the door for a move into the resistance area between 6530 and the Weekly Extreme High of 6560, where selling activity can be expected.
Break and hold below 6375 would completely negate Friday’s continuation, which saw value develop cleanly higher—unlike Monday through Thursday, when value was essentially overlapping. Acceptance below 6375 would target a move into the support area between 6310 and the Weekly Extreme Low of 6280, where buying activity can be expected. This support aligns with the lower end of last week’s inside week—a critical area for buyers to defend. Failure to hold it would open the door for a test of the 6-week balance low, which is considered weak due to multiple closely aligned lows.
Key Levels of Interest
In the upcoming week, I will closely observe the behavior around 6375.
Holding above 6375 would target 6451 / 6468 / 6530 / 6560* / 6615 / 6660
Break and hold below 6375 would target 6310 / 6280* / 6224 / 6166 / 6081
*Weekly Extremes. I exercise caution when initiating trades outside the Weekly Extremes to avoid making impulsive decisions at unfavorable locations. Essentially, the Weekly Extremes serve as a safeguard against emotionally-driven trades, a state that is less than ideal for making well-informed trading decisions.
Daily plan drops tomorrow. Recharge, reset, and let’s get ready to smash the week.
This is great! Thanks Smash!
Thank you!