
ES Weekly Plan | April 28 - May 2, 2025
Key Levels & Market Context for the Upcoming Week.

Economic Calendar

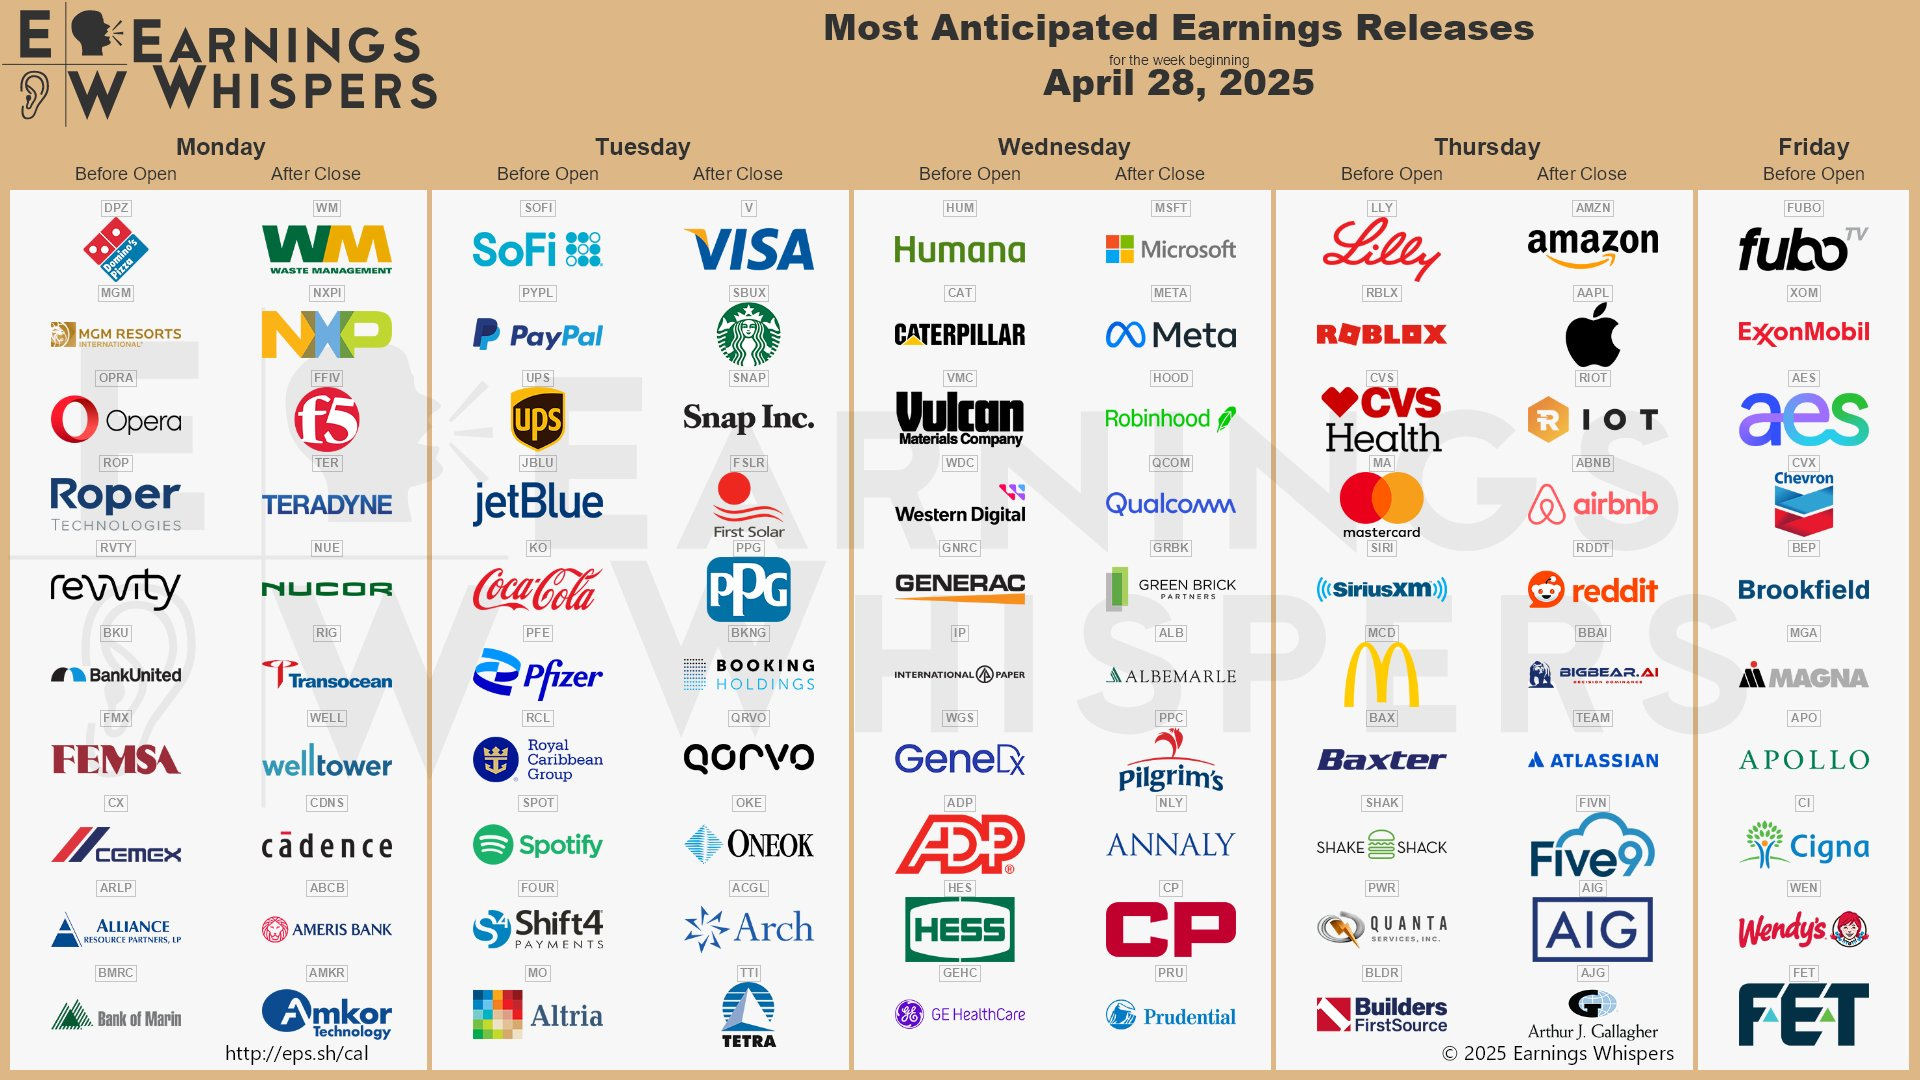
Earnings Calendar
Visual Representation

Market Structure
🟩 DAILY: OTFU | Ends: 5480.25
🟨 WEEKLY: BALANCE | 2W | 5554.50-5127.25
🟥 MONTHLY: OTFD | Ends: 5997
One-time Framing Down (OTFD): A market condition where each subsequent bar forms a lower high, indicating a strong downward trend. The opposite condition, One-time Framing Up (OTFU), occurs when each subsequent bar forms a higher low, indicating a strong upward trend.
Contextual Analysis
The previous week kicked off with an inside-week breakdown on Monday, leading to a test of the highlighted weekly support area between 5125 and 5085 (LOD: 5127.25), marked as a crucial area for buyers to defend. While the breakdown initially succeeded in dropping the market by 100+ handles, buyers managed to reclaim the inside-week low on Tuesday, triggering a move in the opposite direction, in line with general balance guidelines. In the prior Weekly Plan, I mentioned that ES above 5290 along with VIX below 29.30 would be a positive development. Tuesday’s session closed back above 5290, while the VIX closed below 29 for the first time since April 2nd, following a true gap up in ES on Wednesday. Wednesday’s session tested the weekly resistance between 5490 and 5530 and found selling activity; however, buyers managed to continue grinding higher on Thursday, after showing no interest in filling the gap. Friday’s session closed above the 50% retracement from the ATH, above March’s low, and right at the 10% correction level of 5550, concluding with an outside week up.

This week, the main focus will be on whether buyers can build on last week’s momentum, which was triggered by a look below and fail of the prior week’s inside week, leading to an outside week up. In the process, the market reclaimed the 50% retracement from the ATH and closed back within March’s range. A strong market will continue to build acceptance above the clustered VPOCs from the last two weeks, setting the stage for a move to fill the gap at 5610.75 and potentially revisit the HVN at 5750. Failure to do so would open the door to filling last week’s gap at 5339.25, which aligns with the Monthly VWAP, with the most favorable scenario for sellers involving acceptance back within last week’s lower distribution.
The weekly Smashlevel is 5550—the 10% correction level that capped Friday’s upside. Break and hold above 5550 would target the unfilled gap at 5610.75. Acceptance above 5610 would signal strength, targeting 5670—the 61.8% retracement from the all-time high (ATH), followed by the resistance area from 5715 to the Weekly Extreme High of 5755, where selling activity can be expected. This resistance coincides with the most traded price by volume (VPOC) on the volume profile from the ATH, acting as an upside magnet on continued strength, with the YTD VWAP also in close proximity.
Holding below 5550 would target last week’s VPOC at 5475, aligning closely with the VPOC from the prior week. Break and hold below 5475 would signal weakness, targeting the support area from 5380 to the Weekly Extreme Low of 5340, where buying activity can be expected. This support coincides with the Monthly VWAP and the unfilled gap at 5339.25—a crucial area for buyers to defend, as acceptance back within last week’s lower distribution would signal further weakness.
Levels of Interest
In the upcoming week, I will closely observe the behavior around 5550.
Break and hold above 5550 would target 5610 / 5670 / 5715 / 5755* / 5813 / 5858
Holding below 5550 would target 5475 / 5380 / 5340* / 5290 / 5217 / 5143
*Weekly Extremes. I exercise caution when initiating trades outside the Weekly Extremes to avoid making impulsive decisions at unfavorable locations. Essentially, the Weekly Extremes serve as a safeguard against emotionally-driven trades, a state that is less than ideal for making well-informed trading decisions.
As usual, a detailed daily plan will be published tomorrow. In the meantime, enjoy the rest of your weekend!
Thank you!
Thanks again, Smash!