
ES Weekly Plan | April 20-24, 2026
Recap, Market Context & Key Levels for the Week Ahead

Welcome to this week’s plan. Inside, you’ll find a quick review of last week’s price action, key economic events, market structure, context for the week ahead, and the levels I’ll be focusing on. Let’s get prepared.
Contents
Last Week in Review
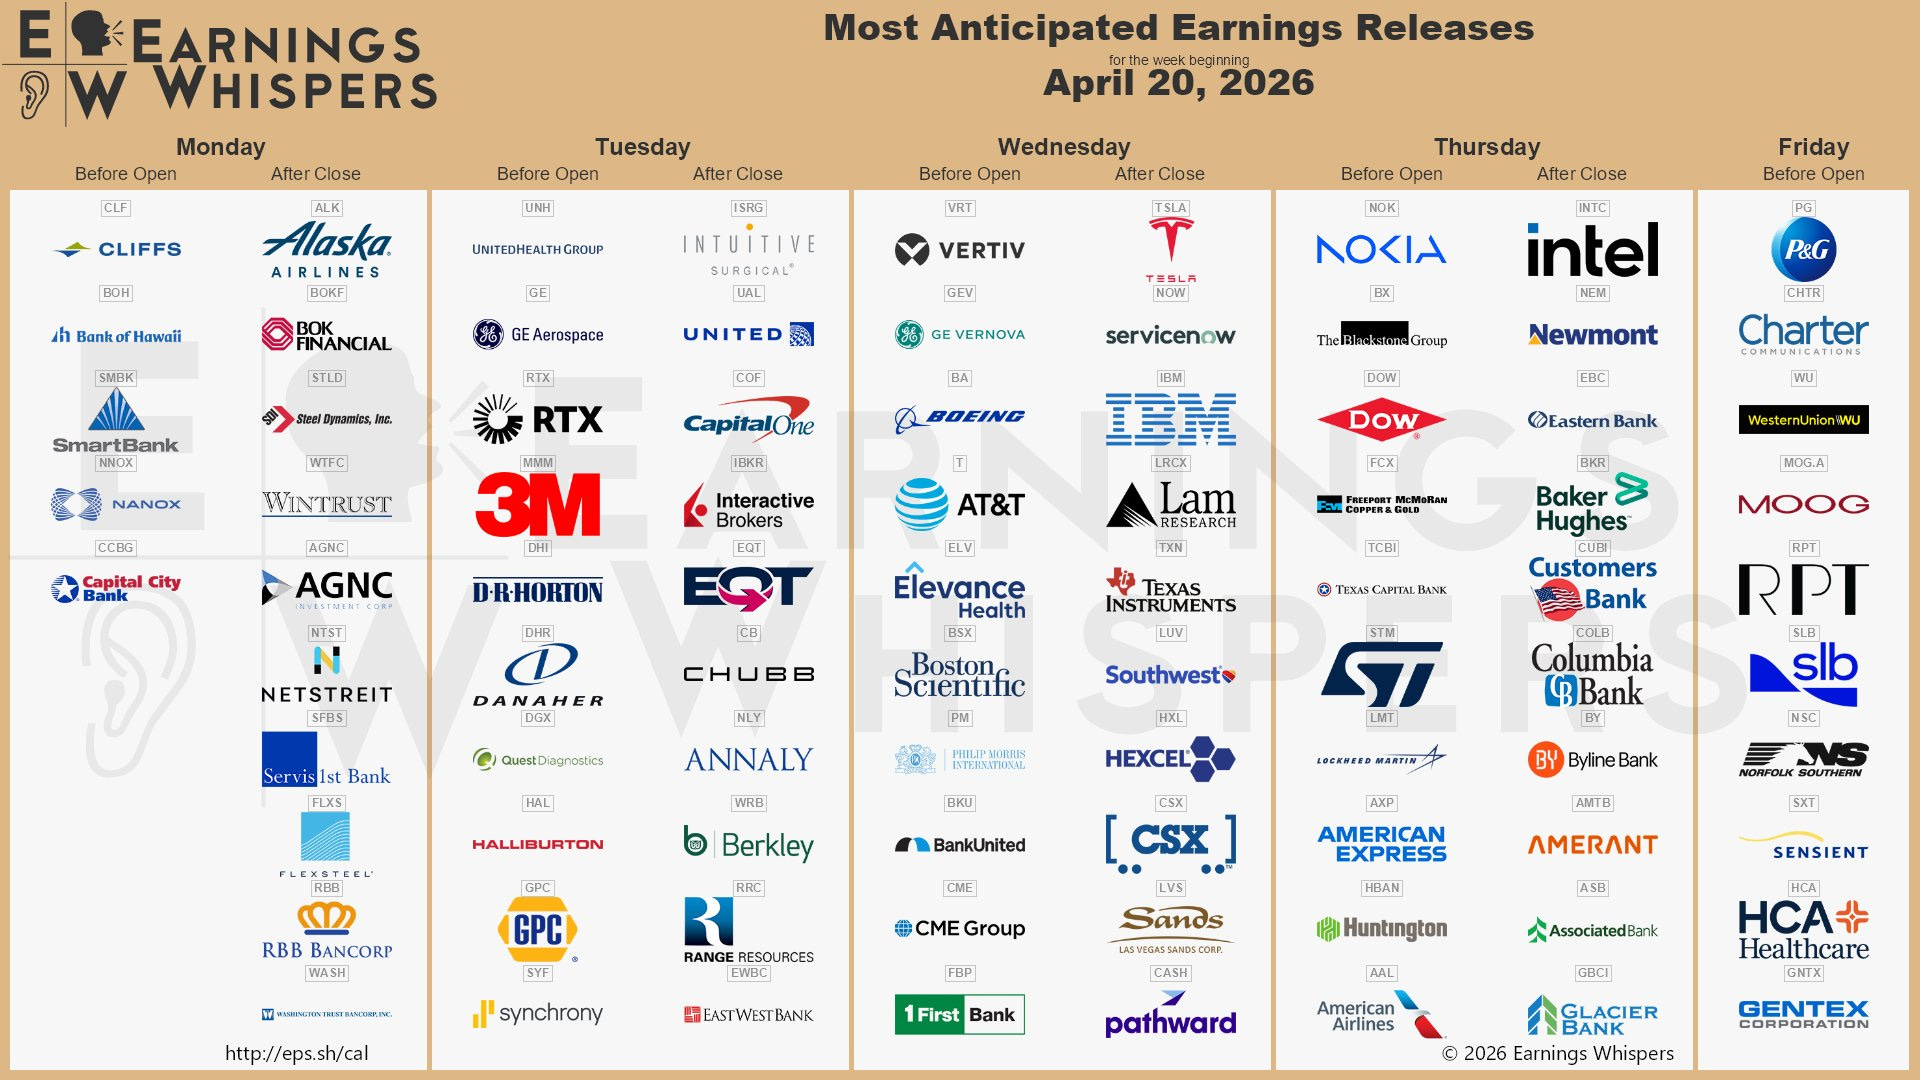
Economic & Earnings Calendar
Market Structure
Contextual Analysis & Plan
Key Levels of Interest
Last Week in Review
Last week’s plan:

Last week, the key focus was whether buyers could maintain upside momentum following the significant true gap higher on Wednesday, April 8. The objective for buyers was to continue building value within the prior multi-week balance area, setting the stage for a revisit of the all-time highs, where there was unfinished business, including an untested overnight ATH at 7043 and a lack of meaningful excess, reflected in a poor high on the daily chart.
I’m not sure how to recap last week other than saying it was a historically one-sided auction. The week began with immediate weakness, testing the large gap area between 6780 and 6659. As discussed, acceptance into the gap area had the potential to introduce weakness, while failure to do so would be bullish, as it would indicate that sellers attempted to shift the tone but failed, keeping the short-term upside trend intact following Wednesday’s true gap higher on April 8.
The highest-probability setups occur when counter-trend initiative fails to meaningfully shift the direction of the auction. In order flow terms, aggressive counter-trend participation is absorbed rather than accepted, signaling a lack of strength from opposing participants. This failure reinforces confidence in trend-aligned participants, often leading to continuation in the direction of the prevailing trend, driven by trapped participants and renewed initiative flow.
Monday’s closing strength was followed by a true gap higher on Tuesday, forming a P-shape and closing at the highs, 30 handles shy of the multi-week balance high and the all-time highs.
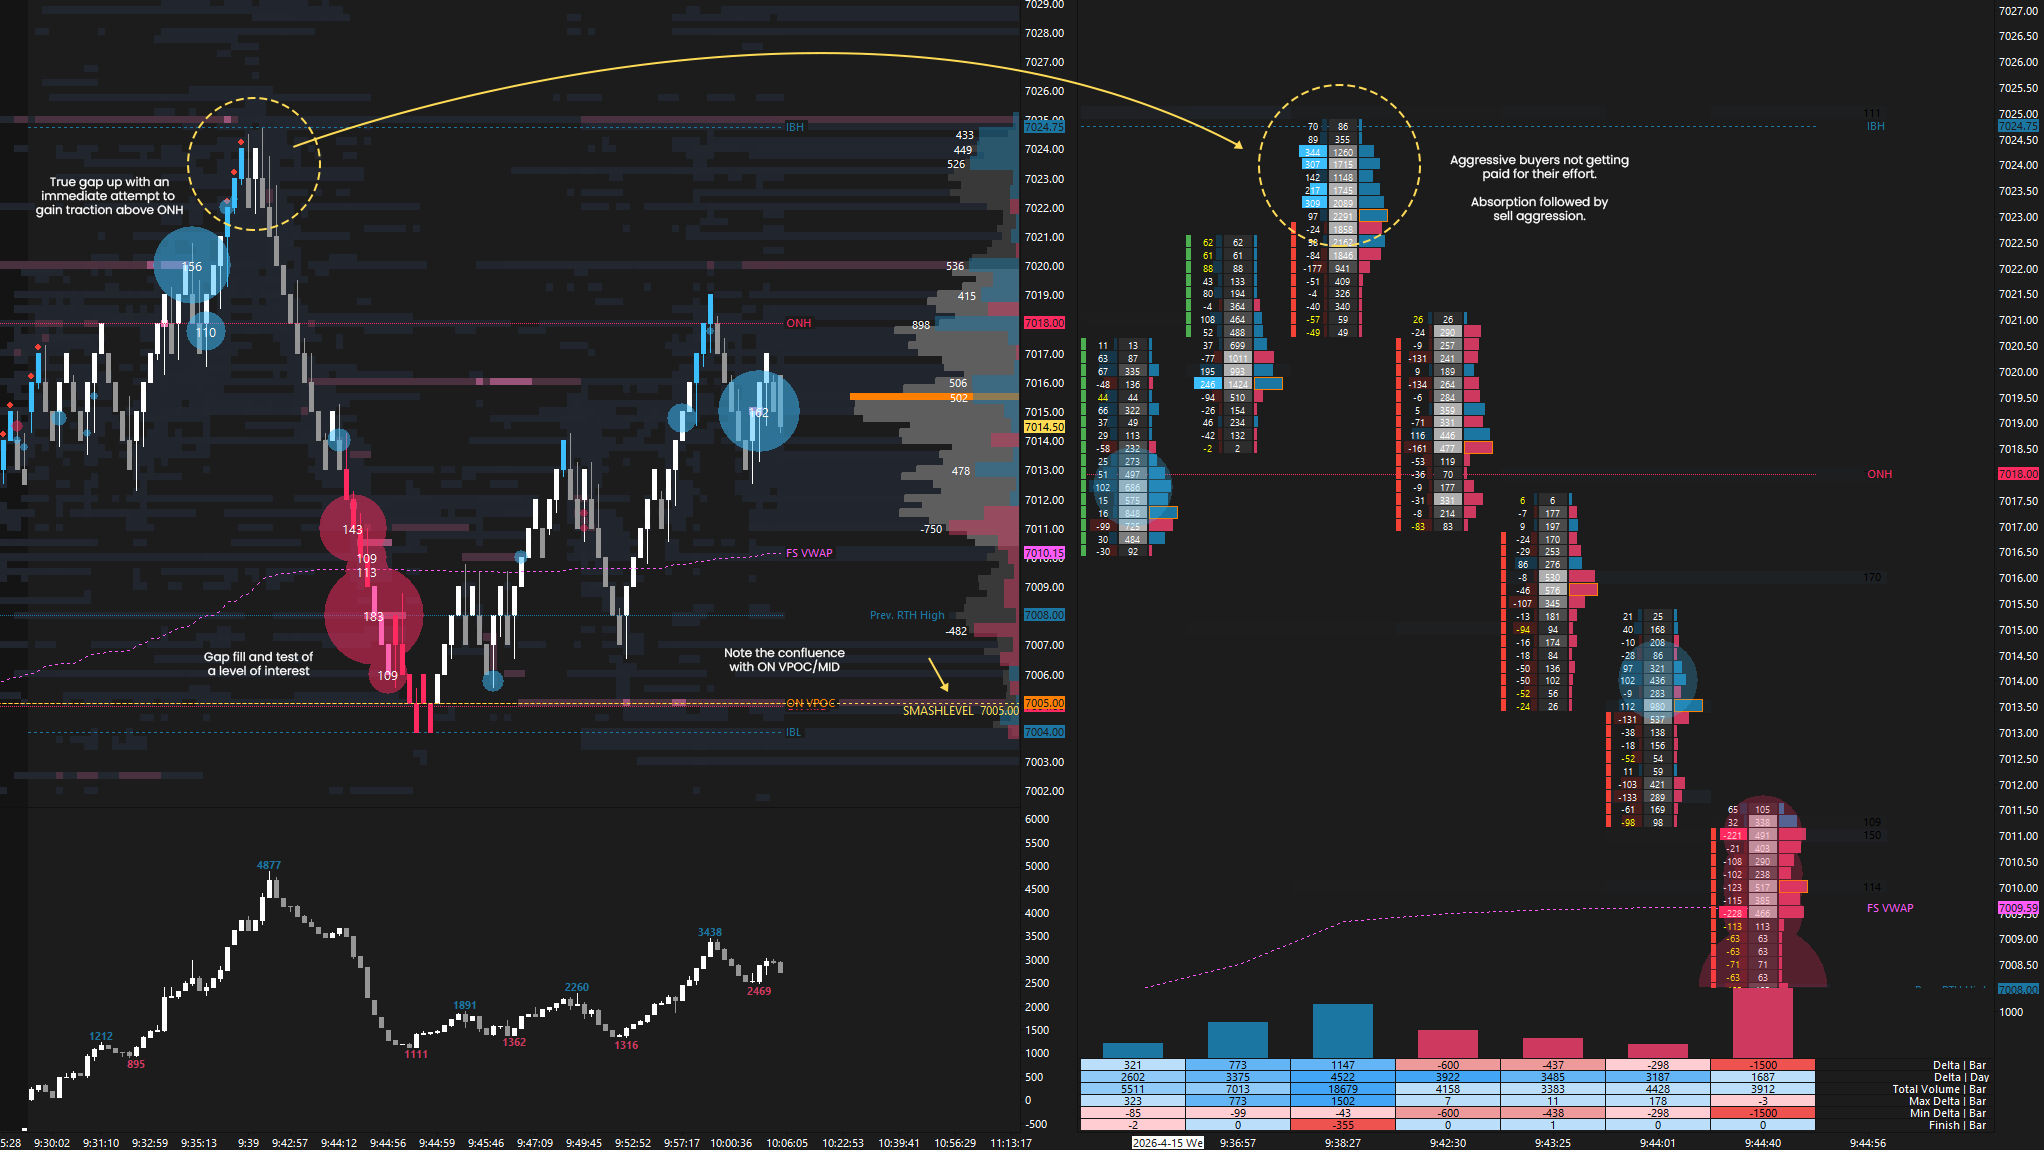
Wednesday also opened on a true gap up, but the gap was filled after a look above and fail of the overnight high (see Figure 1). A gap-fill reversal marked the low of the session. In the process, the prior multi-week balance area was fully traversed, the Weekly Extreme High was breached, and a new ATH printed, resolving the unfinished business at the prior ATH.
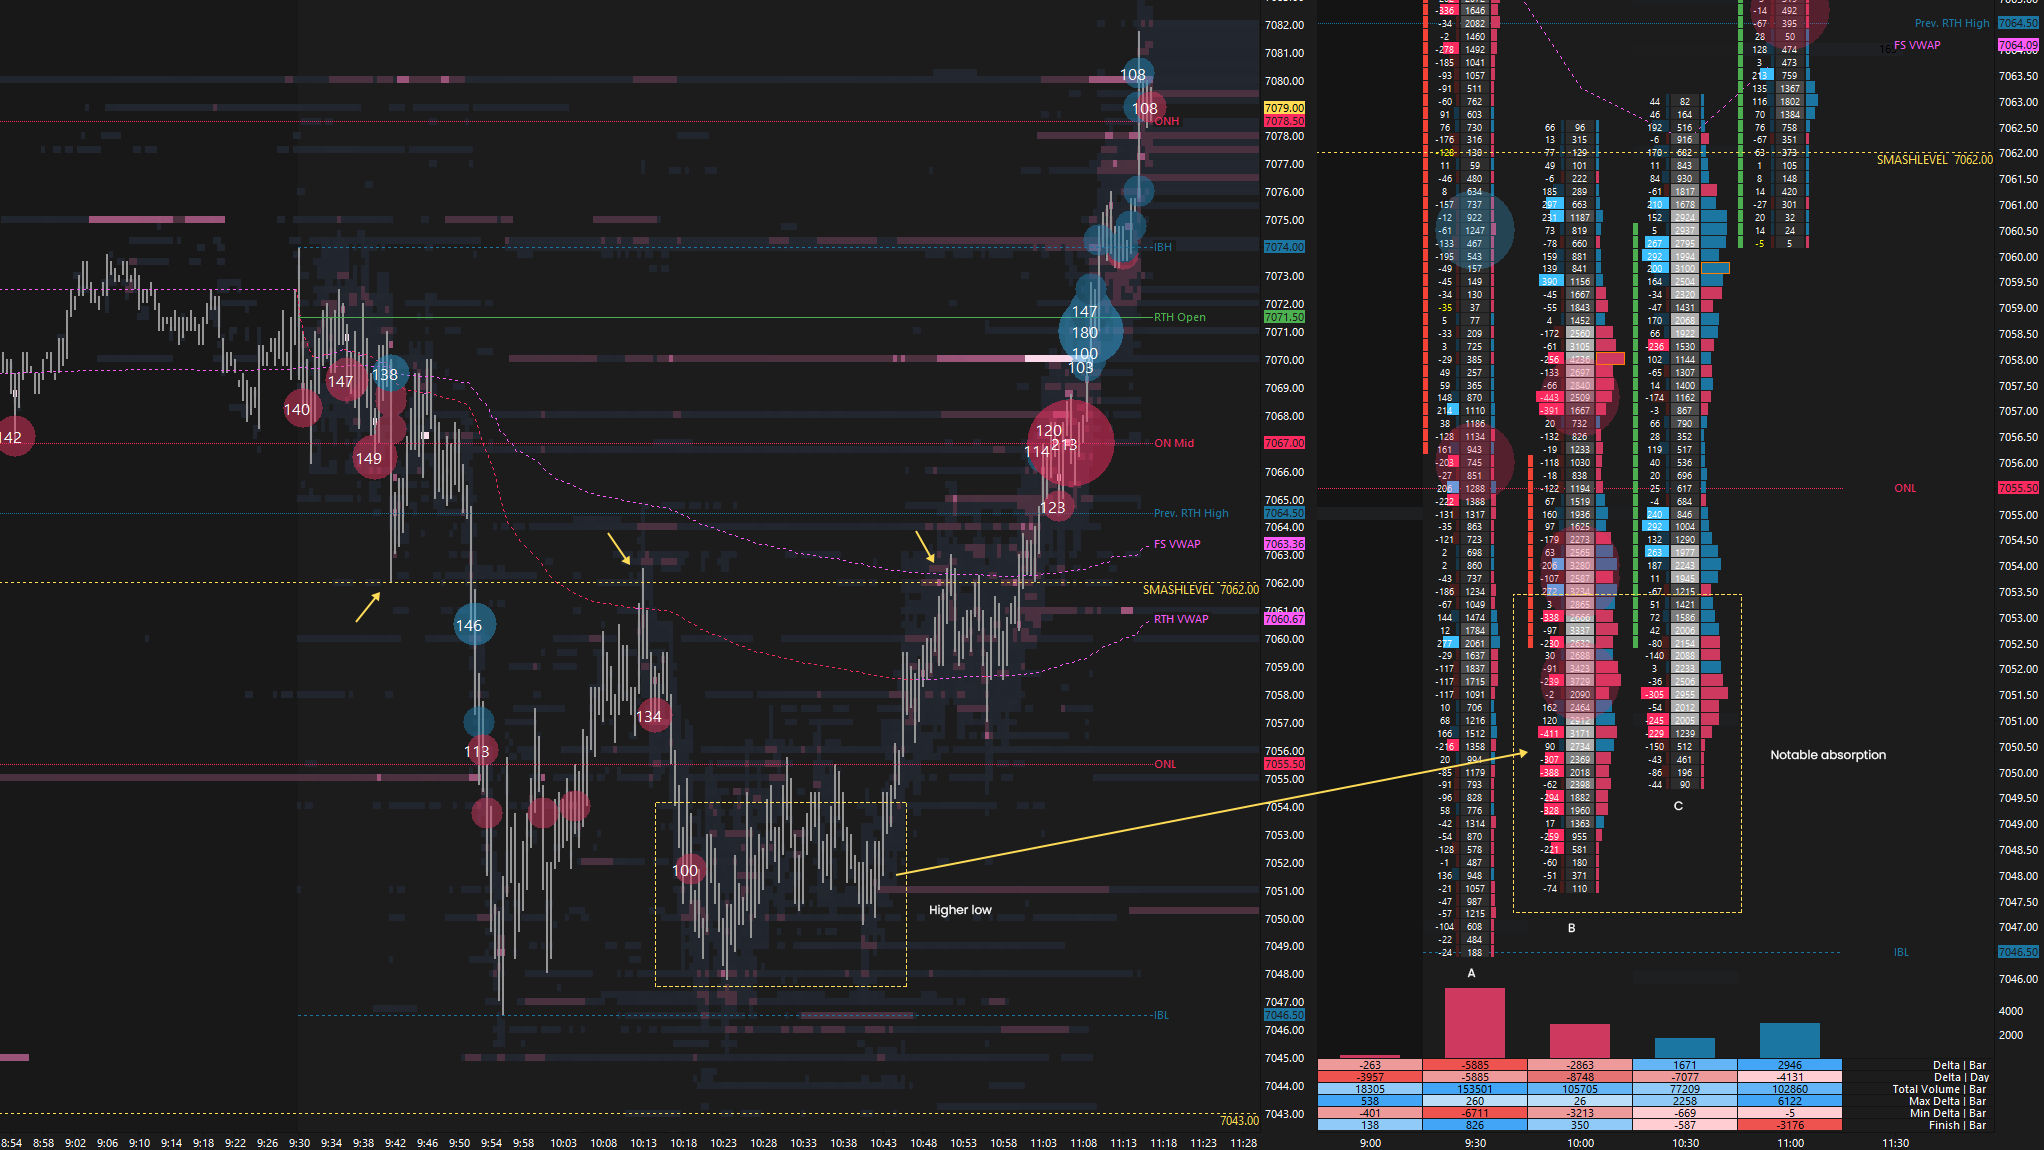
Thursday’s session saw another true gap up opening, and while the gap was also filled, aggressive sellers were unable to meaningfully shift the tone after being notably absorbed by passive buyers, resulting in a continuation higher (see Figure 2).
We closed out the week with another sustained true gap up on Friday, concluding one of the most one-sided weeks in quite some time. With buyers initiating a move away from the prior multi-week balance area, printing a new ATH, we now need to monitor for continuation (acceptance) or lack thereof (rejection). The prior ATH at 7031 is a critical area for buyers to defend.
Throughout the week, we discussed how the auction has moved significantly away from multiple value references, and that remains the case, making the risk-reward profile at the current location unfavorable for initiating new longs. Some corrective activity would be constructive, as it should provide better locations to monitor for reloading buyers. Stay nimble. An auction that shows no interest in filling poor structure is an extremely bullish one. As always, not chasing does not imply initiating a trade in the opposite direction; not trading is also a position.
Last Week’s Levels in Review
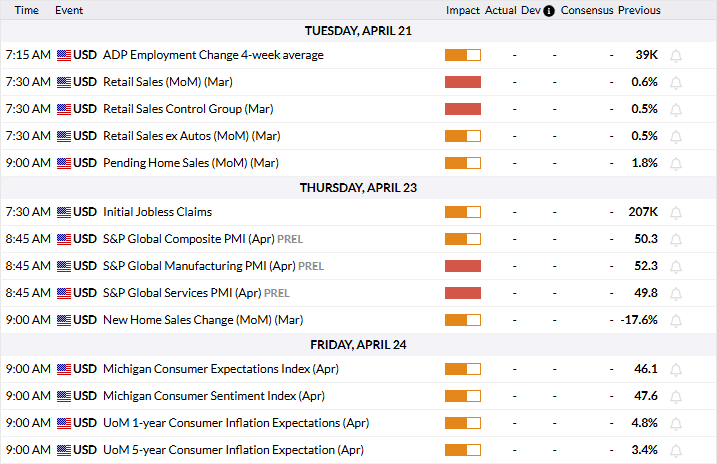
Economic & Earnings Calendar
Central Standard Time
Earnings Whispers
Market Structure
🟩 Daily: OTFU → Ends at: 7117
🟩 Weekly: OTFU → Ends at: 6826.50
🟨 Monthly: BALANCE → TBD
Balance: A market condition where price consolidates within a defined range, reflecting indecision as the market awaits more market-generated information. We apply balance guidelines—favoring fade trades at range extremes (highs/lows) and preparing for breakout setups if balance resolves.
One-Time Framing Up (OTFU): A market condition where each subsequent bar forms a higher low, signaling a strong upward trend.
One-Time Framing Down (OTFD): A market condition where each subsequent bar forms a lower high, signaling a strong downward trend.
Contextual Analysis & Plan
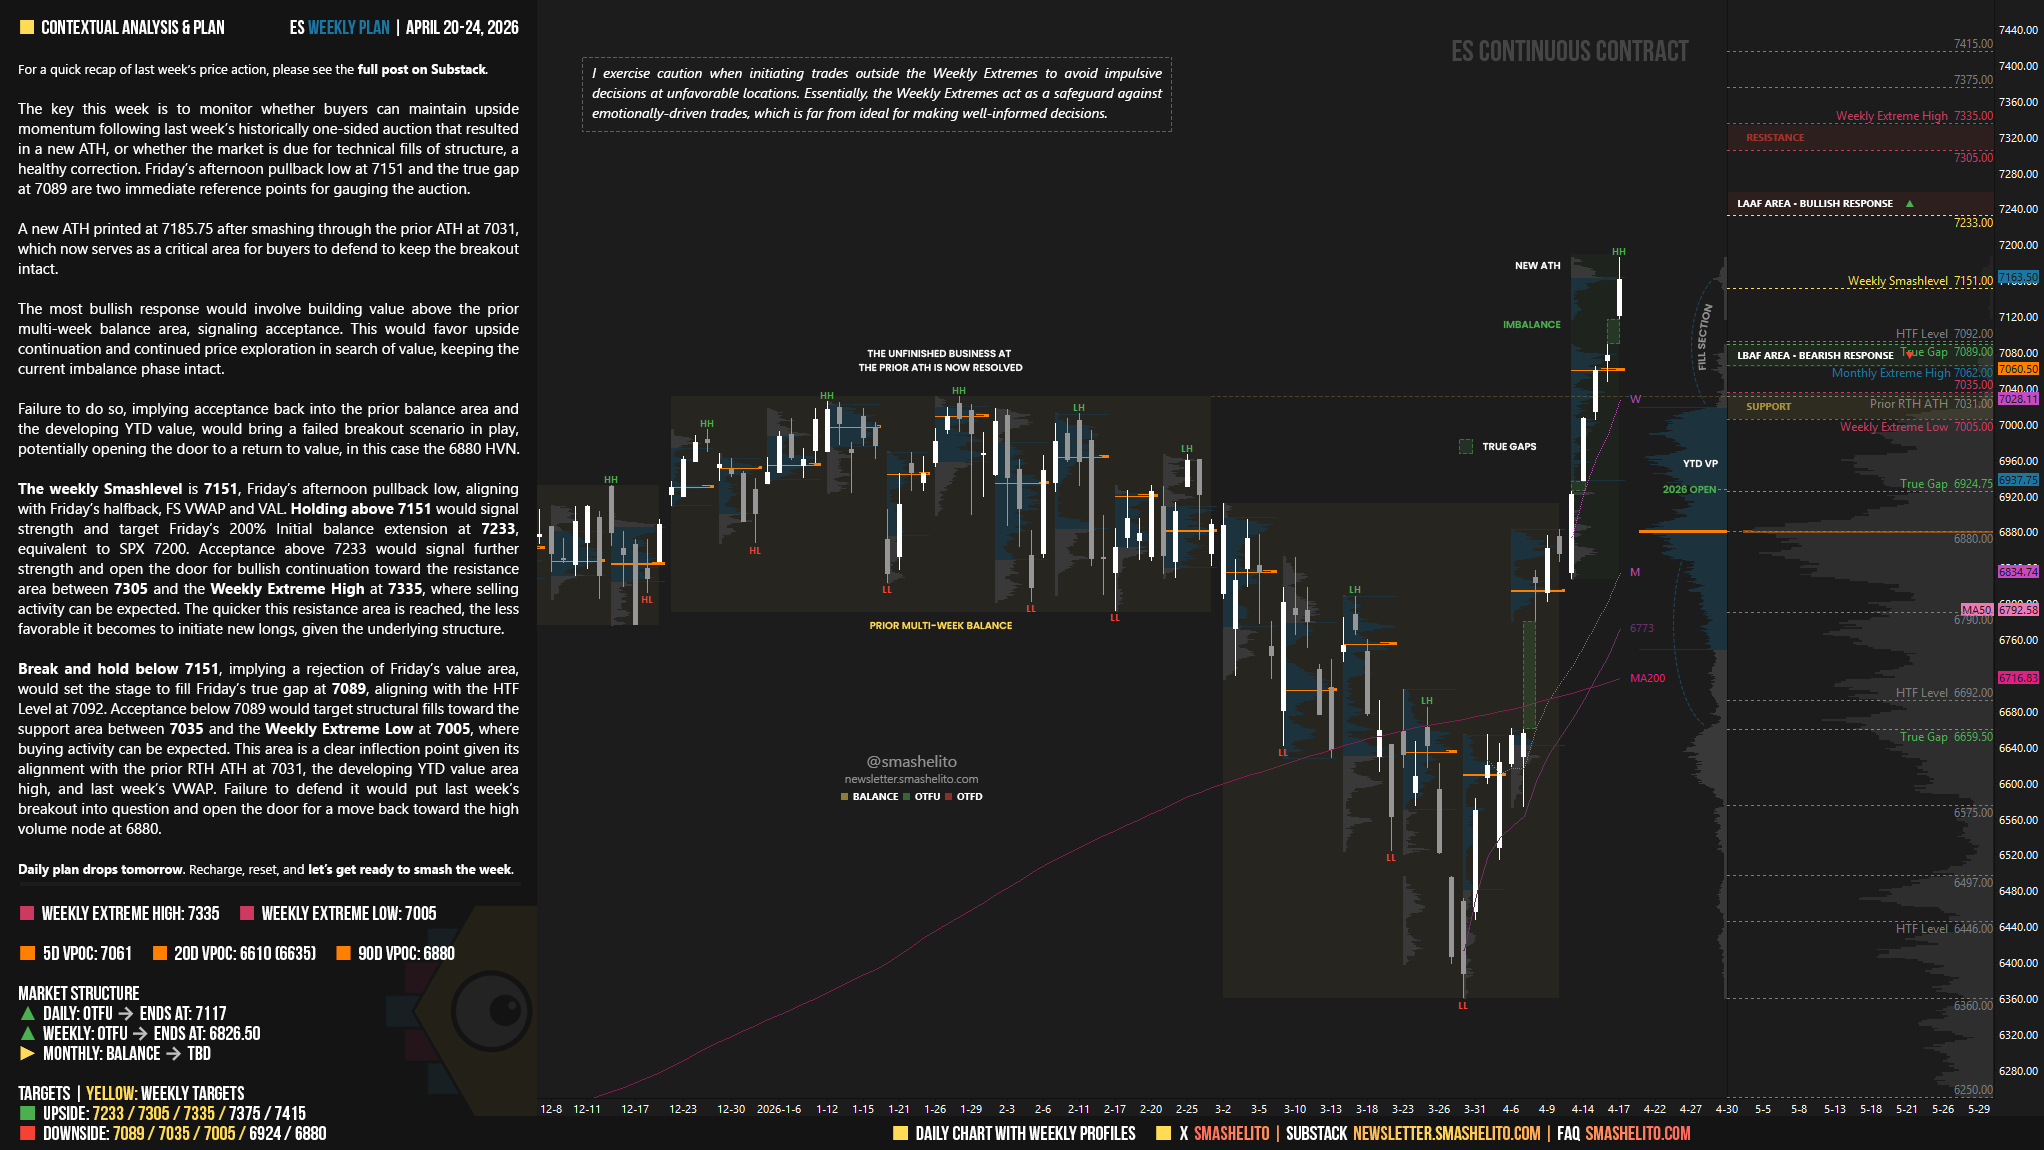
The key this week is to monitor whether buyers can maintain upside momentum following last week’s historically one-sided auction that resulted in a new ATH, or whether the market is due for technical fills of structure, a healthy correction. Friday’s afternoon pullback low at 7151 and the true gap at 7089 are two immediate reference points for gauging the auction.
A new ATH printed at 7185.75 after smashing through the prior ATH at 7031, which now serves as a critical area for buyers to defend to keep the breakout intact.
The most bullish response would involve building value above the prior multi-week balance area, signaling acceptance. This would favor upside continuation and continued price exploration in search of value, keeping the current imbalance phase intact.
Failure to do so, implying acceptance back into the prior balance area and the developing YTD value, would bring a failed breakout scenario in play, potentially opening the door to a return to value, in this case the 6880 HVN.
The weekly Smashlevel is 7151, Friday’s afternoon pullback low, aligning with Friday’s halfback, FS VWAP and VAL. Holding above 7151 would signal strength and target Friday’s 200% Initial balance extension at 7233, equivalent to SPX 7200. Acceptance above 7233 would signal further strength and open the door for bullish continuation toward the resistance area between 7305 and the Weekly Extreme High at 7335, where selling activity can be expected. The quicker this resistance area is reached, the less favorable it becomes to initiate new longs, given the underlying structure.
Break and hold below 7151, implying a rejection of Friday’s value area, would set the stage to fill Friday’s true gap at 7089, aligning with the HTF Level at 7092. Acceptance below 7089 would target structural fills toward the support area between 7035 and the Weekly Extreme Low at 7005, where buying activity can be expected. This area is a clear inflection point given its alignment with the prior RTH ATH at 7031, the developing YTD value area high, and last week’s VWAP. Failure to defend it would put last week’s breakout into question and open the door for a move back toward the high volume node at 6880.
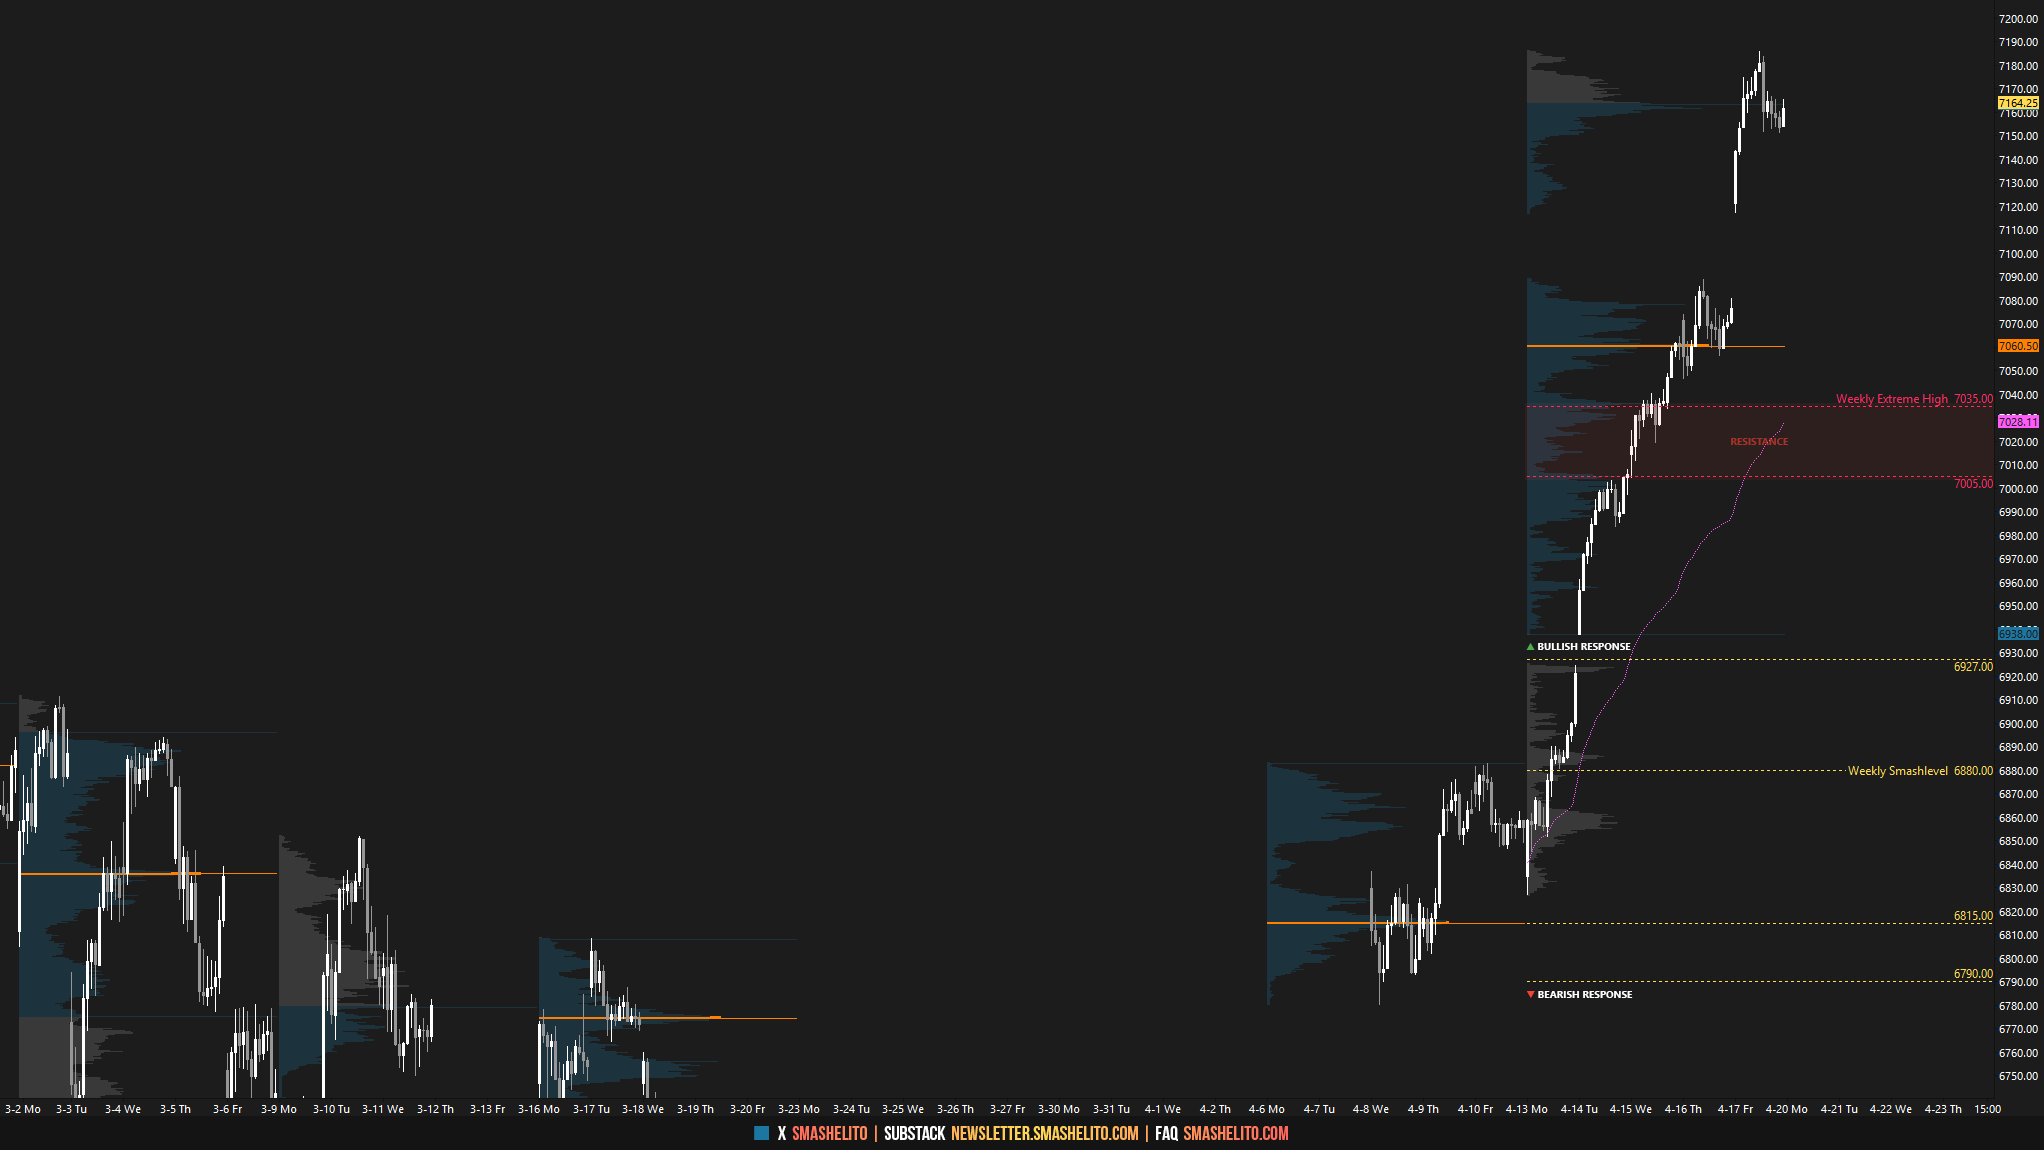
Visual Representation
Key Levels of Interest
In the upcoming week, I will closely observe the behavior around 7151.
Holding above 7151 would target 7233 / 7305 / 7335* / 7375 / 7415
Break and hold below 7151 would target 7089 / 7035 / 7005* / 6924 / 6880
*Weekly Extremes (defined by proprietary models). I exercise caution when initiating trades outside the Weekly Extremes to avoid impulsive decisions at unfavorable locations. Essentially, the Weekly Extremes act as a safeguard against emotionally-driven trades, which is far from ideal for making well-informed decisions.
Daily plan drops tomorrow. Recharge, reset, and let’s get ready to smash the week.
Thanks Smash, Awesome read as always 😊
Thanks Smash! Great work as always.