
ES Daily Plan | September 8, 2025
Market Context & Key Levels for the Day Ahead

— For new subscribers
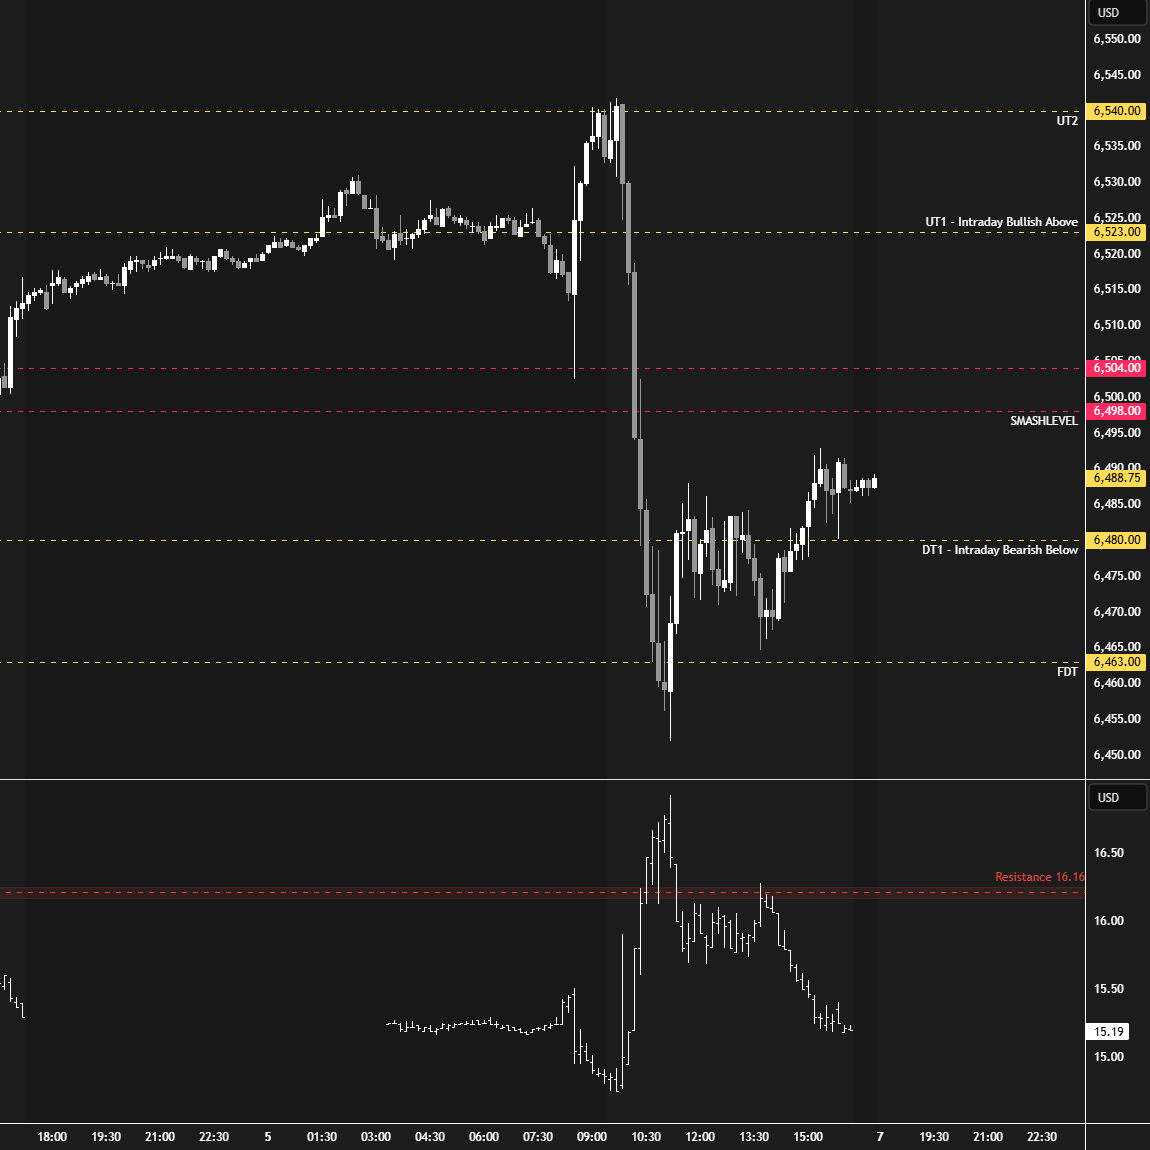
The yellow levels highlighted at the bottom left of the chart are the primary intraday levels I focus on. To avoid impulsive decisions at poor trade locations, I follow a simple but effective rule: exercise caution when initiating trades outside of these yellow levels.
This means I’m cautious about chasing longs above the Final Upside Target (FUT) and shorts below the Final Downside Target (FDT). It’s important to understand that not chasing does not imply initiating a trade in the opposite direction — discipline over impulse.
Be sure to review the ES Weekly Plan | September 8-12, 2025 for a broader perspective, key levels, and market expectations for the week ahead.
Contextual Analysis & Plan
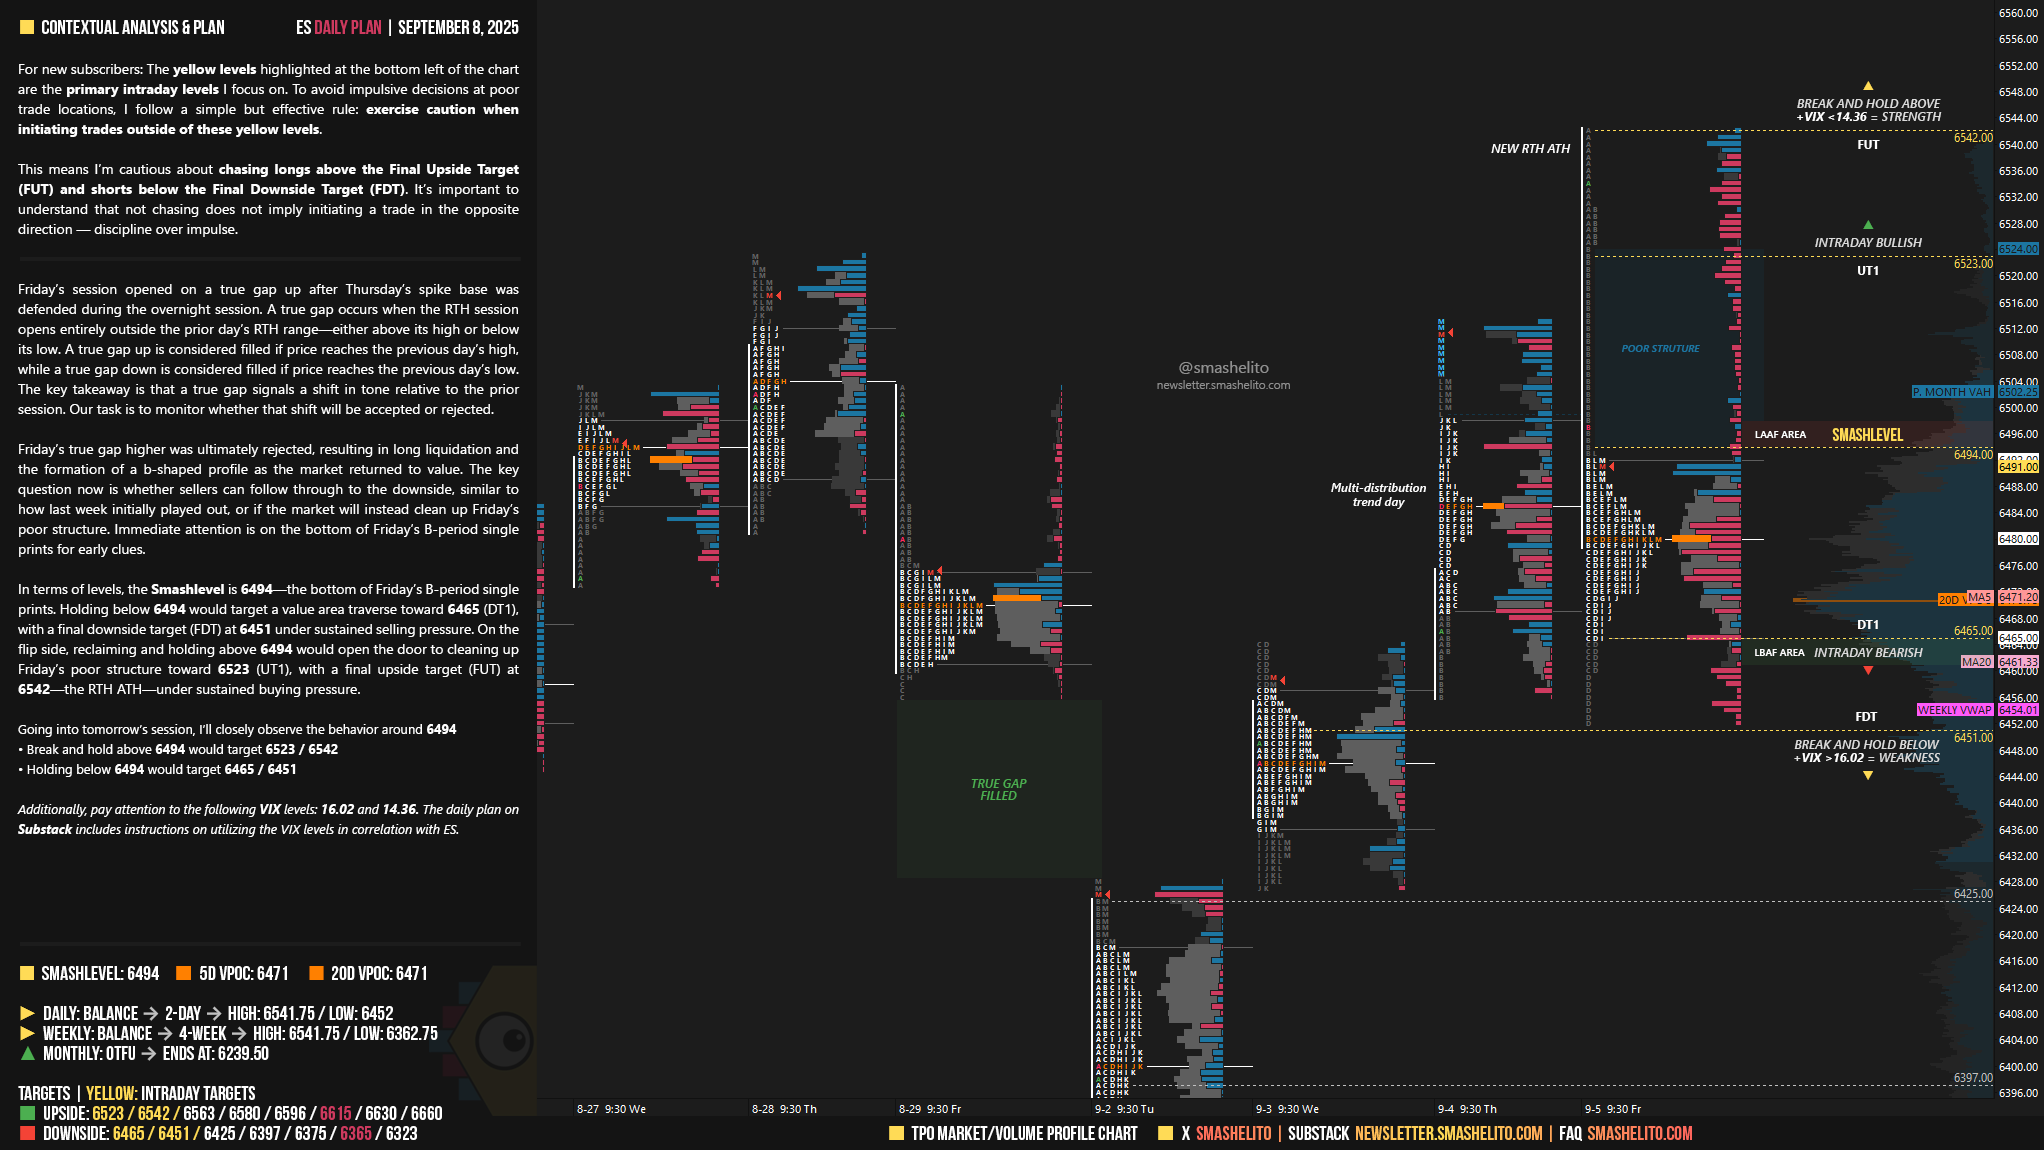
Friday’s session opened on a true gap up after Thursday’s spike base was defended during the overnight session. A true gap occurs when the RTH session opens entirely outside the prior day’s RTH range—either above its high or below its low. A true gap up is considered filled if price reaches the previous day’s high, while a true gap down is considered filled if price reaches the previous day’s low. The key takeaway is that a true gap signals a shift in tone relative to the prior session. Our task is to monitor whether that shift will be accepted or rejected.
Friday’s true gap higher was ultimately rejected, resulting in long liquidation and the formation of a b-shaped profile as the market returned to value. The key question now is whether sellers can follow through to the downside, similar to how last week initially played out, or if the market will instead clean up Friday’s poor structure. Immediate attention is on the bottom of Friday’s B-period single prints for early clues.
Levels of Interest
Going into tomorrow’s session, I’ll closely observe the behavior around 6494.
Break and hold above 6494 would target 6523 / 6542
Holding below 6494 would target 6465 / 6451
Additionally, pay attention to the following VIX levels: 16.02 and 14.36. These levels can provide confirmation of strength or weakness.
Break and hold above 6542 with VIX below 14.36 would confirm strength.
Break and hold below 6451 with VIX above 16.02 would confirm weakness.
Overall, it's important to exercise caution when trading outside of the highlighted yellow levels. A non-cooperative VIX may suggest possible reversals i.e trade setups.
Thanks!