
ES Daily Plan | September 29, 2025
Market Context & Key Levels for the Day Ahead

— For new subscribers
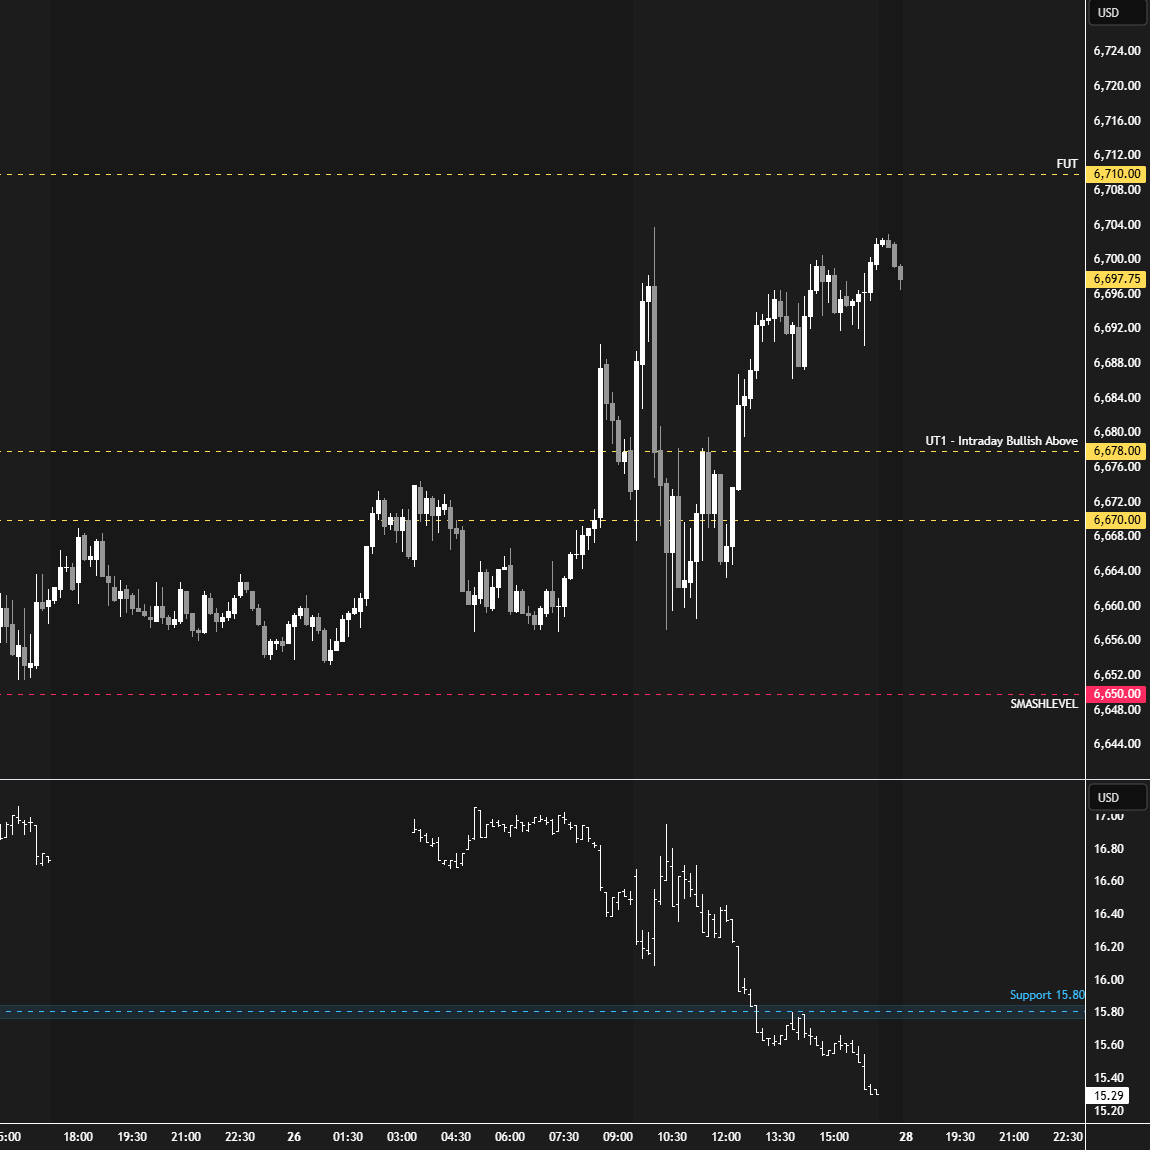
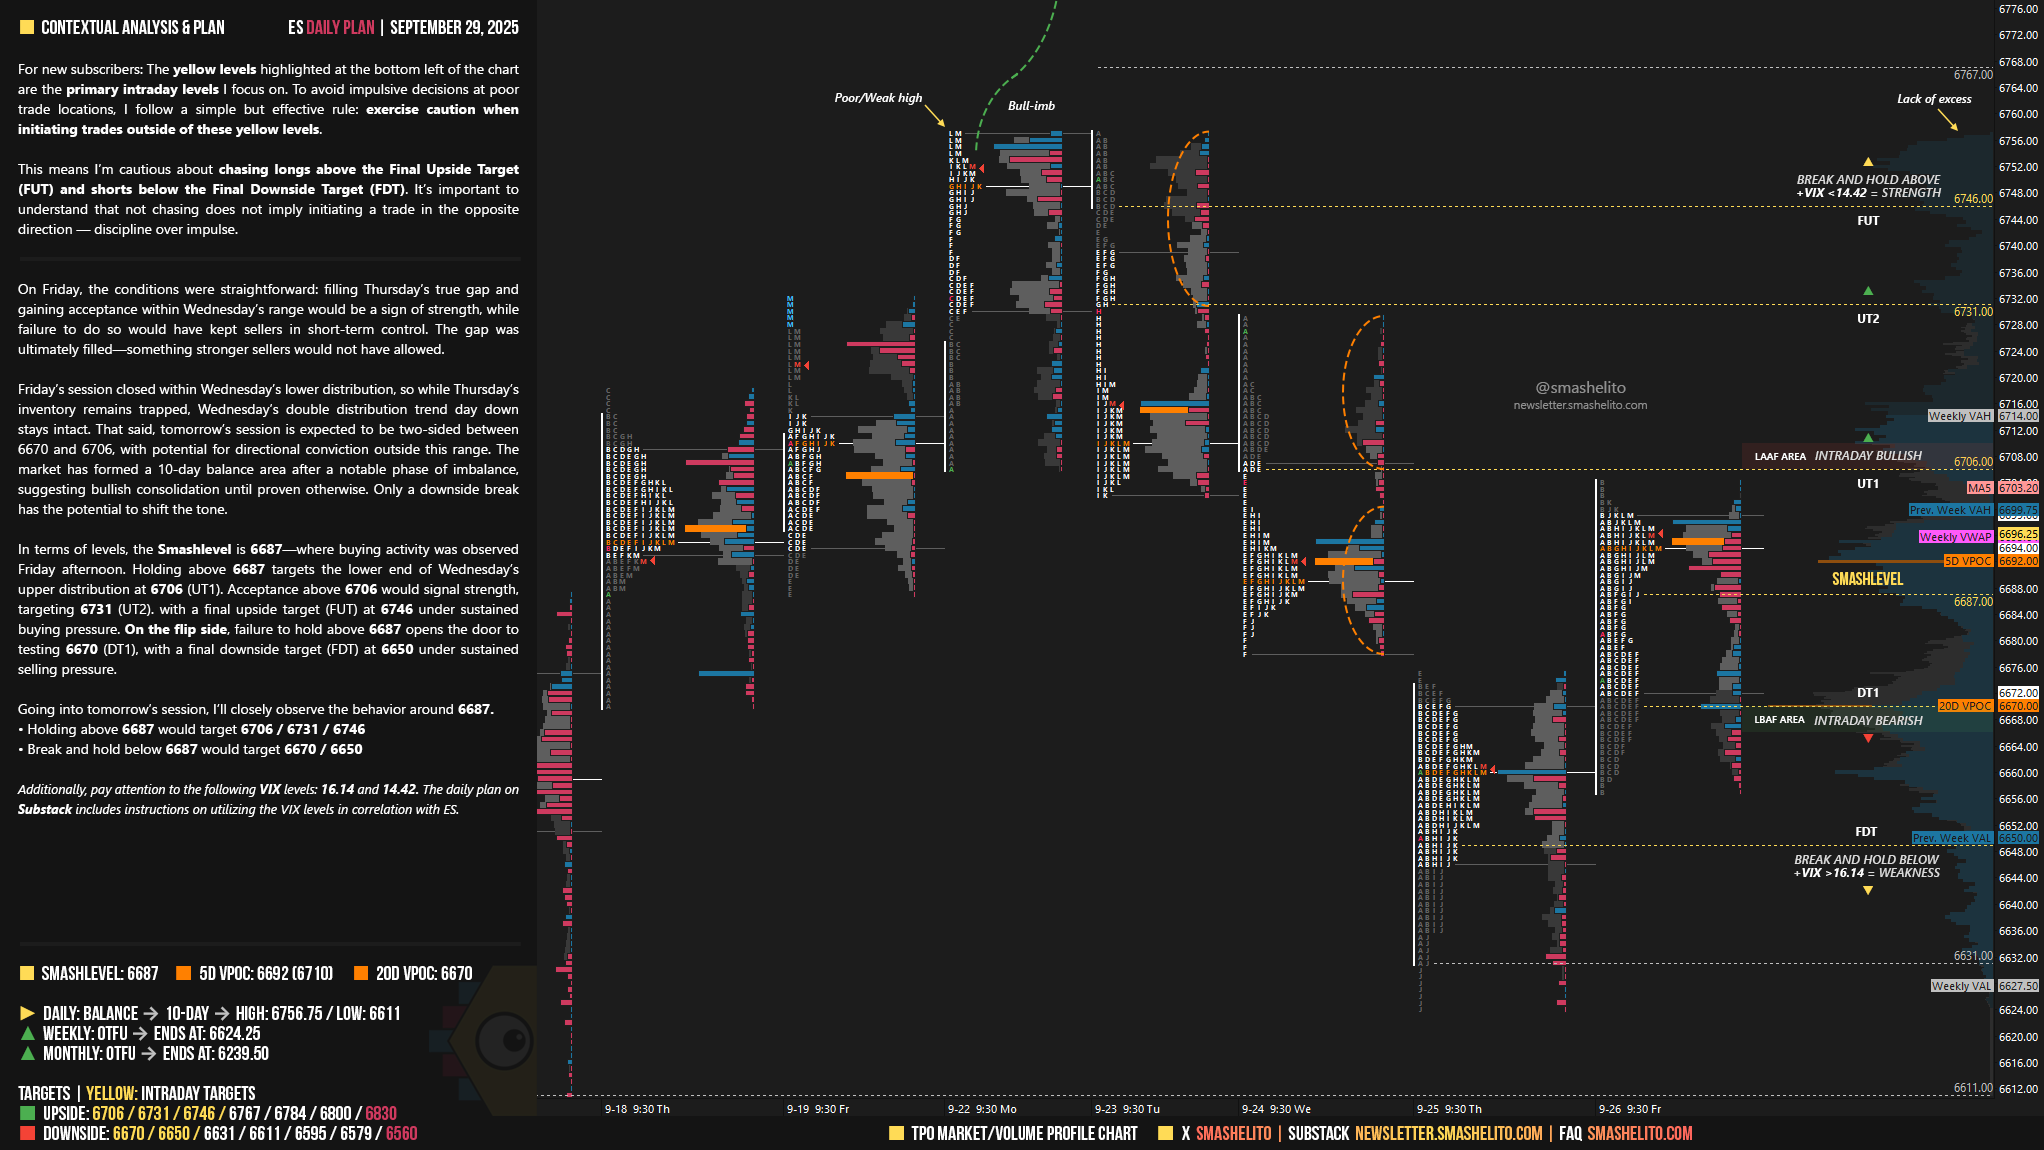
The yellow levels highlighted at the bottom left of the chart are the primary intraday levels I focus on. To avoid impulsive decisions at poor trade locations, I follow a simple but effective rule: exercise caution when initiating trades outside of these yellow levels.
This means I’m cautious about chasing longs above the Final Upside Target (FUT) and shorts below the Final Downside Target (FDT). It’s important to understand that not chasing does not imply initiating a trade in the opposite direction — discipline over impulse.
Be sure to review the ES Weekly Plan | Sep 29 - Oct 3, 2025 for a broader perspective, key levels, and market expectations for the week ahead.
Contextual Analysis & Plan
On Friday, the conditions were straightforward: filling Thursday’s true gap and gaining acceptance within Wednesday’s range would be a sign of strength, while failure to do so would have kept sellers in short-term control. The gap was ultimately filled—something stronger sellers would not have allowed.
Friday’s session closed within Wednesday’s lower distribution, so while Thursday’s inventory remains trapped, Wednesday’s double distribution trend day down stays intact. That said, tomorrow’s session is expected to be two-sided between 6670 and 6706, with potential for directional conviction outside this range. The market has formed a 10-day balance area after a notable phase of imbalance, suggesting bullish consolidation until proven otherwise. Only a downside break has the potential to shift the tone.
In terms of levels, the Smashlevel is 6687—where buying activity was observed Friday afternoon. Holding above 6687 targets the lower end of Wednesday’s upper distribution at 6706 (UT1). Acceptance above 6706 would signal strength, targeting 6731 (UT2). with a final upside target (FUT) at 6746 under sustained buying pressure.
On the flip side, failure to hold above 6687 opens the door to testing 6670 (DT1), with a final downside target (FDT) at 6650 under sustained selling pressure.
Levels of Interest
Going into tomorrow’s session, I’ll closely observe the behavior around 6687.
Holding above 6687 would target 6706 / 6731 / 6746
Break and hold below 6687 would target 6670 / 6650
Additionally, pay attention to the following VIX levels: 16.14 and 14.42. These levels can provide confirmation of strength or weakness.
Break and hold above 6746 with VIX below 14.42 would confirm strength.
Break and hold below 6650 with VIX above 16.14 would confirm weakness.
Overall, it's important to exercise caution when trading outside of the highlighted yellow levels. A non-cooperative VIX may suggest possible reversals i.e trade setups.
Shutdown, JPM collar and month end is on the horizon
Thank smash! Could you clarify what you mean by two sided