
ES Daily Plan | September 25, 2025
Market Context & Key Levels for the Day Ahead

— For new subscribers
The yellow levels highlighted at the bottom left of the chart are the primary intraday levels I focus on. To avoid impulsive decisions at poor trade locations, I follow a simple but effective rule: exercise caution when initiating trades outside of these yellow levels.
This means I’m cautious about chasing longs above the Final Upside Target (FUT) and shorts below the Final Downside Target (FDT). It’s important to understand that not chasing does not imply initiating a trade in the opposite direction — discipline over impulse.
Be sure to review the ES Weekly Plan | September 22-26, 2025 for a broader perspective, key levels, and market expectations for the week ahead.
Contextual Analysis & Plan
Another quick update today—I’m still a bit under the weather.
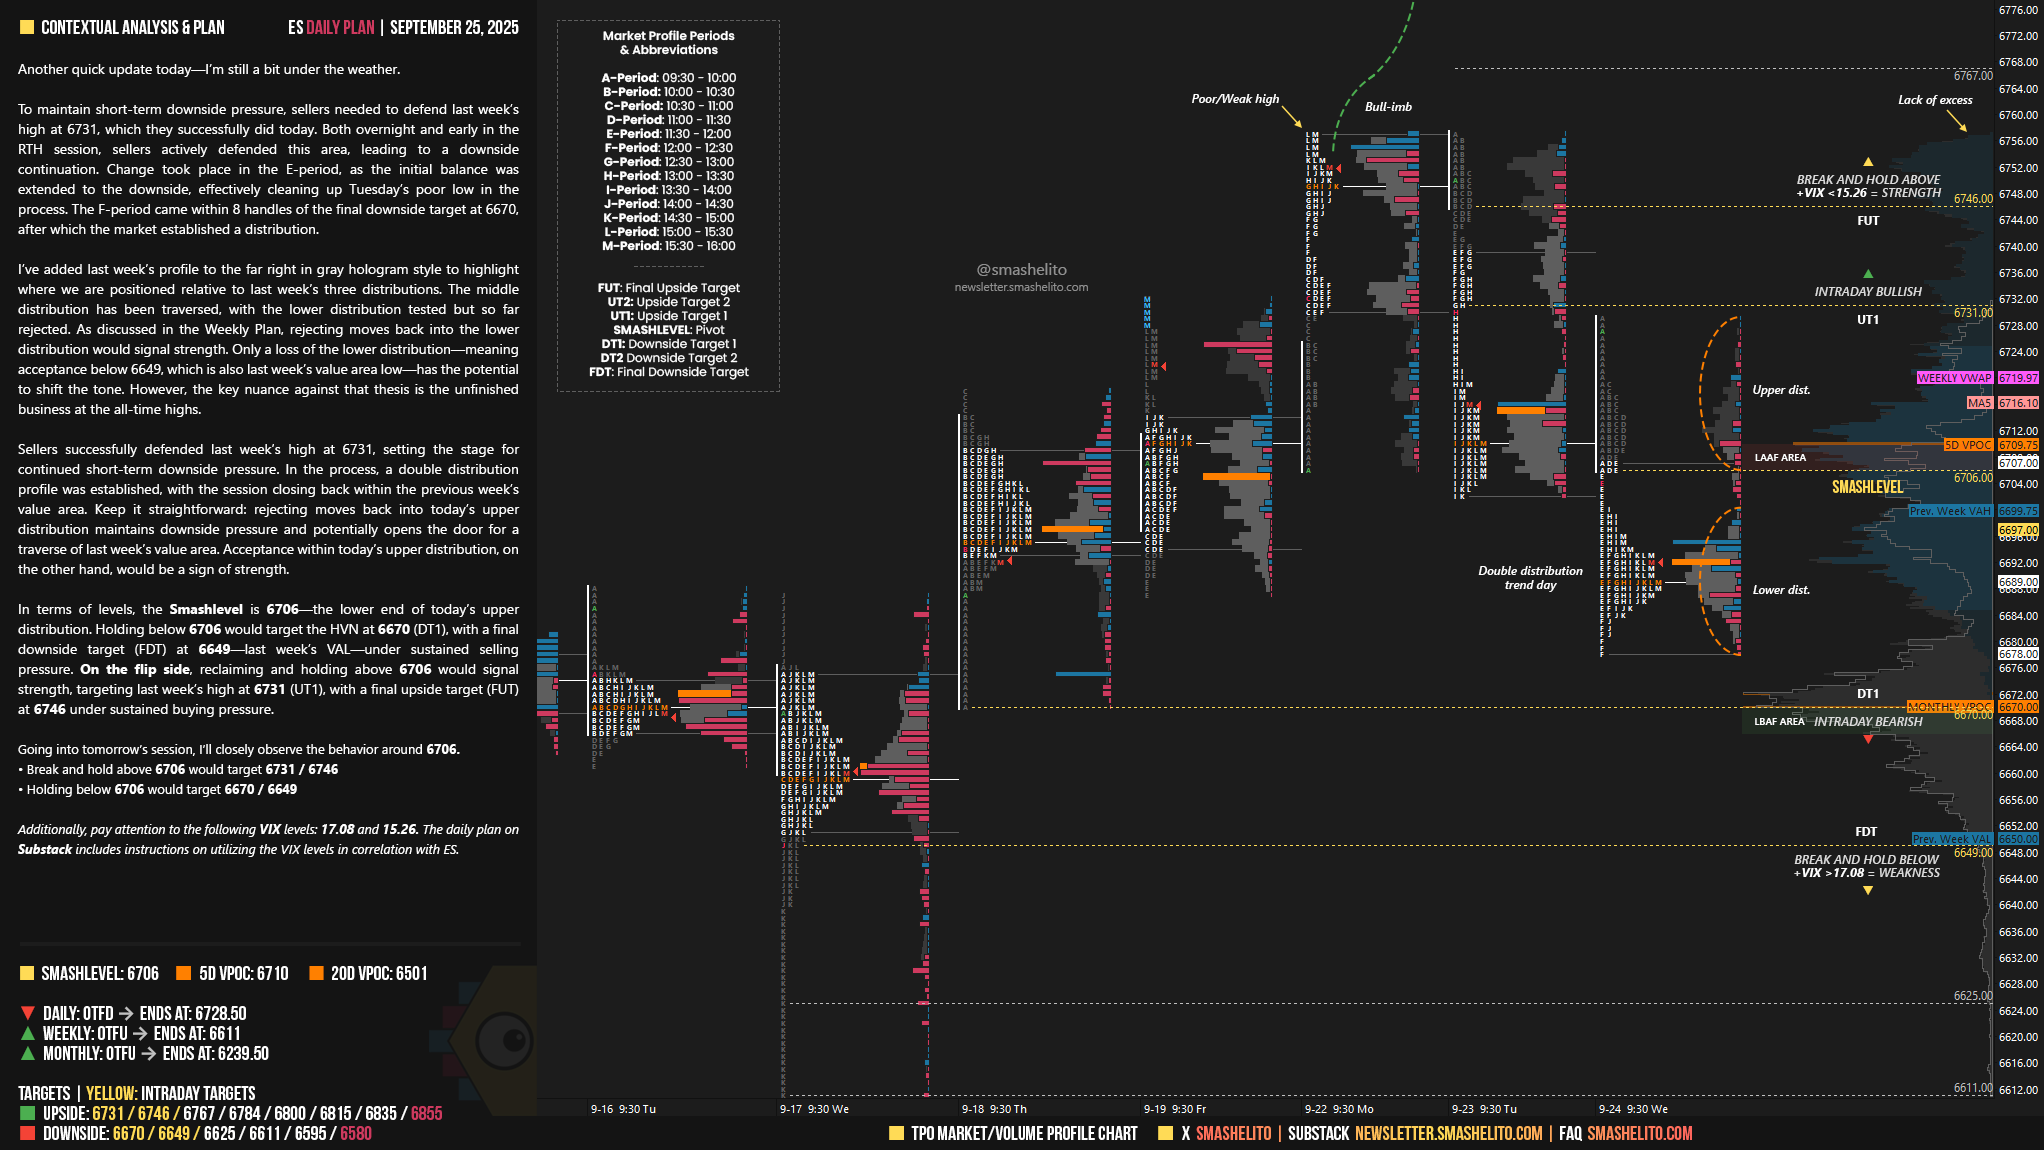
To maintain short-term downside pressure, sellers needed to defend last week’s high at 6731, which they successfully did today. Both overnight and early in the RTH session, sellers actively defended this area, leading to a downside continuation. Change took place in the E-period, as the initial balance was extended to the downside, effectively cleaning up Tuesday’s poor low in the process. The F-period came within 8 handles of the final downside target at 6670, after which the market established a distribution.
I’ve added last week’s profile to the far right in gray hologram style to highlight where we are positioned relative to last week’s three distributions. The middle distribution has been traversed, with the lower distribution tested but so far rejected. As discussed in the Weekly Plan, rejecting moves back into the lower distribution would signal strength. Only a loss of the lower distribution—meaning acceptance below 6649, which is also last week’s value area low—has the potential to shift the tone. However, the key nuance against that thesis is the unfinished business at the all-time highs.
Sellers successfully defended last week’s high at 6731, setting the stage for continued short-term downside pressure. In the process, a double distribution profile was established, with the session closing back within the previous week’s value area. Keep it straightforward: rejecting moves back into today’s upper distribution maintains downside pressure and potentially opens the door for a traverse of last week’s value area. Acceptance within today’s upper distribution, on the other hand, would be a sign of strength.
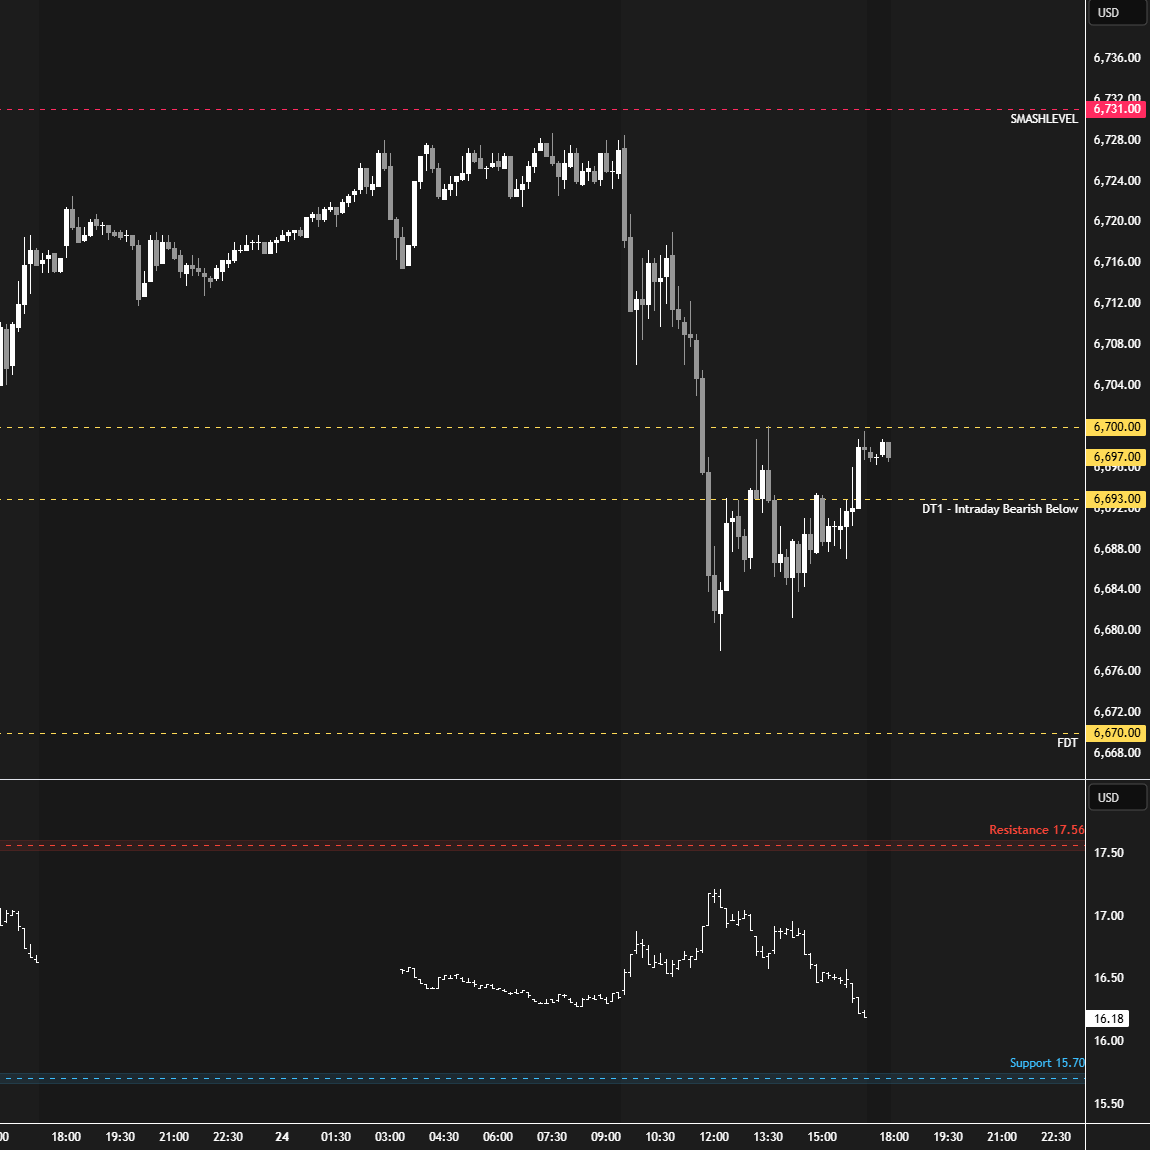
In terms of levels, the Smashlevel is 6706—the lower end of today’s upper distribution. Holding below 6706 would target the HVN at 6670 (DT1), with a final downside target (FDT) at 6649—last week’s VAL—under sustained selling pressure.
On the flip side, reclaiming and holding above 6706 would signal strength, targeting last week’s high at 6731 (UT1), with a final upside target (FUT) at 6746 under sustained buying pressure.
Levels of Interest
Going into tomorrow’s session, I’ll closely observe the behavior around 6706.
Break and hold above 6706 would target 6731 / 6746
Holding below 6706 would target 6670 / 6649
Additionally, pay attention to the following VIX levels: 17.08 and 15.26. These levels can provide confirmation of strength or weakness.
Break and hold above 6746 with VIX below 15.26 would confirm strength.
Break and hold below 6649 with VIX above 17.08 would confirm weakness.
Overall, it's important to exercise caution when trading outside of the highlighted yellow levels. A non-cooperative VIX may suggest possible reversals i.e trade setups.
Appreciate this, Smash!
thank you!