
ES Daily Plan | September 24, 2025
Market Context & Key Levels for the Day Ahead

— For new subscribers
The yellow levels highlighted at the bottom left of the chart are the primary intraday levels I focus on. To avoid impulsive decisions at poor trade locations, I follow a simple but effective rule: exercise caution when initiating trades outside of these yellow levels.
This means I’m cautious about chasing longs above the Final Upside Target (FUT) and shorts below the Final Downside Target (FDT). It’s important to understand that not chasing does not imply initiating a trade in the opposite direction — discipline over impulse.
Be sure to review the ES Weekly Plan | September 22-26, 2025 for a broader perspective, key levels, and market expectations for the week ahead.
Contextual Analysis & Plan
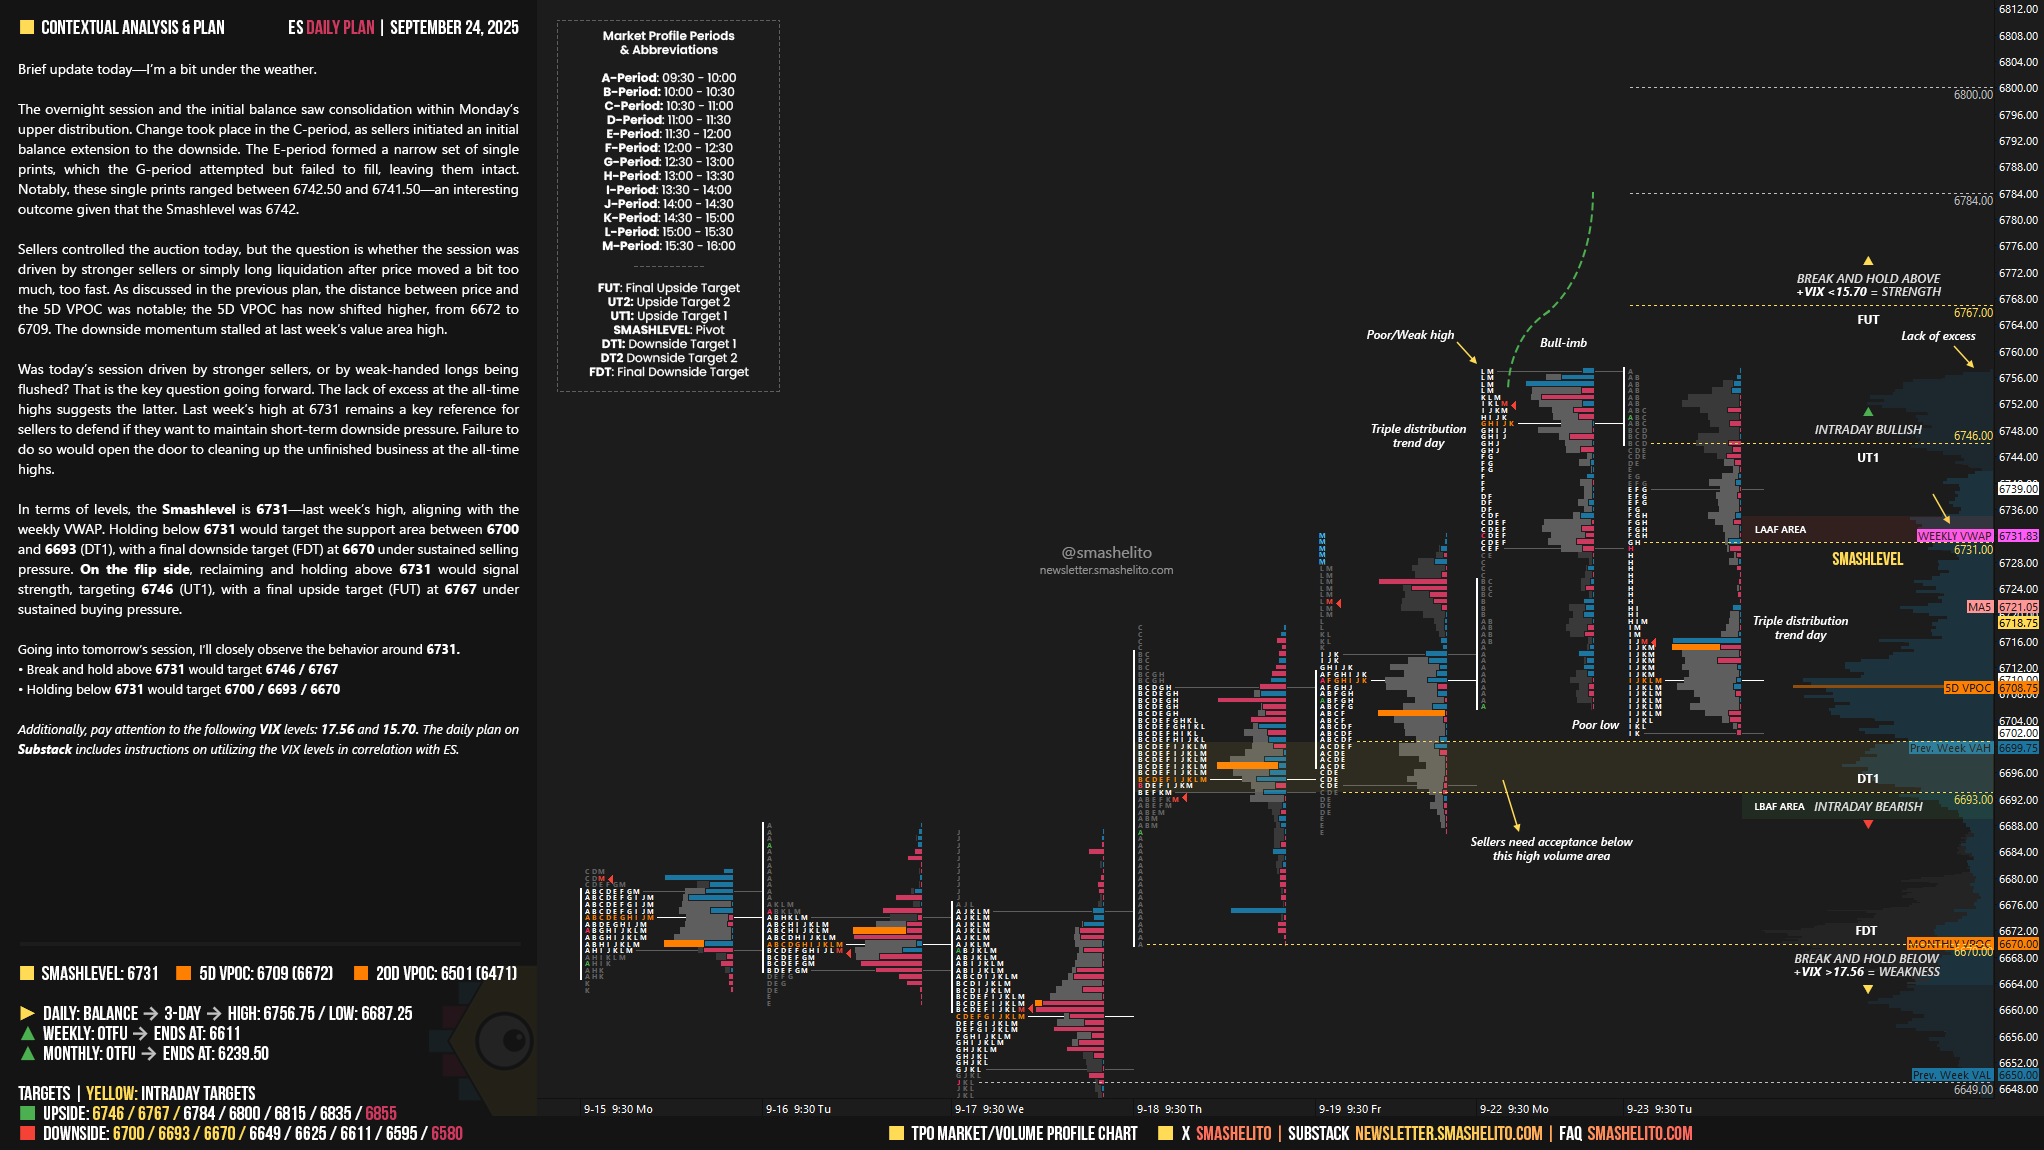
Brief update today—I’m a bit under the weather.
The overnight session and the initial balance saw consolidation within Monday’s upper distribution. Change took place in the C-period, as sellers initiated an initial balance extension to the downside. The E-period formed a narrow set of single prints, which the G-period attempted but failed to fill, leaving them intact. Notably, these single prints ranged between 6742.50 and 6741.50—an interesting outcome given that the Smashlevel was 6742.
Sellers controlled the auction today, but the question is whether the session was driven by stronger sellers or simply long liquidation after price moved a bit too much, too fast. As discussed in the previous plan, the distance between price and the 5D VPOC was notable; the 5D VPOC has now shifted higher, from 6672 to 6709. The downside momentum stalled at last week’s value area high.
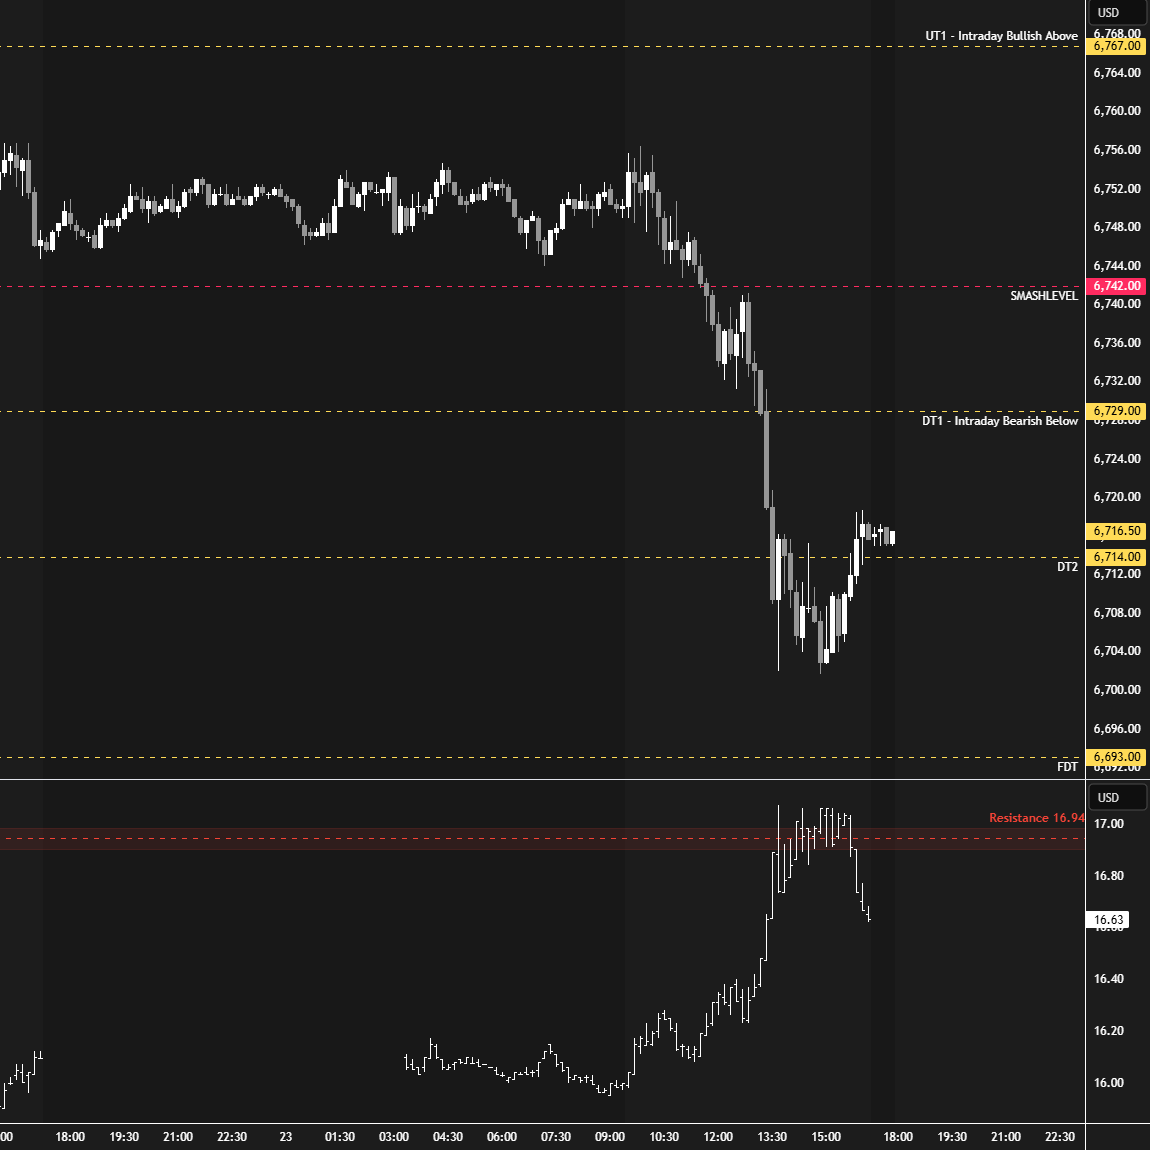
Was today’s session driven by stronger sellers, or by weak-handed longs being flushed? That is the key question going forward. The lack of excess at the all-time highs suggests the latter. Last week’s high at 6731 remains a key reference for sellers to defend if they want to maintain short-term downside pressure. Failure to do so would open the door to cleaning up the unfinished business at the all-time highs.
In terms of levels, the Smashlevel is 6731—last week’s high, aligning with the weekly VWAP. Holding below 6731 would target the support area between 6700 and 6693 (DT1), with a final downside target (FDT) at 6670 under sustained selling pressure.
On the flip side, reclaiming and holding above 6731 would signal strength, targeting 6746 (UT1), with a final upside target (FUT) at 6767 under sustained buying pressure.
Levels of Interest
Going into tomorrow’s session, I’ll closely observe the behavior around 6731.
Break and hold above 6731 would target 6746 / 6767
Holding below 6731 would target 6700 / 6693 / 6670
Additionally, pay attention to the following VIX levels: 17.56 and 15.70. These levels can provide confirmation of strength or weakness.
Break and hold above 6767 with VIX below 15.70 would confirm strength.
Break and hold below 6670 with VIX above 17.56 would confirm weakness.
Overall, it's important to exercise caution when trading outside of the highlighted yellow levels. A non-cooperative VIX may suggest possible reversals i.e trade setups.
Hope you feel better soon boss❤️❤️❤️🫂
Thanks, and better health to you!