
ES Daily Plan | September 22, 2025
Market Context & Key Levels for the Day Ahead

— For new subscribers
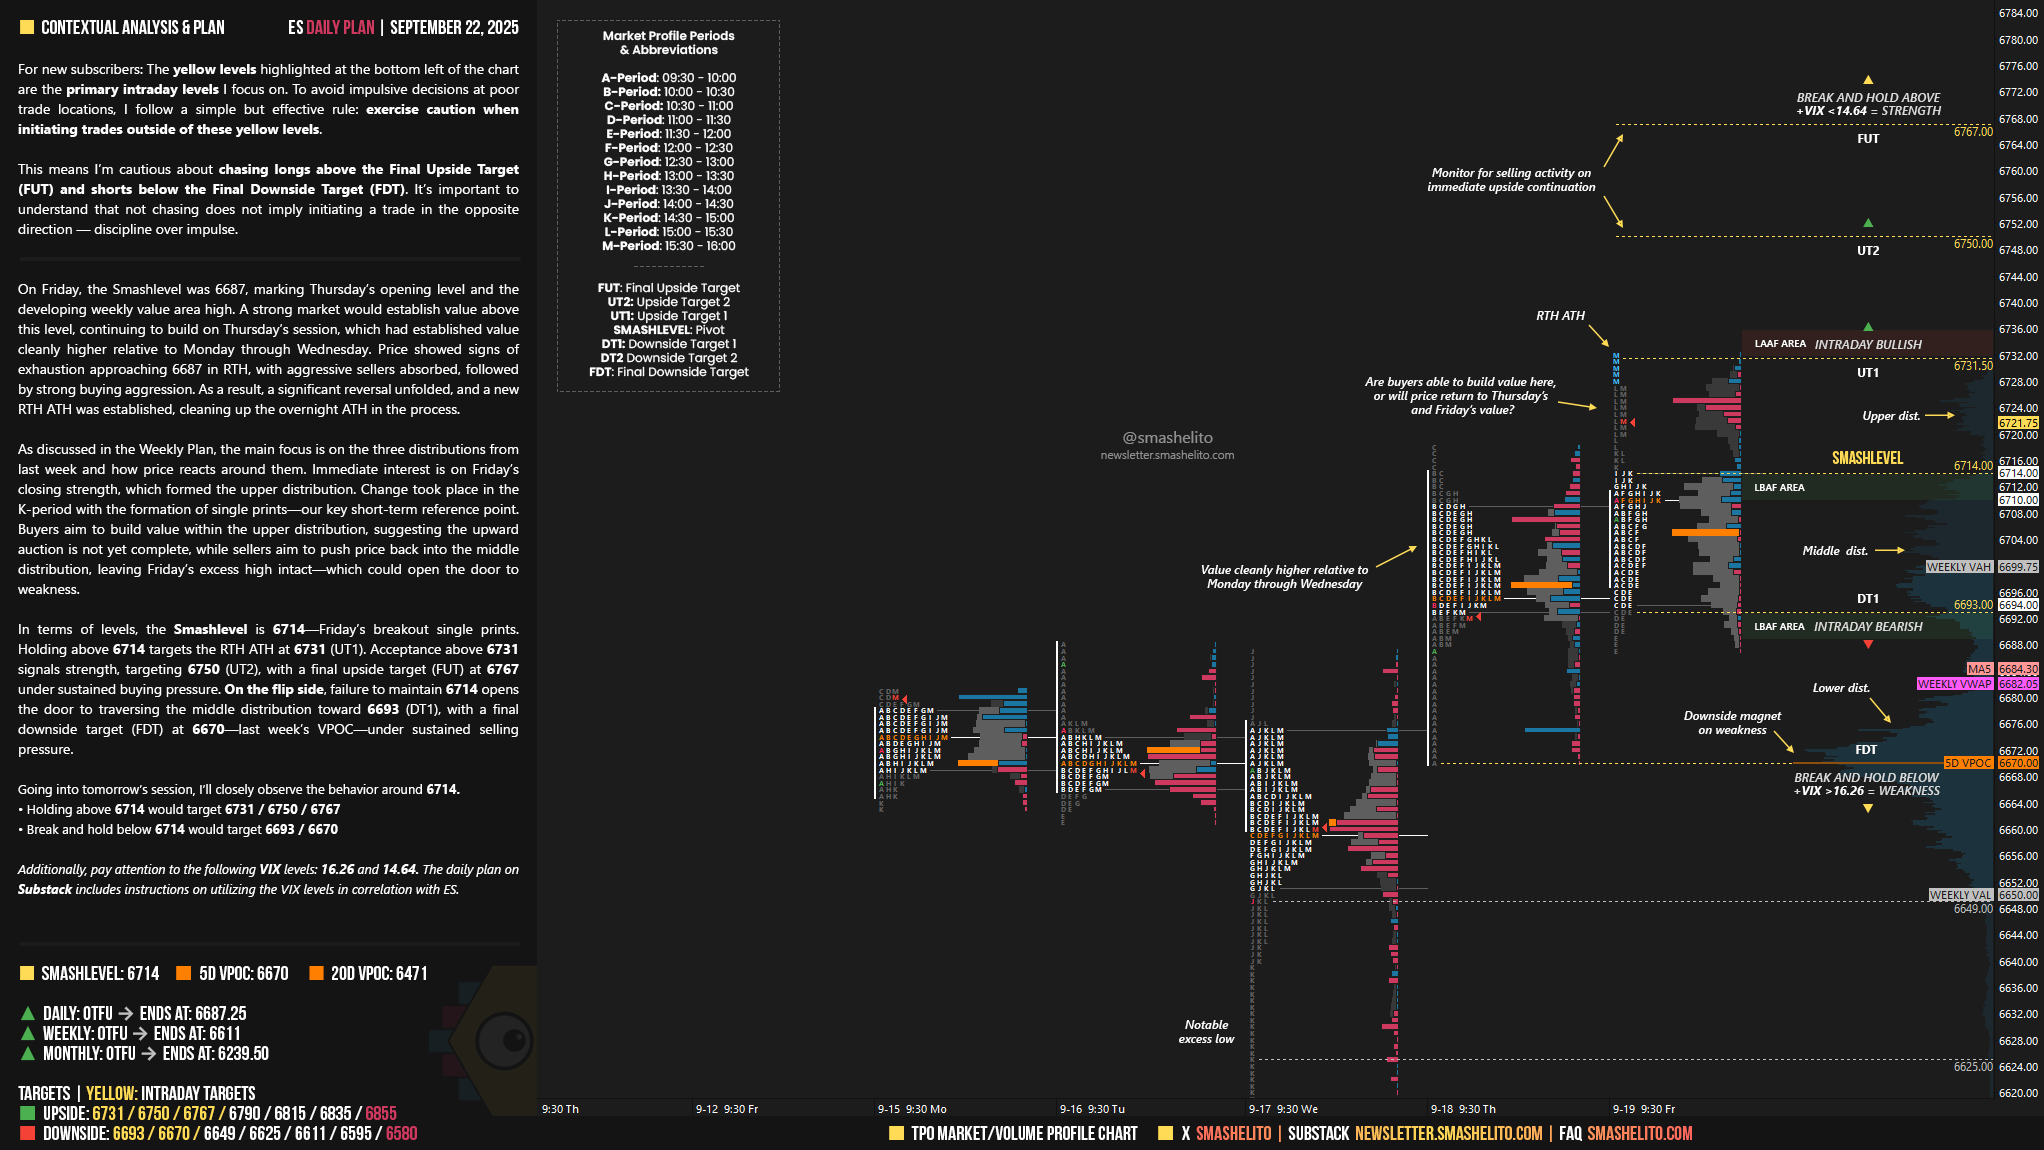
The yellow levels highlighted at the bottom left of the chart are the primary intraday levels I focus on. To avoid impulsive decisions at poor trade locations, I follow a simple but effective rule: exercise caution when initiating trades outside of these yellow levels.
This means I’m cautious about chasing longs above the Final Upside Target (FUT) and shorts below the Final Downside Target (FDT). It’s important to understand that not chasing does not imply initiating a trade in the opposite direction — discipline over impulse.
Be sure to review the ES Weekly Plan | September 22-26, 2025 for a broader perspective, key levels, and market expectations for the week ahead.
Contextual Analysis & Plan
On Friday, the Smashlevel was 6687, marking Thursday’s opening level and the developing weekly value area high. A strong market would establish value above this level, continuing to build on Thursday’s session, which had established value cleanly higher relative to Monday through Wednesday. Price showed signs of exhaustion approaching 6687 in RTH, with aggressive sellers absorbed, followed by strong buying aggression (see Figure 1). As a result, a significant reversal unfolded, and a new RTH ATH was established, cleaning up the overnight ATH in the process.
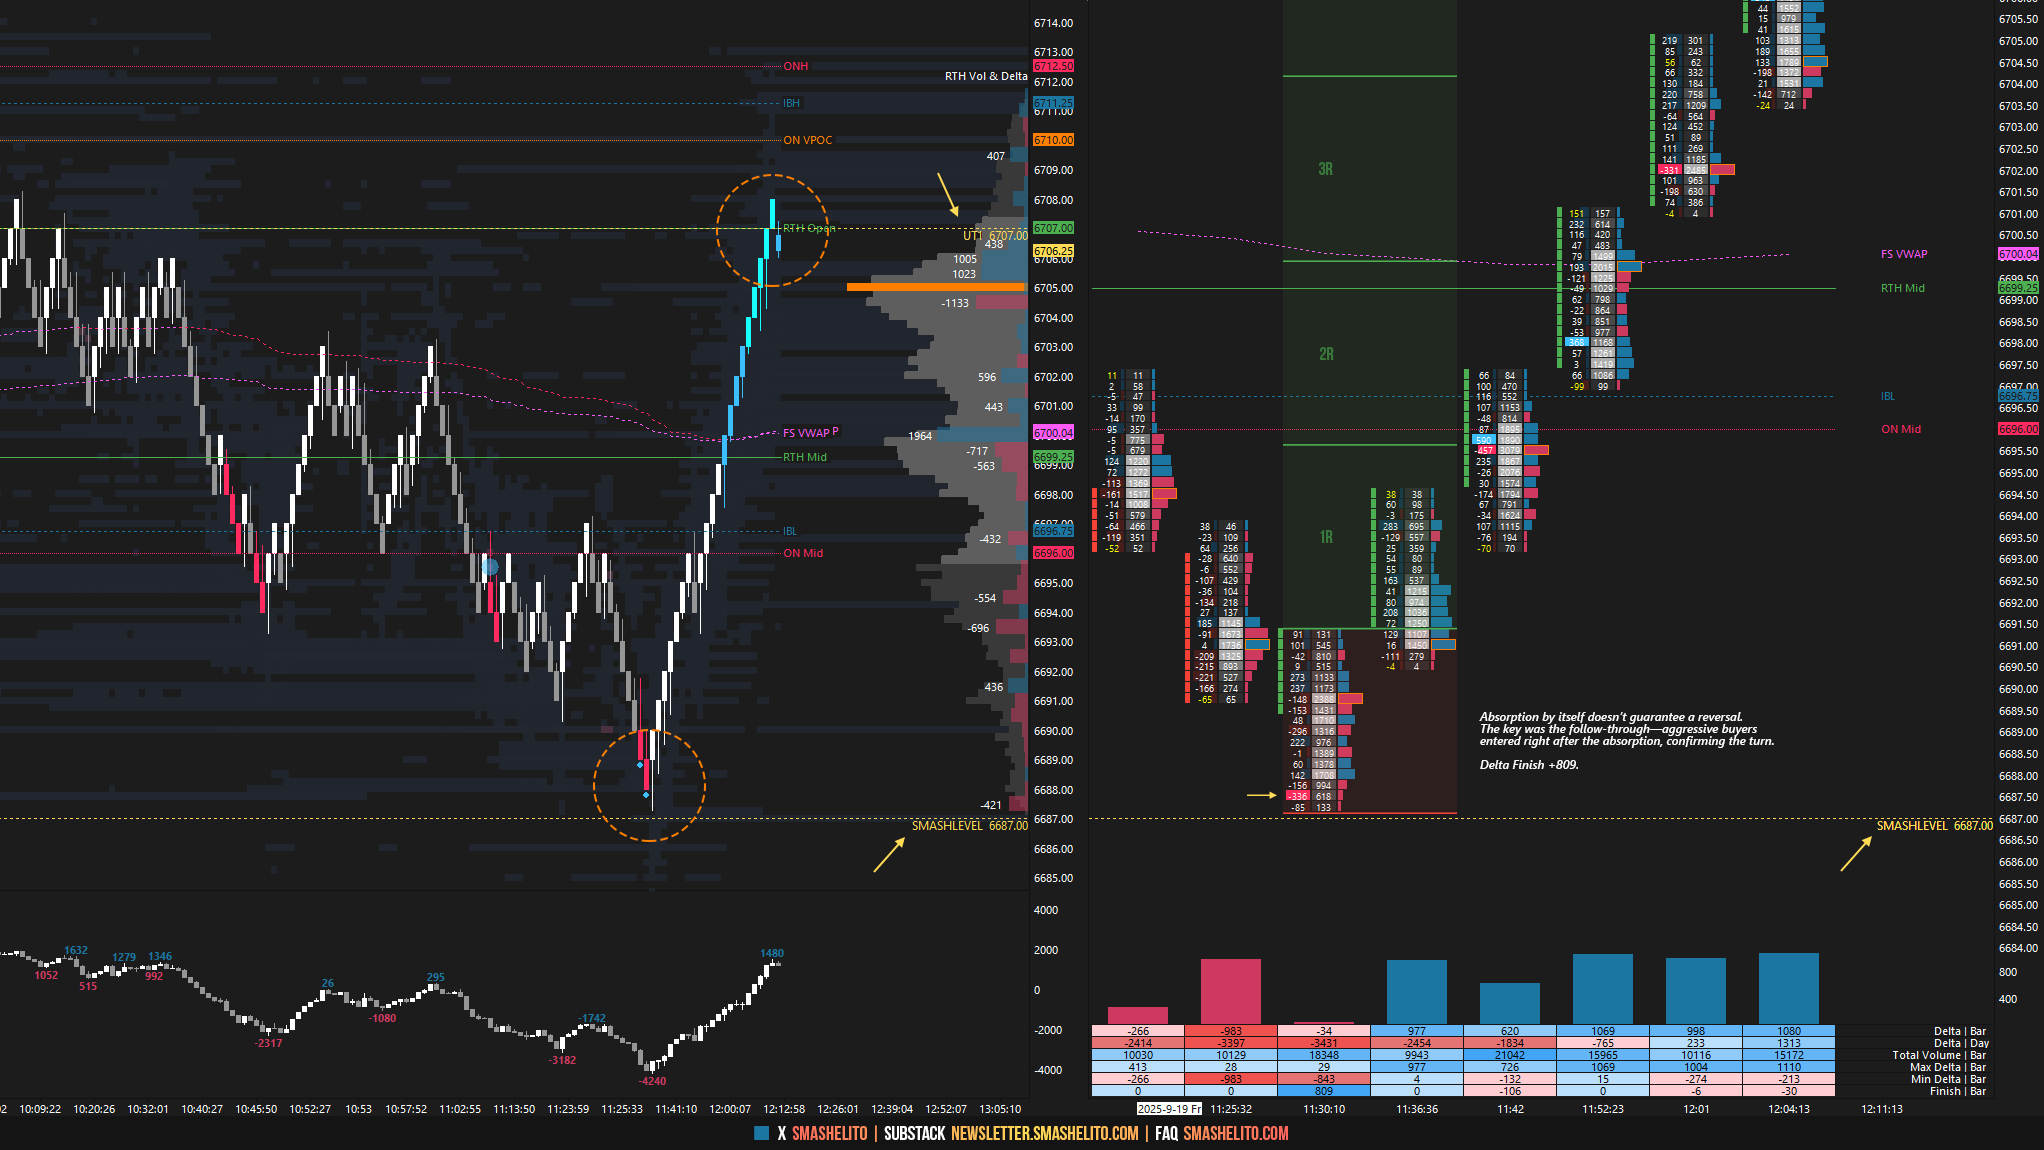
As discussed in the Weekly Plan, the main focus is on the three distributions from last week and how price reacts around them. Immediate interest is on Friday’s closing strength, which formed the upper distribution. Change took place in the K-period with the formation of single prints—our key short-term reference point.
Buyers aim to build value within the upper distribution, suggesting the upward auction is not yet complete, while sellers aim to push price back into the middle distribution, leaving Friday’s excess high intact—which could open the door to weakness.
In terms of levels, the Smashlevel is 6714—Friday’s breakout single prints. Holding above 6714 targets the RTH ATH at 6731 (UT1). Acceptance above 6731 signals strength, targeting 6750 (UT2), with a final upside target (FUT) at 6767 under sustained buying pressure.
On the flip side, failure to maintain 6714 opens the door to traversing the middle distribution toward 6693 (DT1), with a final downside target (FDT) at 6670—last week’s VPOC—under sustained selling pressure.
Levels of Interest
Going into tomorrow’s session, I’ll closely observe the behavior around 6714.
Holding above 6714 would target 6731 / 6750 / 6767
Break and hold below 6714 would target 6693 / 6670
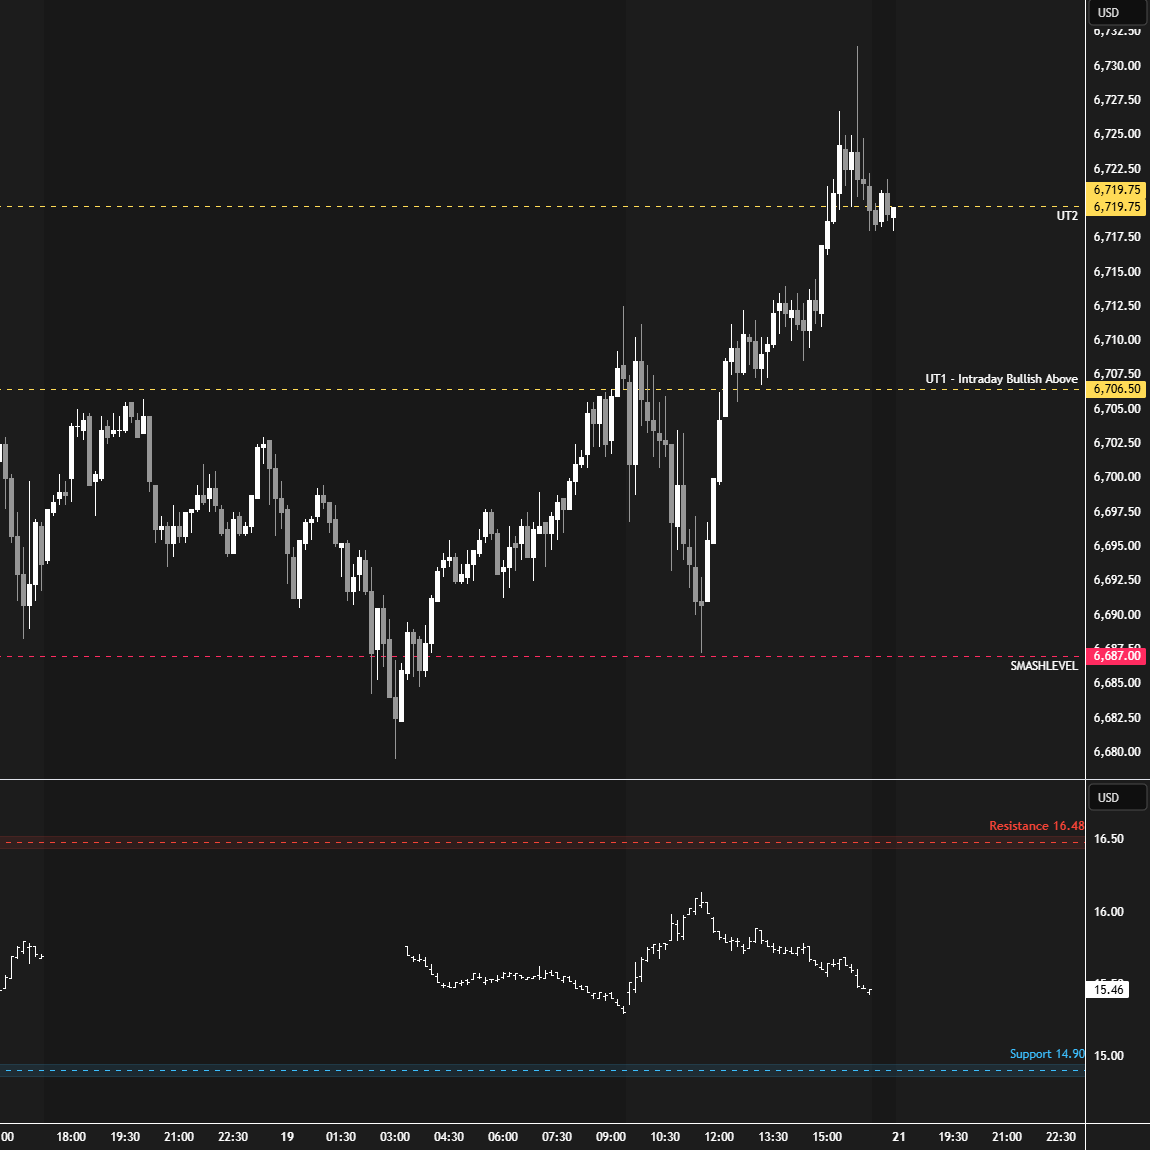
Additionally, pay attention to the following VIX levels: 16.26 and 14.64. These levels can provide confirmation of strength or weakness.
Break and hold above 6767 with VIX below 14.64 would confirm strength.
Break and hold below 6670 with VIX above 16.26 would confirm weakness.
Overall, it's important to exercise caution when trading outside of the highlighted yellow levels. A non-cooperative VIX may suggest possible reversals i.e trade setups.
Like first trade later
Insane levels