

— For new subscribers
The yellow levels highlighted at the bottom left of the chart are the primary intraday levels I focus on. To avoid impulsive decisions at poor trade locations, I follow a simple but effective rule: exercise caution when initiating trades outside of these yellow levels.
This means I’m cautious about chasing longs above the Final Upside Target (FUT) and shorts below the Final Downside Target (FDT). It’s important to understand that not chasing does not imply initiating a trade in the opposite direction. Discipline over impulse.
Be sure to review the Weekly Plan for a broader perspective, key levels, and market expectations for the week ahead.

Contract Rollover
A quick reminder: I’ve switched to the ESZ26 (December) contract. As always, I do not back-adjust my charts. The roll gap at 7659.50 (ESU26 contract) has now been filled.
Contract rollovers can be confusing. While some traders back-adjust their charts, I prefer to leave historical levels unchanged, resulting in a visible roll gap. This is purely a matter of personal preference; neither approach is inherently superior, and both have their pros and cons.
For short-term traders, the impact is minimal, since we navigate the market day by day. During rollover periods, I typically scale back activity because order flow becomes noticeably less reliable.
Contextual Analysis & Plan
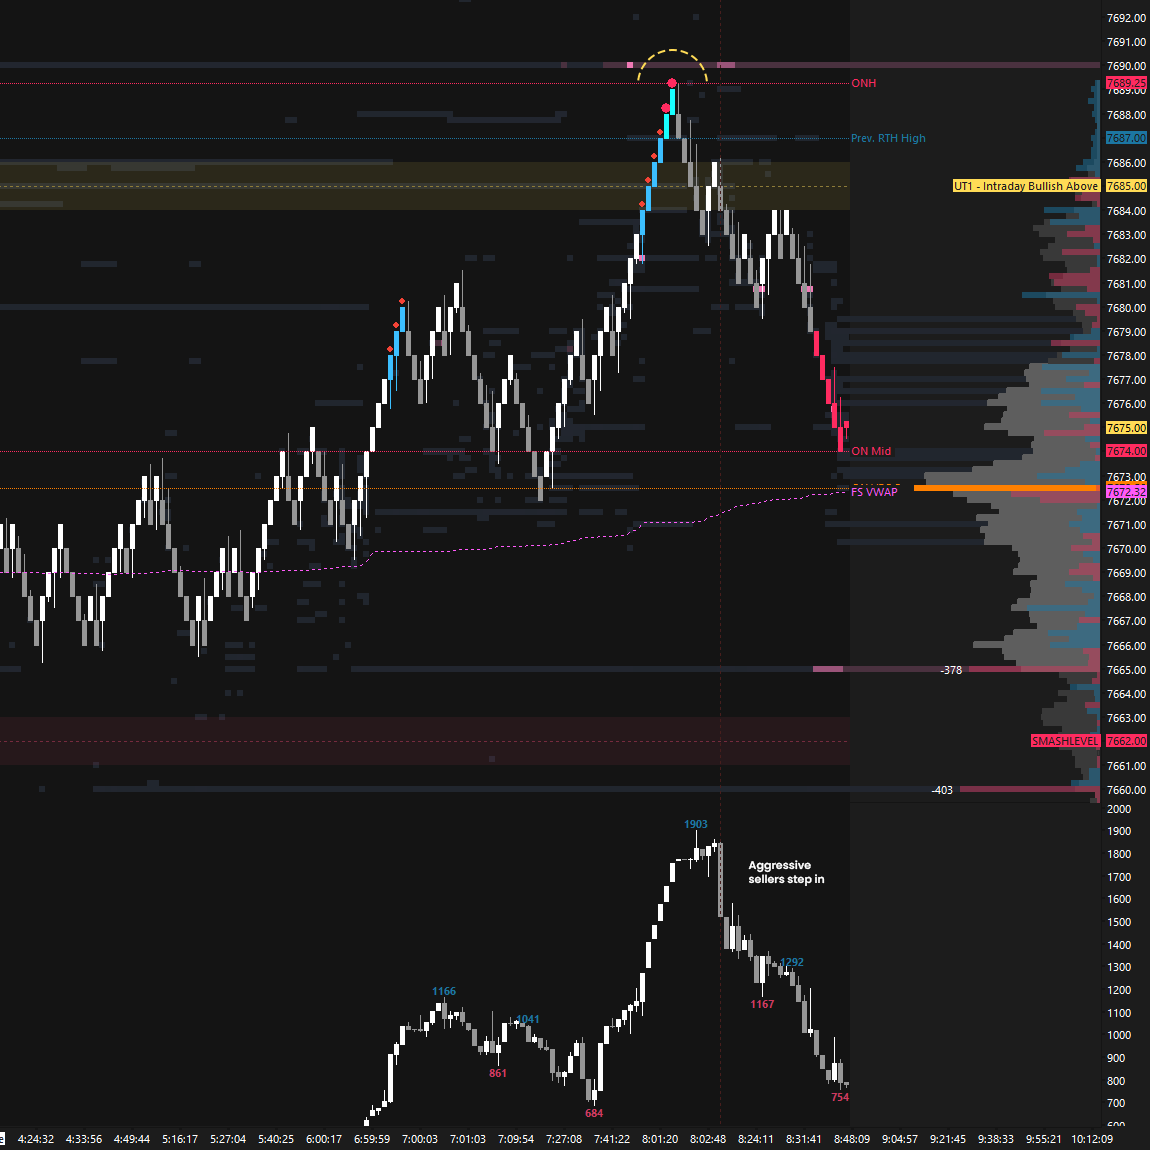
Buyers reclaimed 7662 (Smashlevel) early overnight, putting traders positioned within Tuesday’s main distribution under pressure. Successfully defending 7662 on multiple occasions led to a rotation higher, tagging the next level of interest at 7685 (UT1). A solid Look Above and Fail setup took place at the 7685 level pre-open, with an exhaustive pop above 7685 followed by aggressive selling stepping in (see Figure 1).
The 7685 level continued to be important during the RTH session, as buyers struggled to gain meaningful traction above it. As a reminder, acceptance above 7685 would have been bullish intraday, making it important for sellers to defend the level. With the FOMC meeting on deck, traders showed little interest in pushing the auction aggressively in either direction, resulting in muted price action.
Change took place in the J and, above all, K-periods as the FOMC triggered its typical volatility. As I always say, experienced day traders usually go flat beforehand, leaving the price discovery process to less experienced participants—unless a high-quality entry was established earlier and a runner was already in play. The auction cleared all downside targets toward 7589 (FDT), filling the bull gap at 7620 in the process. If you had not initiated a short by that point, there was no reason to chase the move at poor location. Those who did were ultimately squeezed into the close.
Session Recap
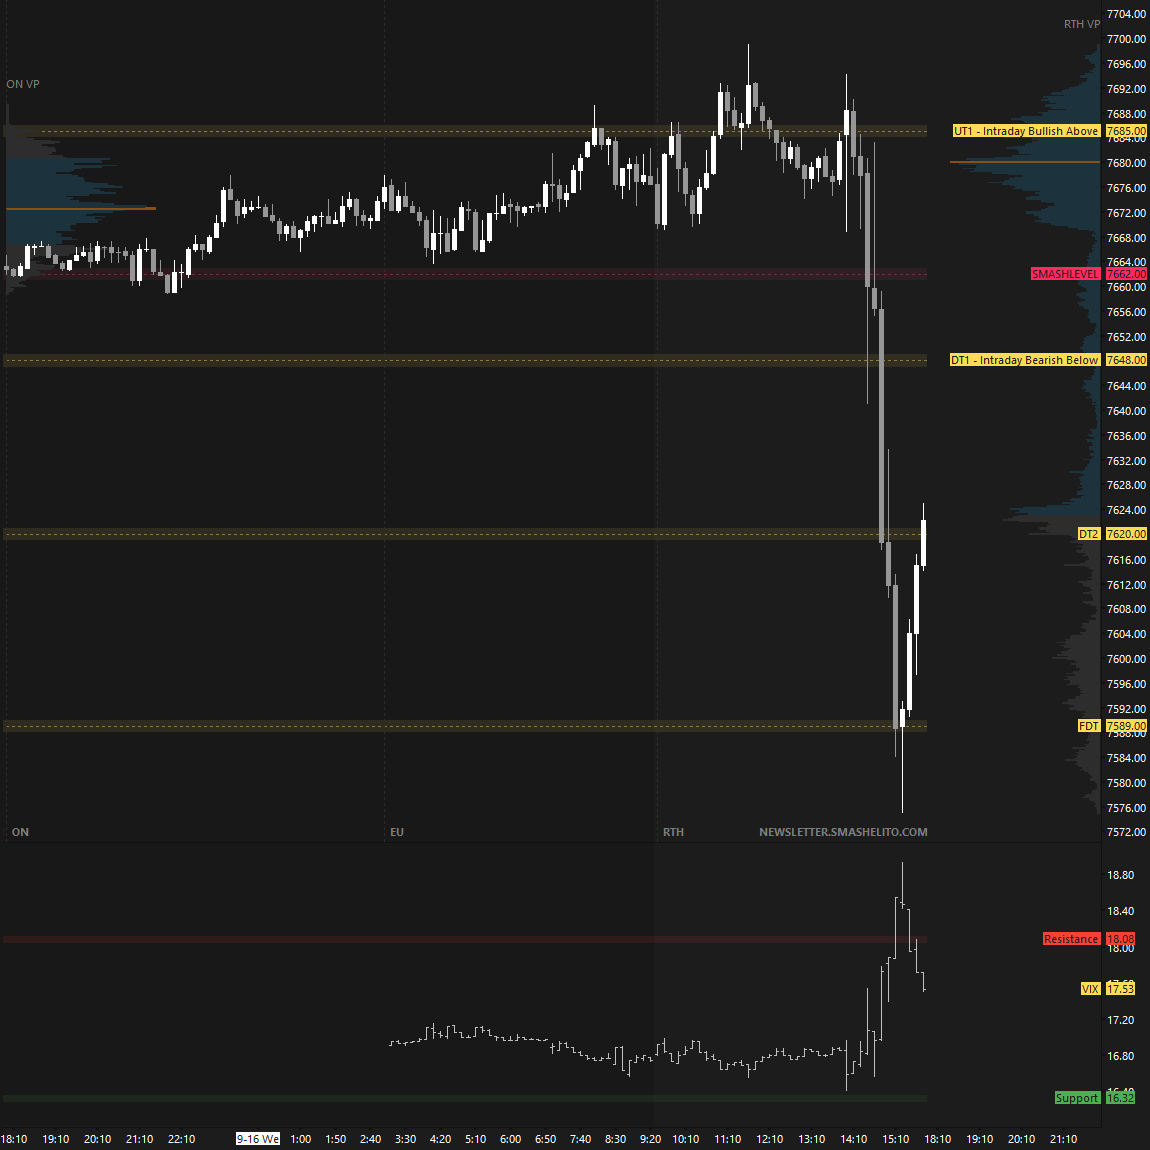
A double distribution trend day was established today following a quiet session ahead of the FOMC, followed by the complete opposite afterward. In the process, a large set of single prints formed in the K-period, separating the two distributions.
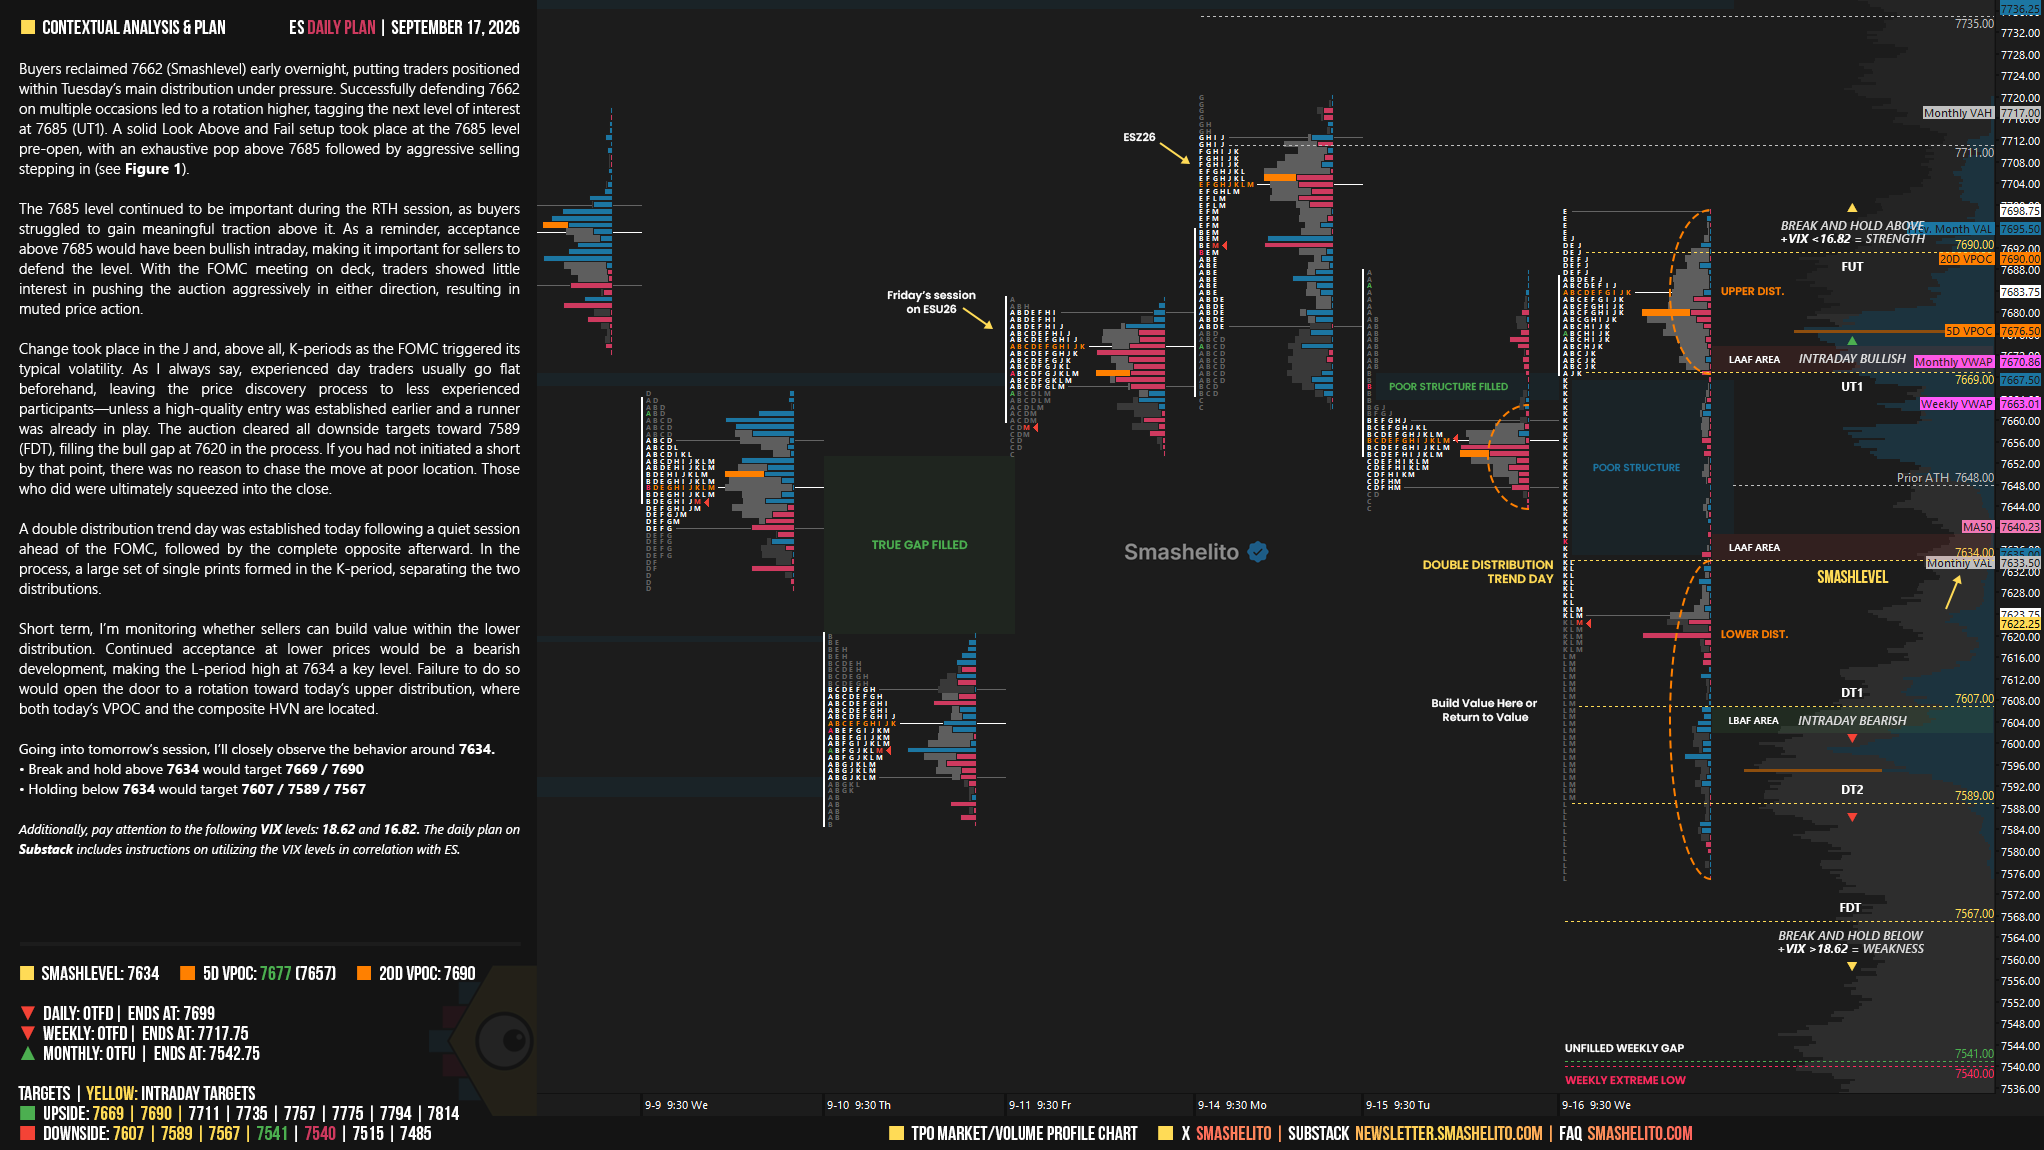
Short term, I’m monitoring whether sellers can build value within the lower distribution. Continued acceptance at lower prices would be a bearish development, making the L-period high at 7634 a key level. Failure to do so would open the door to a rotation toward today’s upper distribution, where both today’s VPOC and the composite HVN are located.
In terms of levels, the Smashlevel is at 7634, the upper end of today’s lower distribution, which aligns with the developing monthly VAL. Holding below 7634 would maintain downside pressure, targeting the LVN at 7607 (DT1). Acceptance below 7607 would signal intraday weakness, targeting today’s excess base at 7589 (DT2), with 7567 (FDT) serving as the final downside target under sustained selling pressure.
On the flip side, reclaiming 7634 shifts focus to today’s breakdown single prints at 7669 (UT1), with 7690 (FUT), the HVN, serving as the final upside target under sustained buying pressure.
Visual Representation
Levels of Interest
Going into tomorrow’s session, I’ll closely observe the behavior around 7634.
Break and hold above 7634 would target 7669 / 7690
Holding below 7634 would target 7607 / 7589 / 7567
Additionally, pay attention to the following VIX levels: 18.62 and 16.82. These levels can provide confirmation of strength or weakness.
Break and hold above 7690 with VIX below 16.82 would confirm strength.
Break and hold below 7567 with VIX above 18.62 would confirm weakness.
Overall, it's important to exercise caution when trading outside of the highlighted yellow levels. A non-cooperative VIX may suggest possible reversals i.e trade setups.
Amazing levels
Thank you for lighting the way