ES Daily Plan | September 11, 2024
My preparations and expectations for the upcoming session.
For new followers: The yellow levels highlighted at the bottom left of the chart are the primary levels that I focus on intraday. My strategy for preventing impulsive decisions at unfavorable locations involves following a simple yet effective rule of exercising caution when initiating trades outside of the yellow levels. This implies that I am cautious chasing longs above the final yellow upside target and shorts below the final yellow downside target. It is crucial to understand that refraining from chasing a trade is not an automatic invitation to initiate a trade in the opposite direction.
Visual Representation
Contextual Analysis
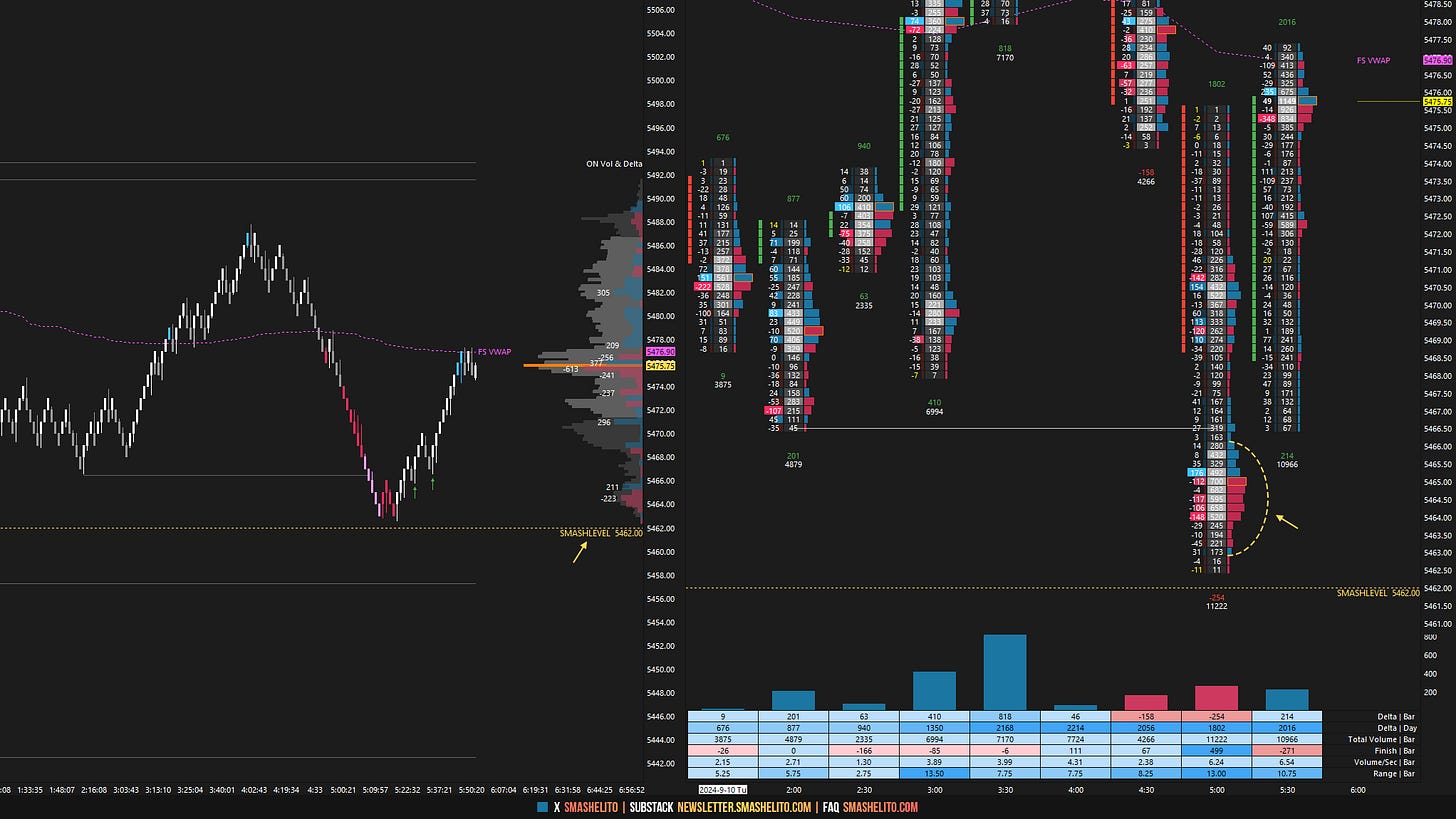
The overnight saw an immediate test of the resistance area between 5490 and 5500, where sellers were active. During the European session, the market initially bounced; however, this bounce was sold, leading to a test of the Smashlevel at 5462. This sequence was notable as the low established during Asian hours was closely connected. The market briefly breached the intraday low, but aggressive sellers failed to break through the 5462 level (ONH: 5462.50), ultimately resulting in a 38-handle reversal.
The RTH session opened with a true gap up, outside of Monday’s inside day. At this point, you should know the drill; an early failure to break and sustain a move above the ONH can present opportunities to fade the market, targeting an inventory correction. The information gained from this inventory correction is highly valuable for assessing the strength or weakness of the auction. The open saw a quick look above the ONH and fail, resulting in a counter move that filled the gap.
Once the gap was filled, the market turned into a clear battleground. Buyers were pushing to regain the ONH, while sellers were looking to gain traction within Monday’s range to trigger a failed breakout scenario. When there's an obvious battle like this, it's often smarter to step aside and let traders sort it out. This allows you to position yourself to trade against the losing side once the market's direction becomes clearer. In the B-period, an impulsive downside move unfolded, and when the market retested Monday’s high, sellers reloaded. By the F-period, Monday’s range was nearly traversed, where buyers entered. Notably, when today’s low was formed, there was an interesting confluence—the VIX approached its resistance level of 20.86 (HOD: 20.74).
The market has returned to a 3-day balance following the break of Monday’s high, completing the structural fills of Friday’s session. All time frames are now in balance ahead of tomorrow's CPI data. Immediate attention is on today’s spike base at 5502, which aligns with the Monthly VWAP. Sellers generally remain in short-term control as long as acceptance is not established above the 5530 HVN, aligning with Friday’s high.
In terms of levels, the Smashlevel is at 5502. Holding below this level would target the 5480 HVN. Acceptance below 5480 would then target 5456, with a final target at 5435 under sustained selling pressure. Failure to hold below 5502 would target the 5530 HVN, with a final target at 5550 under sustained buying pressure.
Levels of Interest
Going into tomorrow's session, I will closely observe the behavior around 5502.
Break and hold above 5502 would target 5530 / 5550
Holding below 5502 would target 5480 / 5456 / 5435
Additionally, pay attention to the following VIX levels: 20.34 and 17.80. These levels can provide confirmation of strength or weakness.
Break and hold above 5550 with VIX below 17.80 would confirm strength.
Break and hold below 5435 with VIX above 20.34 would confirm weakness.
Overall, it's important to exercise caution when trading outside of the highlighted yellow levels. A non-cooperative VIX may suggest possible reversals i.e trade setups.
Weekly Plan
Make sure to review the Weekly Plan, which provides a broader perspective and highlights key levels of interest to observe in the upcoming week.


Worked precisely 🎯
Thanks Smash!