ES Weekly Plan | September 9-13, 2024
My expectations for the upcoming week.
Visual Representation
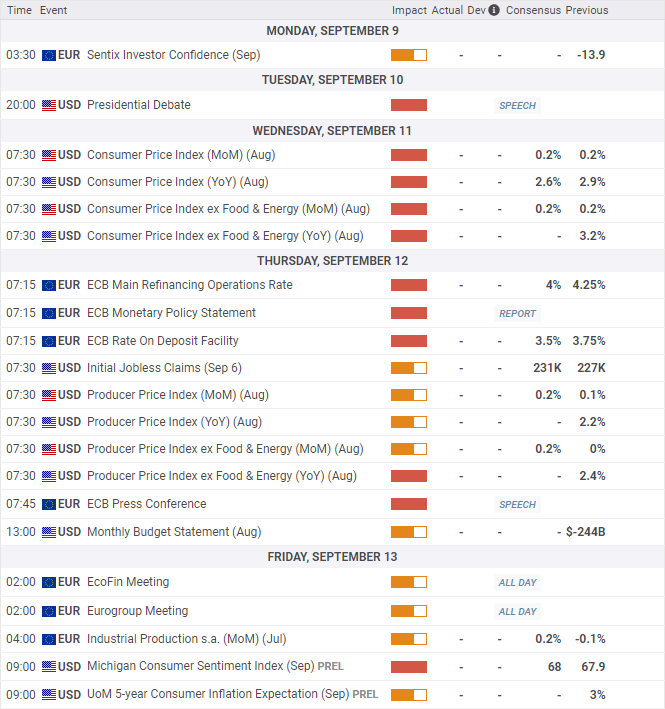
Economic Calendar
Market Structure
🟥 DAILY: OTFD | ENDS: 5532.50
🟨 WEEKLY: BALANCE | 4W | 5669-5347.75
🟨 MONTHLY: BALANCE | 3M | 5721.25-5146
Contextual Analysis
During the previous shortened week, the market saw a downside break from the 10-day balance area, leading to notable weakness. This highlighted the power of balance guidelines and clearly demonstrated the concept that the longer a consolidation phase lasts, the more significant the subsequent breakout tends to be. Tuesday’s breakdown reached the weekly support area, where the downside momentum temporarily stalled over the next two sessions as the market accepted the lower prices, migrating the 5D VPOC lower. On Friday, the market saw another leg to the downside, filling the gap at 5487.75 and nearly traversing the middle distribution from four weeks ago. To put last week’s volatility into perspective, Friday’s session closed below the Monthly Extreme Low of 5445, which is noteworthy given the early stage of the month. Trading above 5445 with a VIX below 19 creates a better environment for buyers.

For this week, the main focus will be on sellers' ability to sustain the establishment of value at lower prices after last week’s 10-day balance breakdown. The market has now retraced 50% of August’s impressive 500-handle rally, reaching a notable LVN on the composite profile. Immediate attention will be on Friday’s downside continuation, which closed 116 handles below the previous week’s VPOC at 5535. A weak market would hold below 5435—a level sellers defended on Friday afternoon. Failure to do so would open the door for a short-covering bounce. CPI data is scheduled for release on Wednesday, followed by PPI on Thursday.
The weekly Smashlevel (Pivot) is 5435, representing the well-known 5% correction level—a level sellers defended on Friday afternoon. Break and hold above 5435 would target the previous week’s VAL at 5480. Acceptance above 5480 would then target the YTD VPOC at 5530 and the resistance area from 5550 to the Weekly Extreme High of 5580, where selling activity can be expected. Note how this resistance area coincides with the 10-day balance low.
Holding below 5435 signals continued weakness, targeting a downside continuation toward the unfilled daily gap at 5396.75 and the weekly NVPOC at 5345, coinciding with the 4-week balance low and the 61.8% fib retracement. Acceptance below 5345 would then target the support area from 5290 to the Weekly Extreme Low of 5260, where buying activity can be expected.
Levels of Interest
In the upcoming week, I will closely observe the behavior around 5435.
Break and hold above 5435 would target 5480 / 5530 / 5550 / 5580* / 5612 / 5646
Holding below 5435 would target 5396 / 5345 / 5290 / 5260* / 5230 / 5200
*Weekly Extremes. I exercise caution when initiating trades outside the Weekly Extremes to avoid making impulsive decisions at unfavorable locations. Essentially, the Weekly Extremes serve as a safeguard against emotionally-driven trades, a state that is less than ideal for making well-informed trading decisions.
As usual, a detailed daily plan will be published tomorrow. In the meantime, enjoy the rest of your weekend!


Thank you so much. You're helping me to pull myself out of poverty 🙏🙏🙏🙏🙏❤️❤️❤️
i love this analysis! For people who are just starting out, it is very helpful, thanks for all!