
ES Daily Plan | October 9, 2025
Market Context & Key Levels for the Day Ahead

— For new subscribers
The yellow levels highlighted at the bottom left of the chart are the primary intraday levels I focus on. To avoid impulsive decisions at poor trade locations, I follow a simple but effective rule: exercise caution when initiating trades outside of these yellow levels.
This means I’m cautious about chasing longs above the Final Upside Target (FUT) and shorts below the Final Downside Target (FDT). It’s important to understand that not chasing does not imply initiating a trade in the opposite direction — discipline over impulse.
Be sure to review the ES Weekly Plan | October 6-10, 2025 for a broader perspective, key levels, and market expectations for the week ahead.
Contextual Analysis & Plan
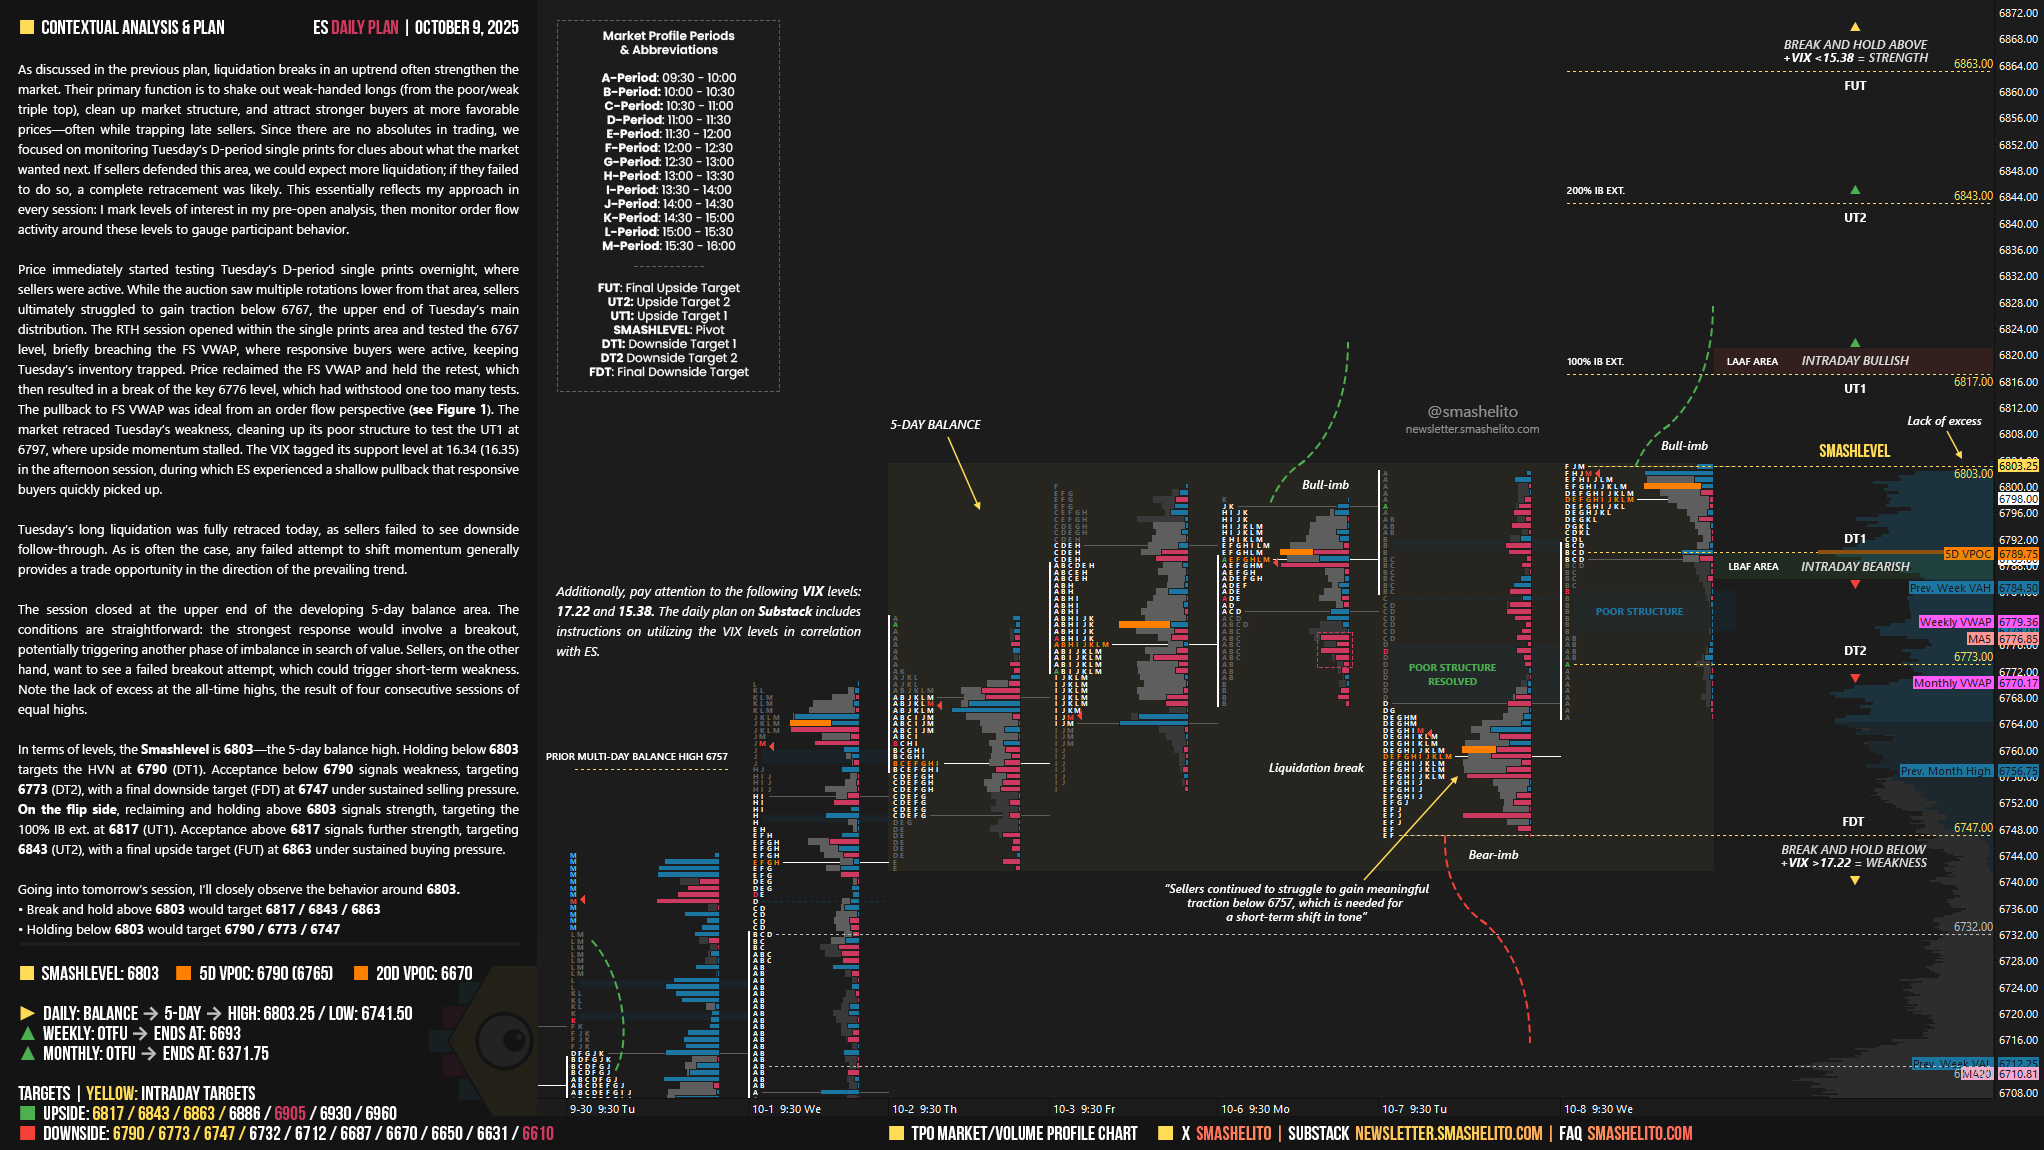
As discussed in the previous plan, liquidation breaks in an uptrend often strengthen the market. Their primary function is to shake out weak-handed longs (from the poor/weak triple top), clean up market structure, and attract stronger buyers at more favorable prices—often while trapping late sellers. Since there are no absolutes in trading, we focused on monitoring Tuesday’s D-period single prints for clues about what the market wanted next. If sellers defended this area, we could expect more liquidation; if they failed to do so, a complete retracement was likely. This essentially reflects my approach in every session: I mark levels of interest in my pre-open analysis, then monitor order flow activity around these levels to gauge participant behavior.
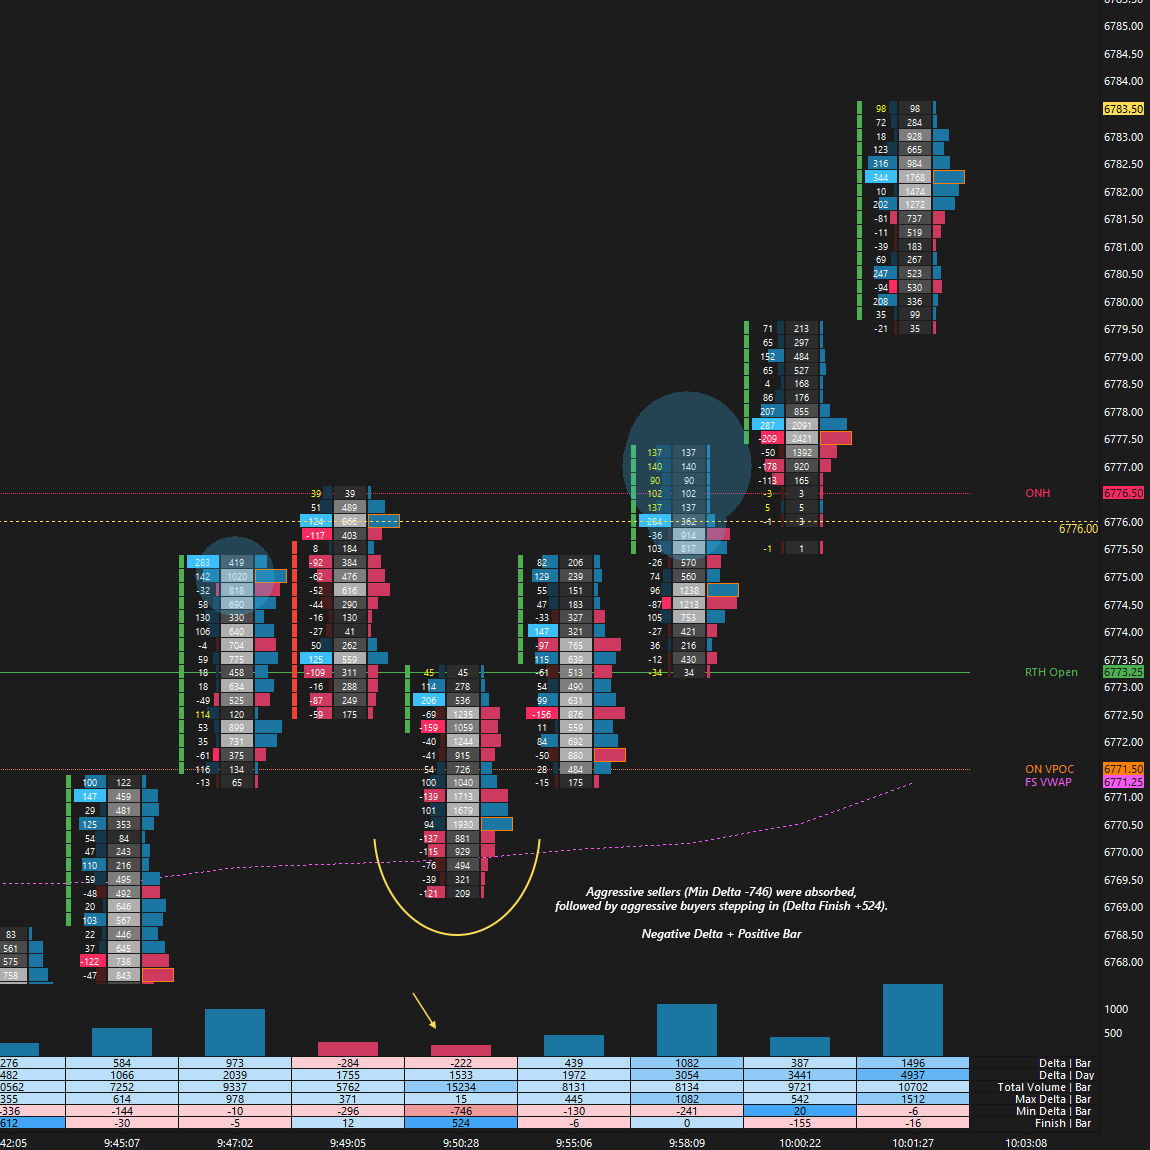
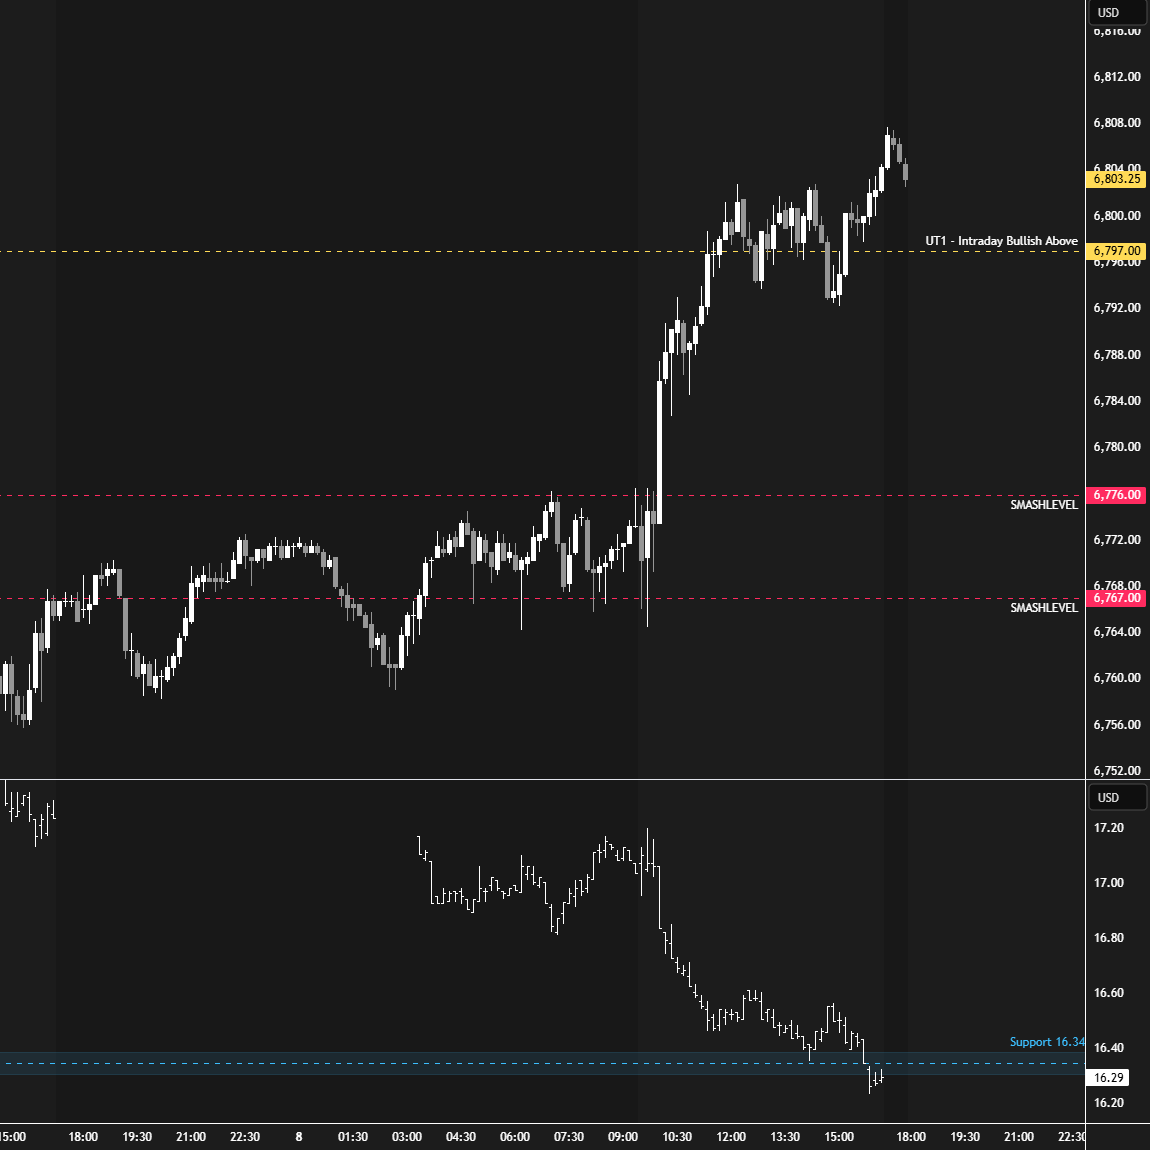
Price immediately started testing Tuesday‘s D-period single prints overnight, where sellers were active. While the auction saw multiple rotations lower from that area, sellers ultimately struggled to gain traction below 6767, the upper end of Tuesday’s main distribution. The RTH session opened within the single prints area and tested the 6767 level, briefly breaching the FS VWAP, where responsive buyers were active, keeping Tuesday‘s inventory trapped. Price reclaimed the FS VWAP and held the retest, which then resulted in a break of the key 6776 level, which had withstood one too many tests. The pullback to FS VWAP was ideal from an order flow perspective (see Figure 1). The market retraced Tuesday’s weakness, cleaning up its poor structure to test the UT1 at 6797, where upside momentum stalled. The VIX tagged its support level at 16.34 (16.35) in the afternoon session, during which ES experienced a shallow pullback that responsive buyers quickly picked up.
Tuesday‘s long liquidation was fully retraced today, as sellers failed to see downside follow-through. As is often the case, any failed attempt to shift momentum generally provides a trade opportunity in the direction of the prevailing trend.
The session closed at the upper end of the developing 5-day balance area. The conditions are straightforward: the strongest response would involve a breakout, potentially triggering another phase of imbalance in search of value. Sellers, on the other hand, want to see a failed breakout attempt, which could trigger short-term weakness. Note the lack of excess at the all-time highs, the result of four consecutive sessions of equal highs.
In terms of levels, the Smashlevel is 6803—the 5-day balance high. Holding below 6803 targets the HVN at 6790 (DT1). Acceptance below 6790 signals weakness, targeting 6773 (DT2), with a final downside target (FDT) at 6747 under sustained selling pressure.
On the flip side, reclaiming and holding above 6803 signals strength, targeting the 100% IB ext. at 6817 (UT1). Acceptance above 6817 signals further strength, targeting 6843 (UT2), with a final upside target (FUT) at 6863 under sustained buying pressure.
Levels of Interest
Going into tomorrow’s session, I’ll closely observe the behavior around 6803.
Break and hold above 6803 would target 6817 / 6843 / 6863
Holding below 6803 would target 6790 / 6773 / 6747
Additionally, pay attention to the following VIX levels: 17.22 and 15.38. These levels can provide confirmation of strength or weakness.
Break and hold above 6863 with VIX below 15.38 would confirm strength.
Break and hold below 6747 with VIX above 17.22 would confirm weakness.
Overall, it's important to exercise caution when trading outside of the highlighted yellow levels. A non-cooperative VIX may suggest possible reversals i.e trade setups.
You're the man Smash!
As always thank you!