
ES Daily Plan | October 8, 2025
Market Context & Key Levels for the Day Ahead

— For new subscribers
The yellow levels highlighted at the bottom left of the chart are the primary intraday levels I focus on. To avoid impulsive decisions at poor trade locations, I follow a simple but effective rule: exercise caution when initiating trades outside of these yellow levels.
This means I’m cautious about chasing longs above the Final Upside Target (FUT) and shorts below the Final Downside Target (FDT). It’s important to understand that not chasing does not imply initiating a trade in the opposite direction — discipline over impulse.
Be sure to review the ES Weekly Plan | October 6-10, 2025 for a broader perspective, key levels, and market expectations for the week ahead.
Contextual Analysis & Plan
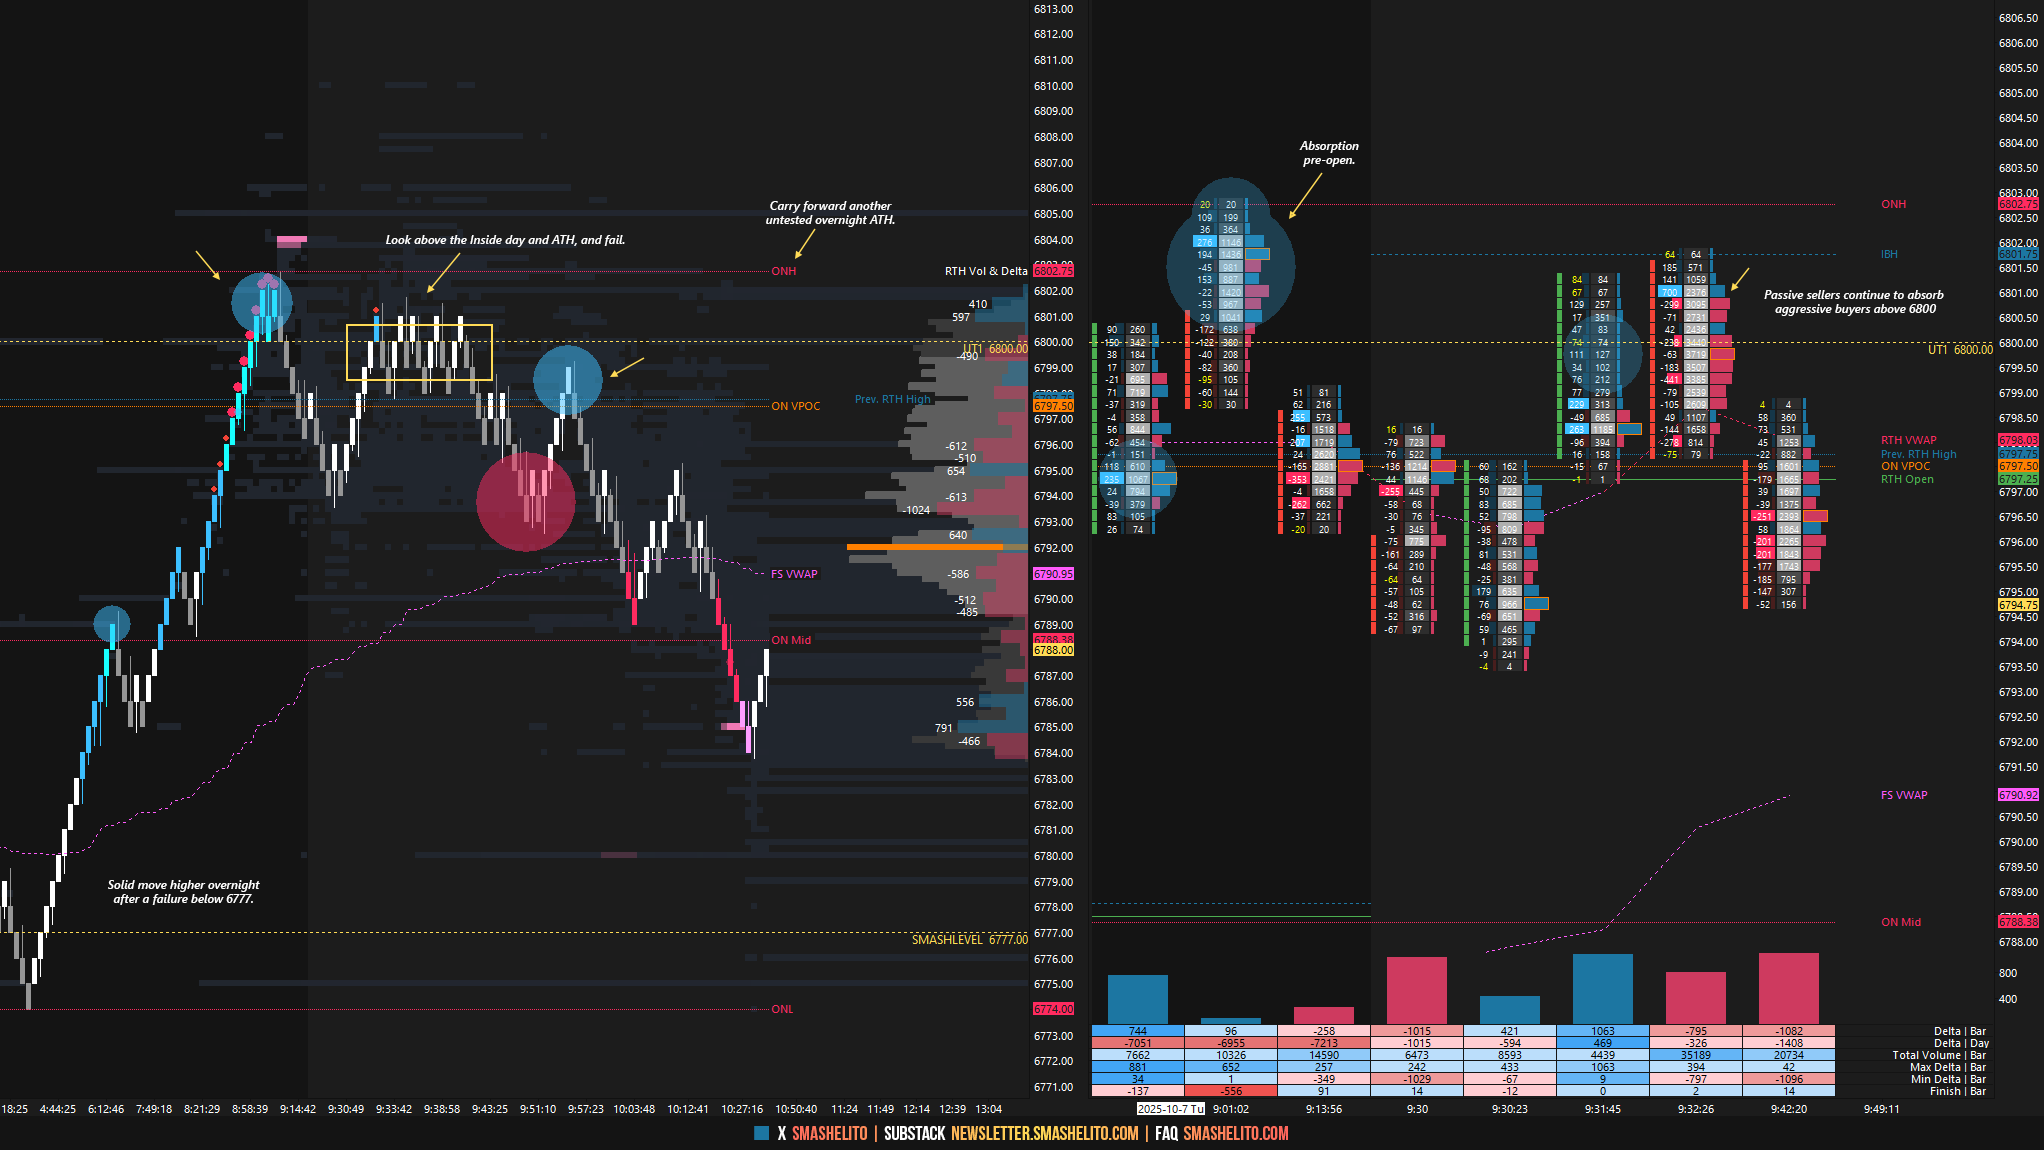
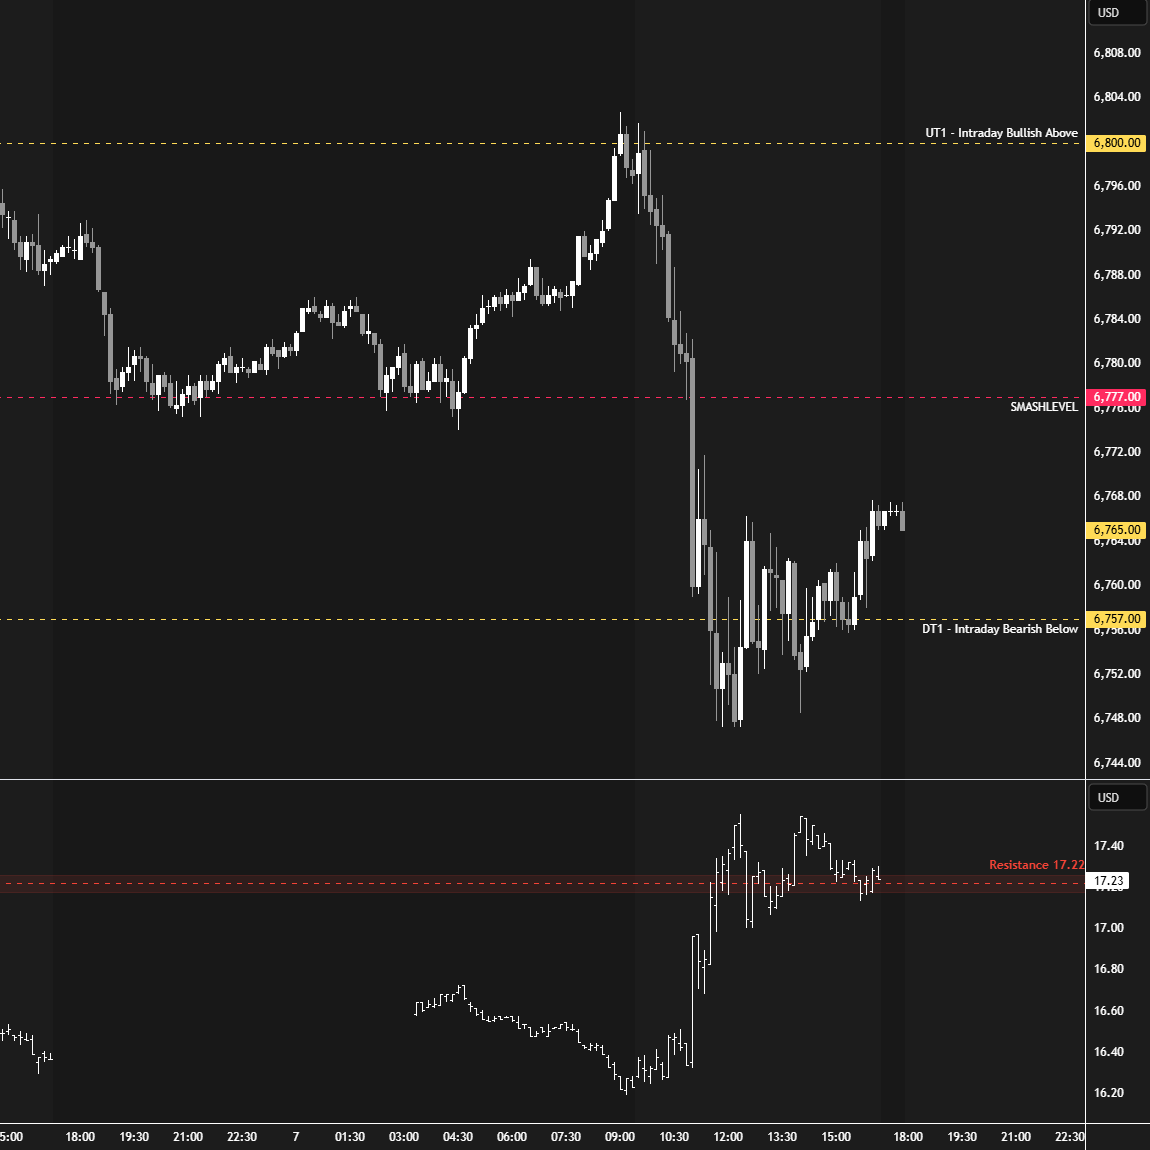
Today’s session offered solid opportunities in both the overnight and RTH sessions. Overnight, the market pulled back to retest the Smashlevel at 6777, where notable aggressive selling was absorbed by passive buyers on Monday. Responsive buyers were active at 6777, providing bounces during both the Asian and European hours—particularly the latter, which resulted in a solid 25-handle move toward UT1 at 6800. For the session to shift into a bullish intraday state, reclaiming 6800 was necessary, which essentially required a sustained inside-day/ATH breakout. Did you notice how aggressive buyers were absorbed above 6800 pre-open?
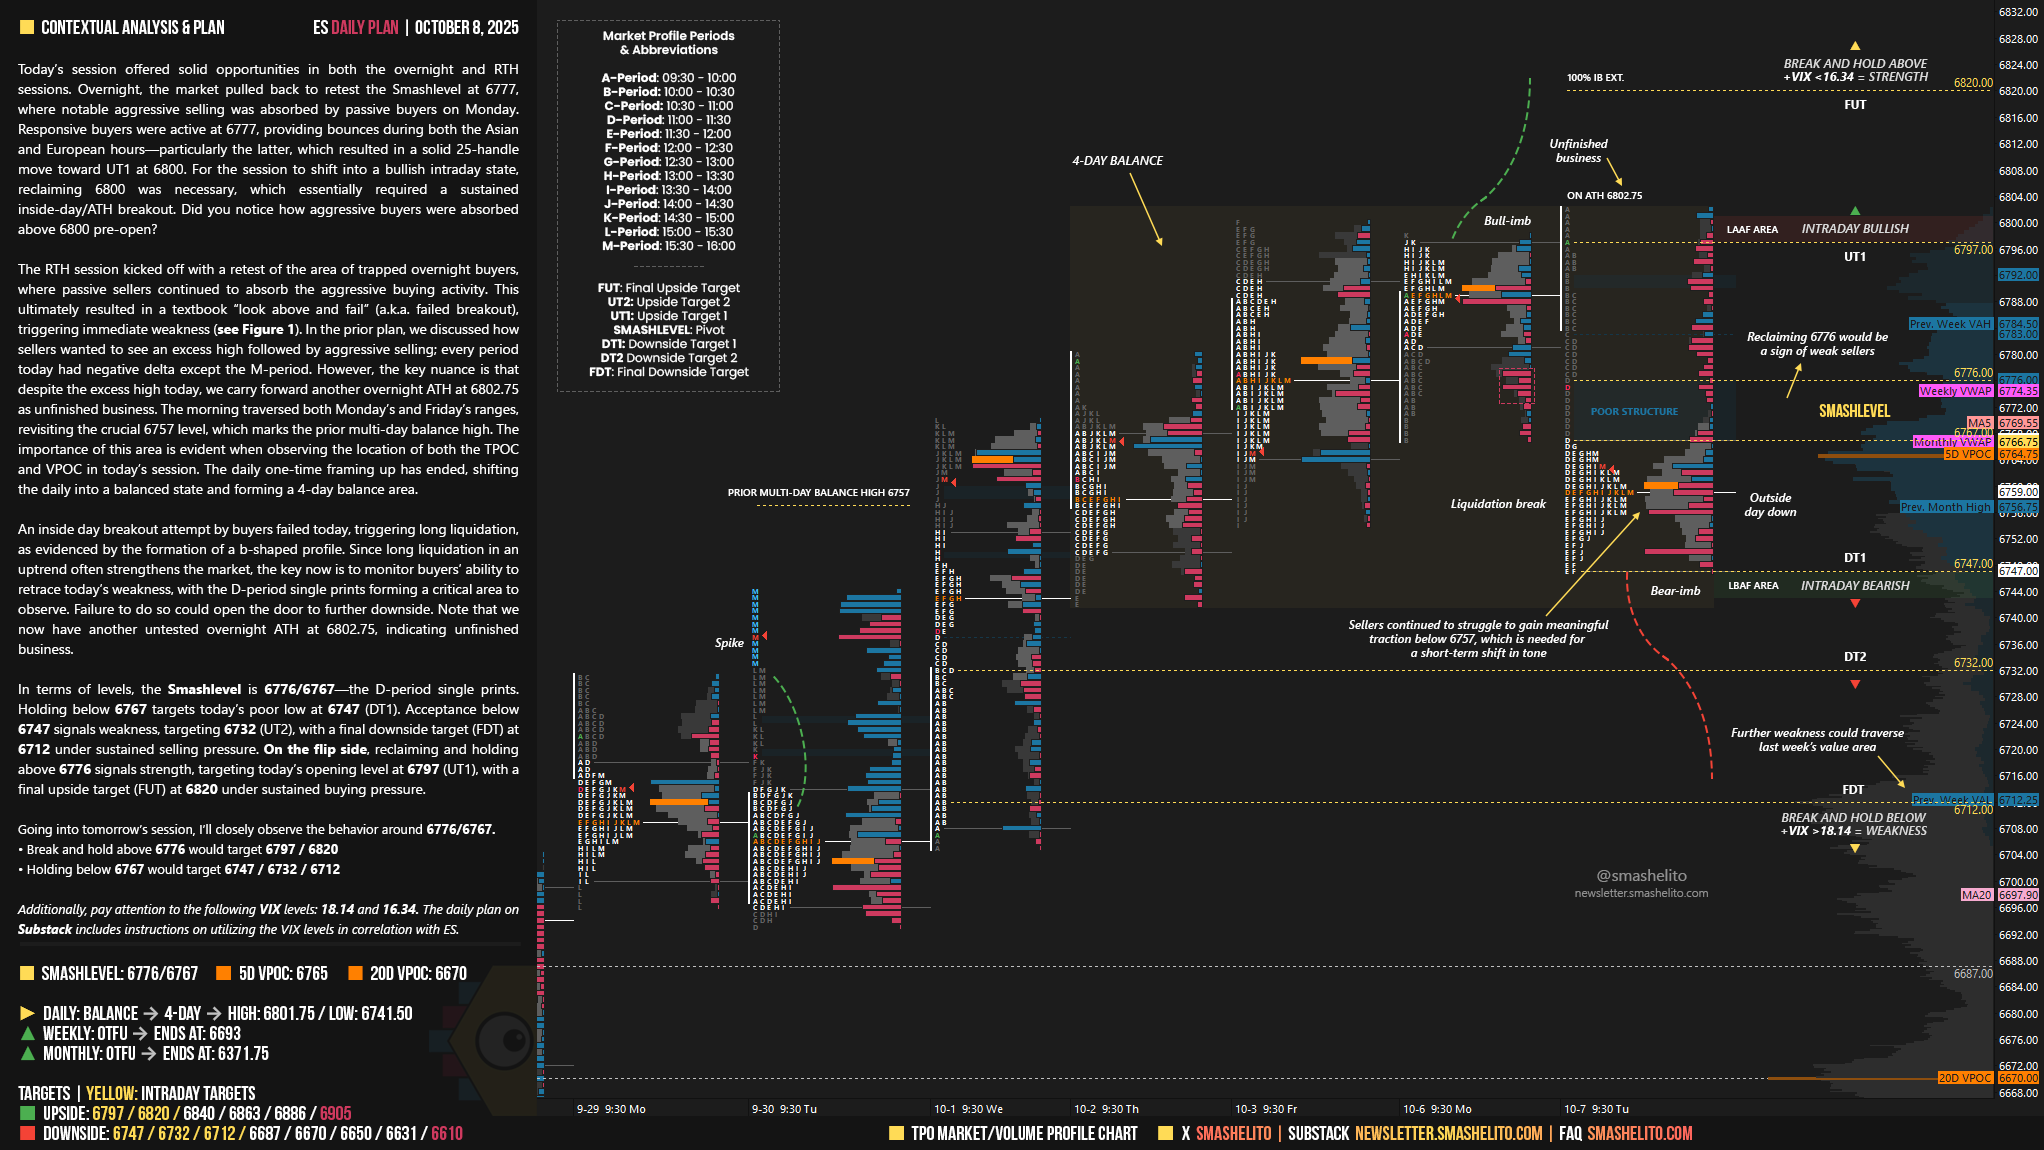
The RTH session kicked off with a retest of the area of trapped overnight buyers, where passive sellers continued to absorb the aggressive buying activity. This ultimately resulted in a textbook “look above and fail” (a.k.a. failed breakout), triggering immediate weakness (see Figure 1). In the prior plan, we discussed how sellers wanted to see an excess high followed by aggressive selling; every period today had negative delta except the M-period. However, the key nuance is that despite the excess high today, we carry forward another overnight ATH at 6802.75 as unfinished business. The morning traversed both Monday’s and Friday’s ranges, revisiting the crucial 6757 level, which marks the prior multi-day balance high. The importance of this area is evident when observing the location of both the TPOC and VPOC in today’s session. The daily one-time framing up has ended, shifting the daily into a balanced state and forming a 4-day balance area.
An inside day breakout attempt by buyers failed today, triggering long liquidation, as evidenced by the formation of a b-shaped profile. Since long liquidation in an uptrend often strengthens the market, the key now is to monitor buyers’ ability to retrace today’s weakness, with the D-period single prints forming a critical area to observe. Failure to do so could open the door to further downside. Note that we now have another untested overnight ATH at 6802.75, indicating unfinished business.
In terms of levels, the Smashlevel is 6776/6767—the D-period single prints. Holding below 6767 targets today’s poor low at 6747 (DT1). Acceptance below 6747 signals weakness, targeting 6732 (UT2), with a final downside target (FDT) at 6712 under sustained selling pressure.
On the flip side, reclaiming and holding above 6776 signals strength, targeting today’s opening level at 6797 (UT1), with a final upside target (FUT) at 6820 under sustained buying pressure.
Levels of Interest
Going into tomorrow’s session, I’ll closely observe the behavior around 6776/6767.
Break and hold above 6776 would target 6797 / 6820
Holding below 6767 would target 6747 / 6732 / 6712
Additionally, pay attention to the following VIX levels: 18.14 and 16.34. These levels can provide confirmation of strength or weakness.
Break and hold above 6820 with VIX below 16.34 would confirm strength.
Break and hold below 6712 with VIX above 18.14 would confirm weakness.
Overall, it's important to exercise caution when trading outside of the highlighted yellow levels. A non-cooperative VIX may suggest possible reversals i.e trade setups.
Smash, always with impeccable analyses, thank you for everything, may life continue to fill you with health and abundance!
Your work ethic and professionalism is incredible! Truly inspiring.