
ES Daily Plan | October 6, 2025
Market Context & Key Levels for the Day Ahead

— For new subscribers
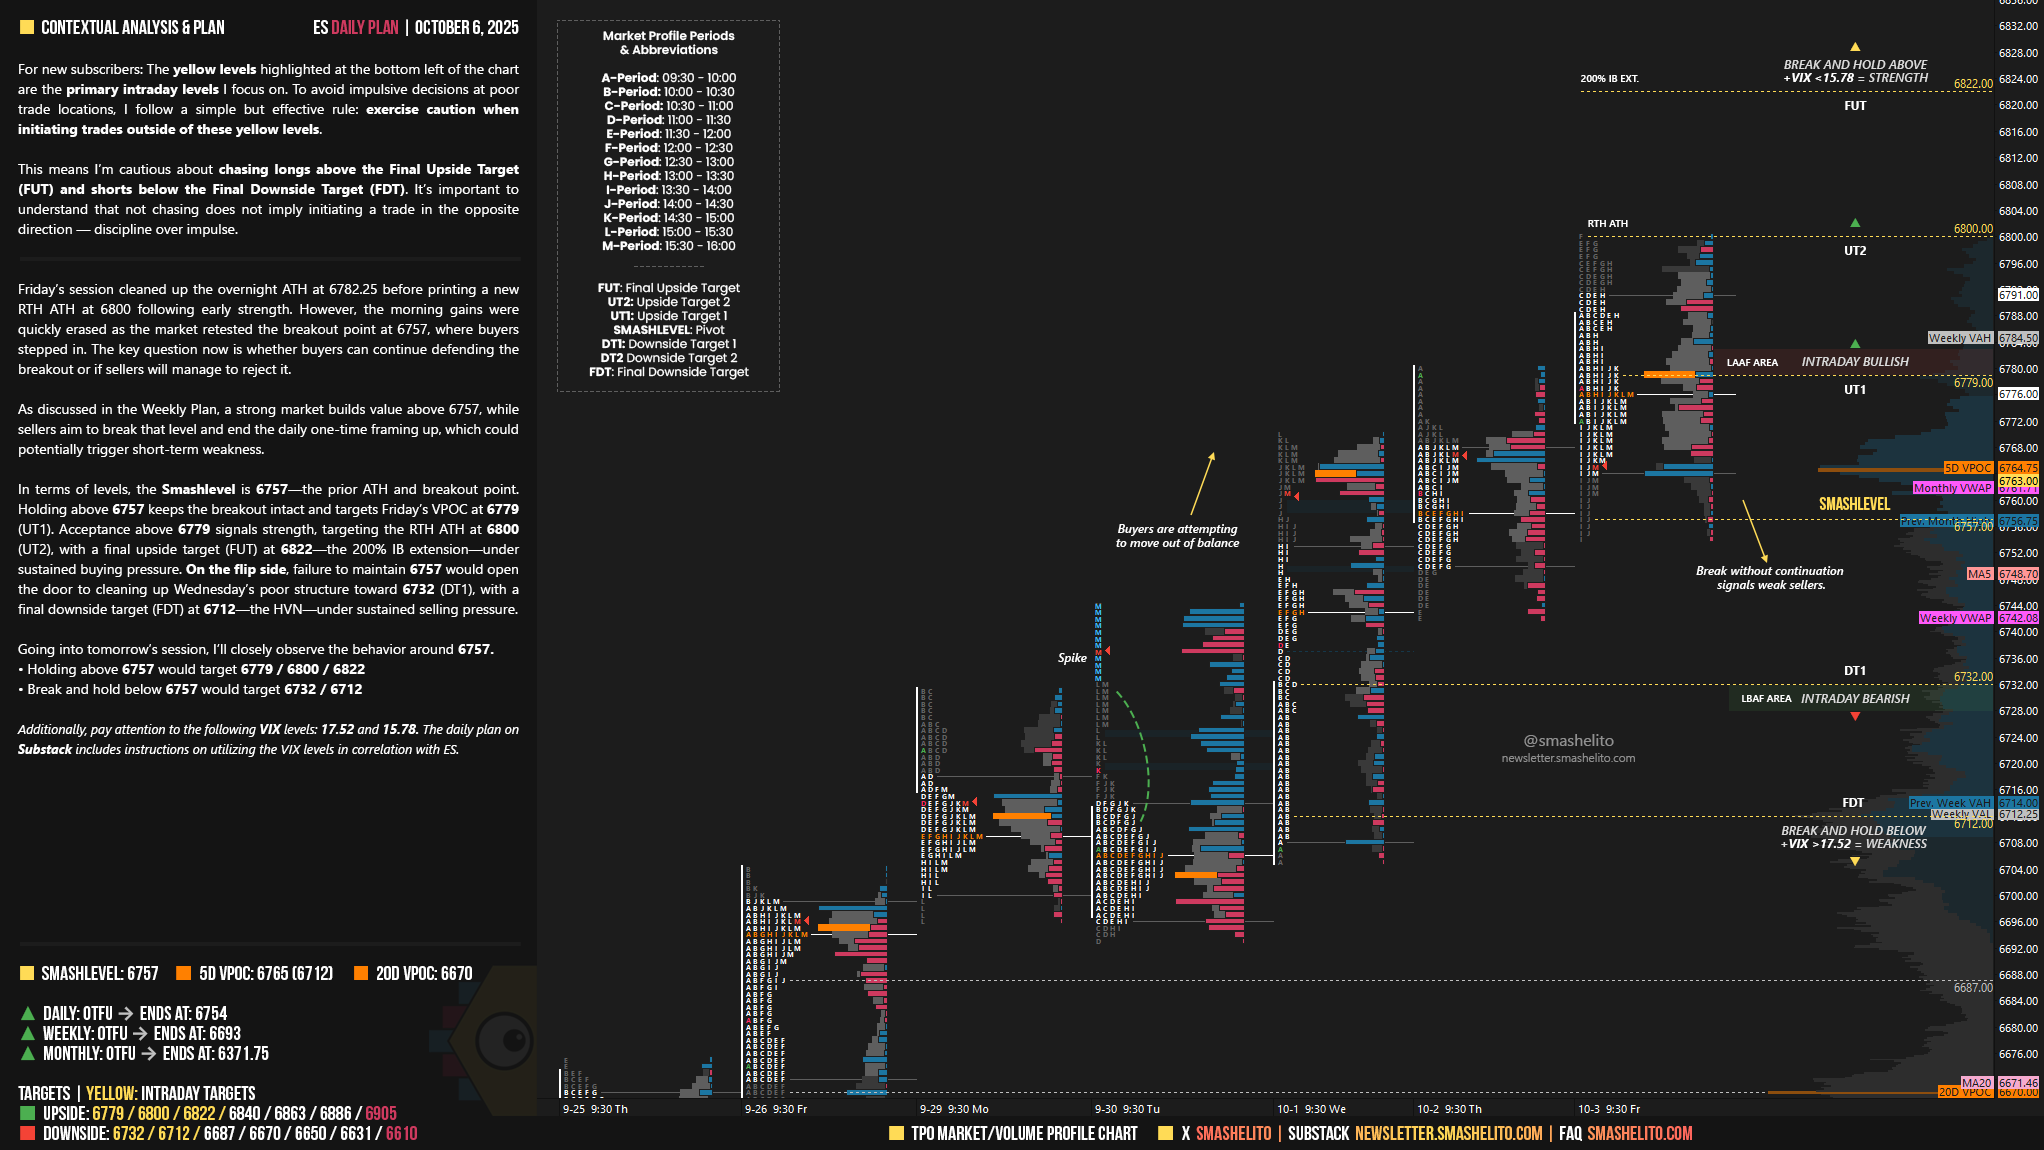
The yellow levels highlighted at the bottom left of the chart are the primary intraday levels I focus on. To avoid impulsive decisions at poor trade locations, I follow a simple but effective rule: exercise caution when initiating trades outside of these yellow levels.
This means I’m cautious about chasing longs above the Final Upside Target (FUT) and shorts below the Final Downside Target (FDT). It’s important to understand that not chasing does not imply initiating a trade in the opposite direction — discipline over impulse.
Be sure to review the ES Weekly Plan | October 6-10, 2025 for a broader perspective, key levels, and market expectations for the week ahead.
Contextual Analysis & Plan
Friday’s session cleaned up the overnight ATH at 6782.25 before printing a new RTH ATH at 6800 following early strength. However, the morning gains were quickly erased as the market retested the breakout point at 6757, where buyers stepped in. The key question now is whether buyers can continue defending the breakout or if sellers will manage to reject it.
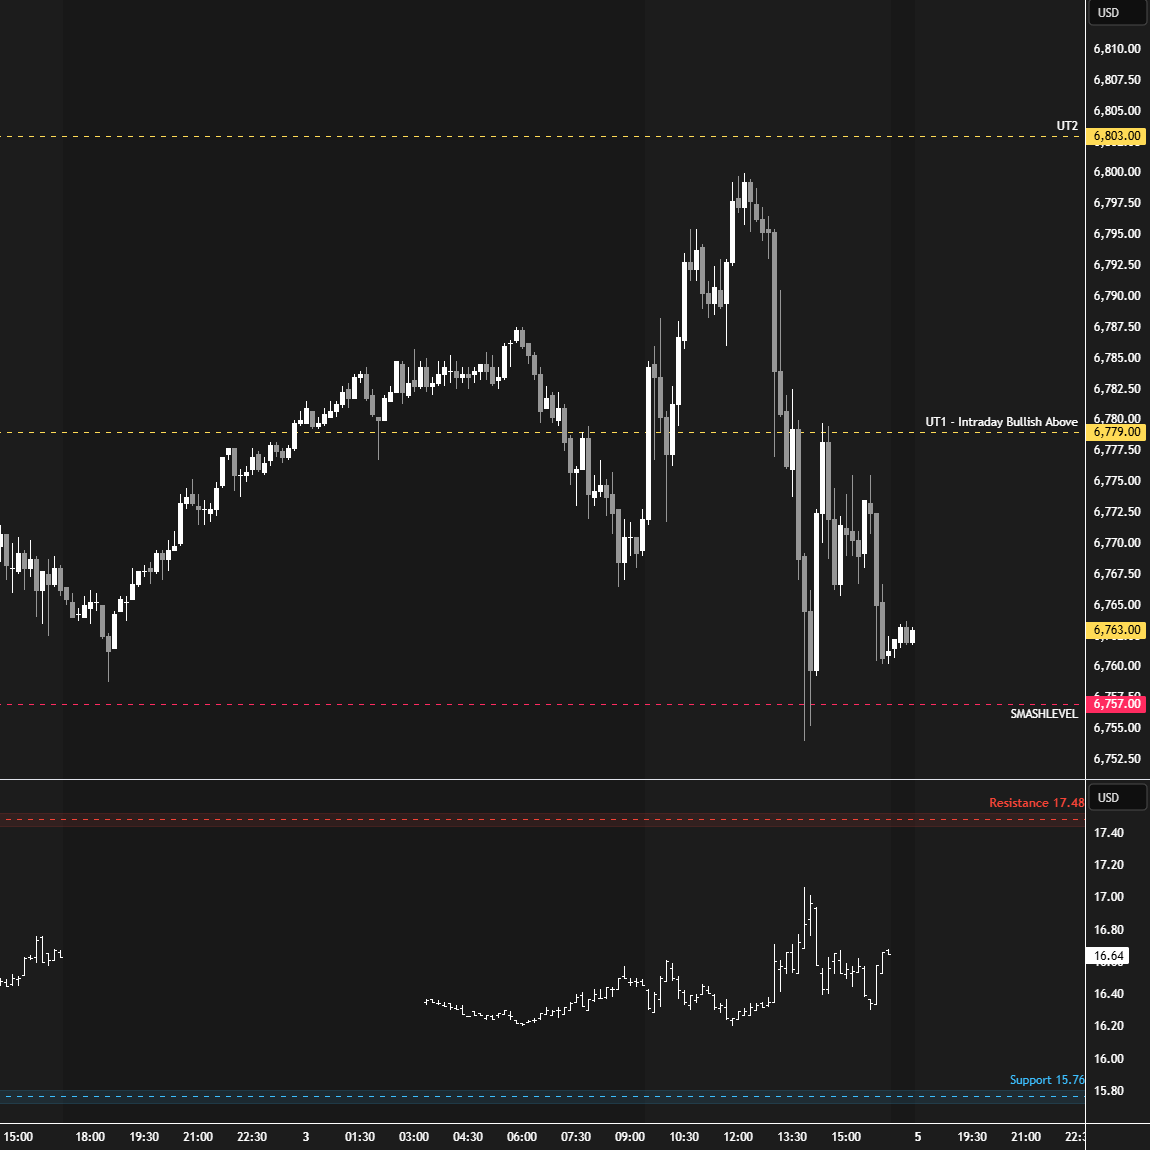
As discussed in the Weekly Plan, a strong market builds value above 6757, while sellers aim to break that level and end the daily one-time framing up, which could potentially trigger short-term weakness.
In terms of levels, the Smashlevel is 6757—the prior ATH and breakout point. Holding above 6757 keeps the breakout intact and targets Friday’s VPOC at 6779 (UT1). Acceptance above 6779 signals strength, targeting the RTH ATH at 6800 (UT2), with a final upside target (FUT) at 6822—the 200% IB extension—under sustained buying pressure.
On the flip side, failure to maintain 6757 would open the door to cleaning up Wednesday’s poor structure toward 6732 (DT1), with a final downside target (FDT) at 6712—the HVN—under sustained selling pressure.
Levels of Interest
Going into tomorrow’s session, I’ll closely observe the behavior around 6757.
Holding above 6757 would target 6779 / 6800 / 6822
Break and hold below 6757 would target 6732 / 6712
Additionally, pay attention to the following VIX levels: 17.52 and 15.78. These levels can provide confirmation of strength or weakness.
Break and hold above 6822 with VIX below 15.78 would confirm strength.
Break and hold below 6712 with VIX above 17.52 would confirm weakness.
Overall, it's important to exercise caution when trading outside of the highlighted yellow levels. A non-cooperative VIX may suggest possible reversals i.e trade setups.
Thanks Smash!
Hey smash. May I ask how you get your key levels for 6732 and 6712 ?