
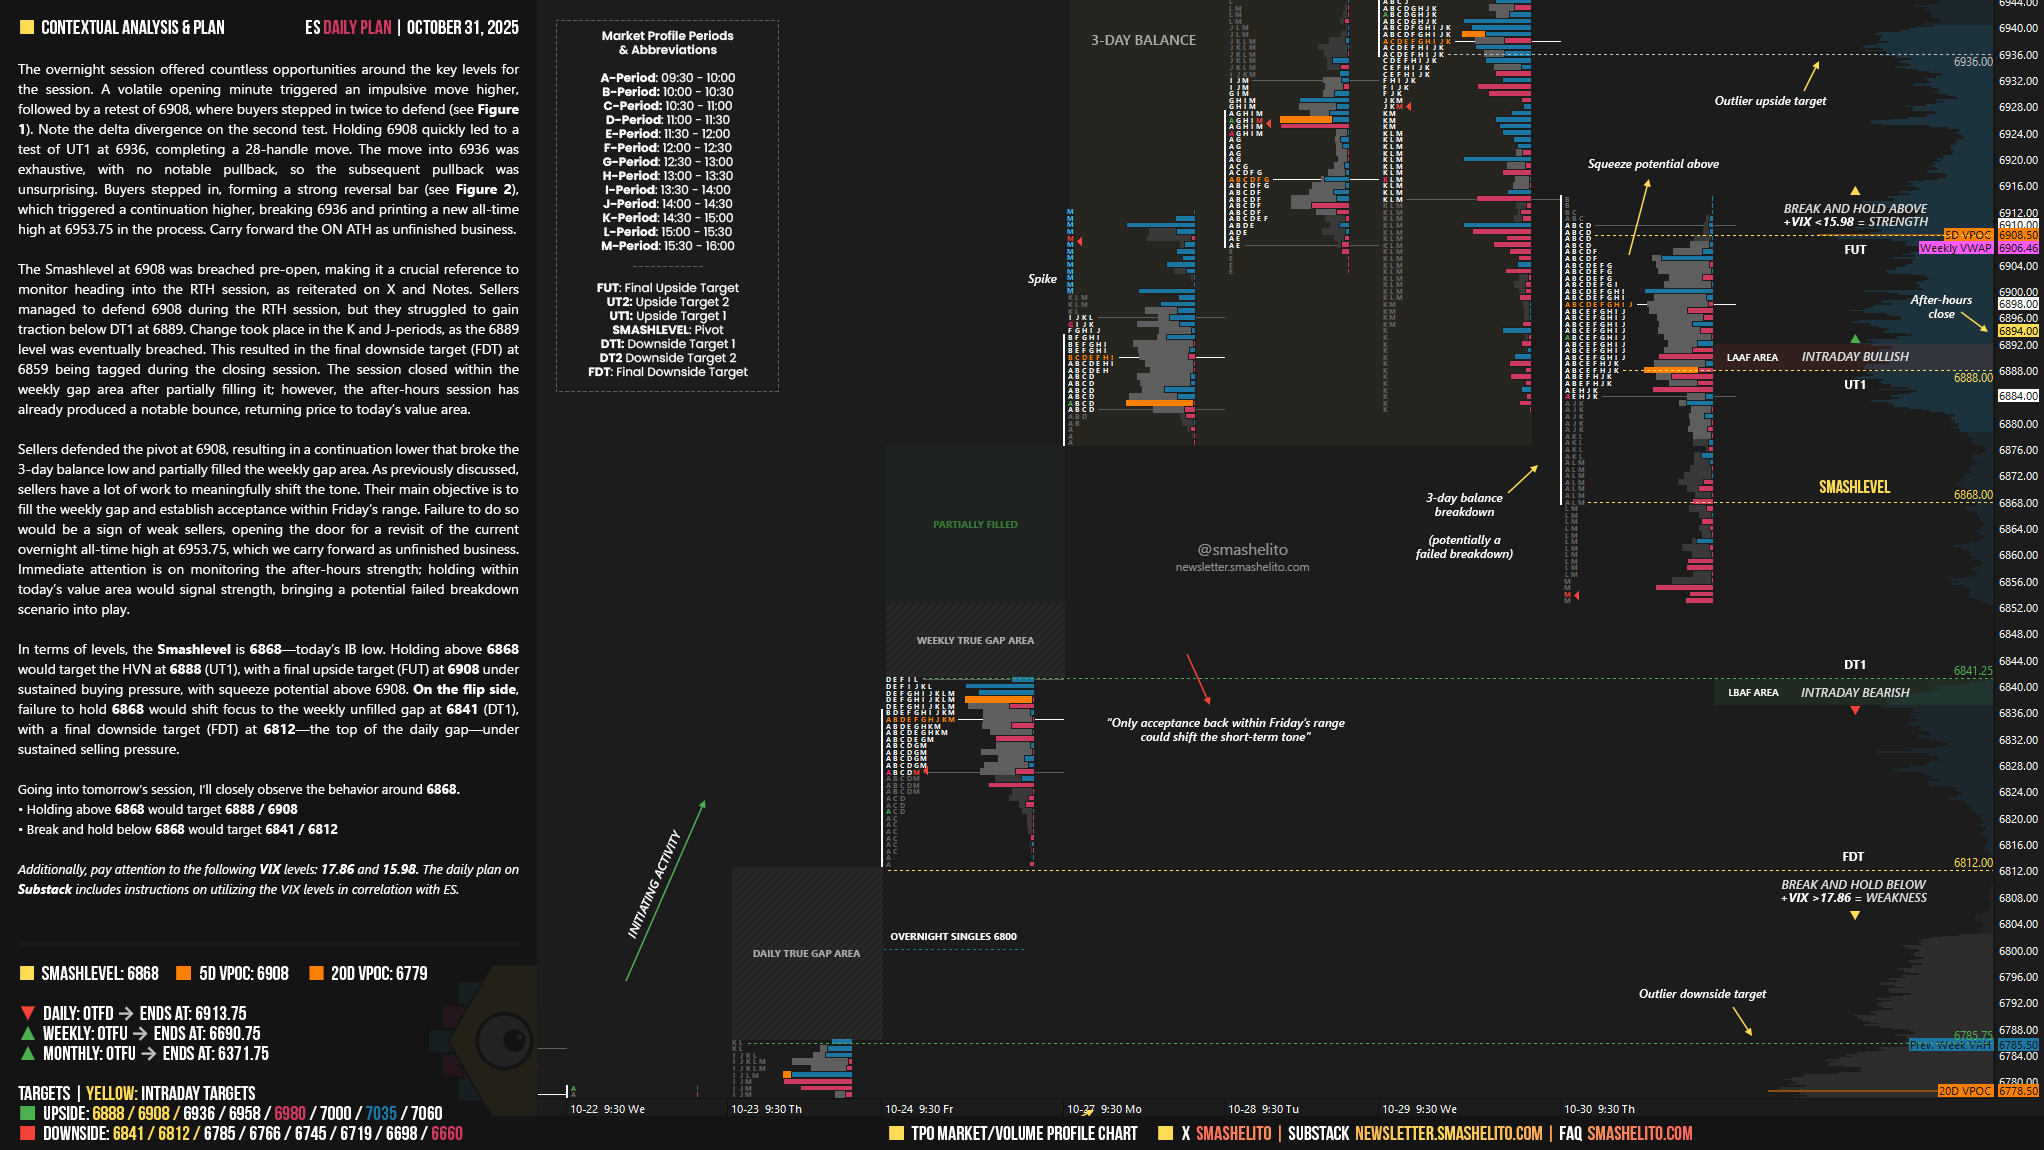
ES Daily Plan | October 31, 2025
Market Context & Key Levels for the Day Ahead

— For new subscribers
The yellow levels highlighted at the bottom left of the chart are the primary intraday levels I focus on. To avoid impulsive decisions at poor trade locations, I follow a simple but effective rule: exercise caution when initiating trades outside of these yellow levels.
This means I’m cautious about chasing longs above the Final Upside Target (FUT) and shorts below the Final Downside Target (FDT). It’s important to understand that not chasing does not imply initiating a trade in the opposite direction — discipline over impulse.
Be sure to review the Weekly Plan for a broader perspective, key levels, and market expectations for the week ahead.

Price can have three relationships to value: it can be above, below, or within it. “Responsive“ behavior aligns with expectations, while “Initiating“ behavior deviates from expectations.
Buying below value is expected and thus considered responsive activity.
Buying above value is unexpected and thus considered initiating activity.
Selling above value is expected and thus considered responsive activity.
Selling below value is unexpected and thus considered initiating activity.
For a more comprehensive understanding of these principles within the framework of Auction Market Theory (AMT), refer to CBOT - A Six-Part Study Guide to Market Profile.
Contextual Analysis & Plan
The overnight session offered countless opportunities around the key levels for the session. A volatile opening minute triggered an impulsive move higher, followed by a retest of 6908, where buyers stepped in twice to defend (see Figure 1). Note the delta divergence on the second test.
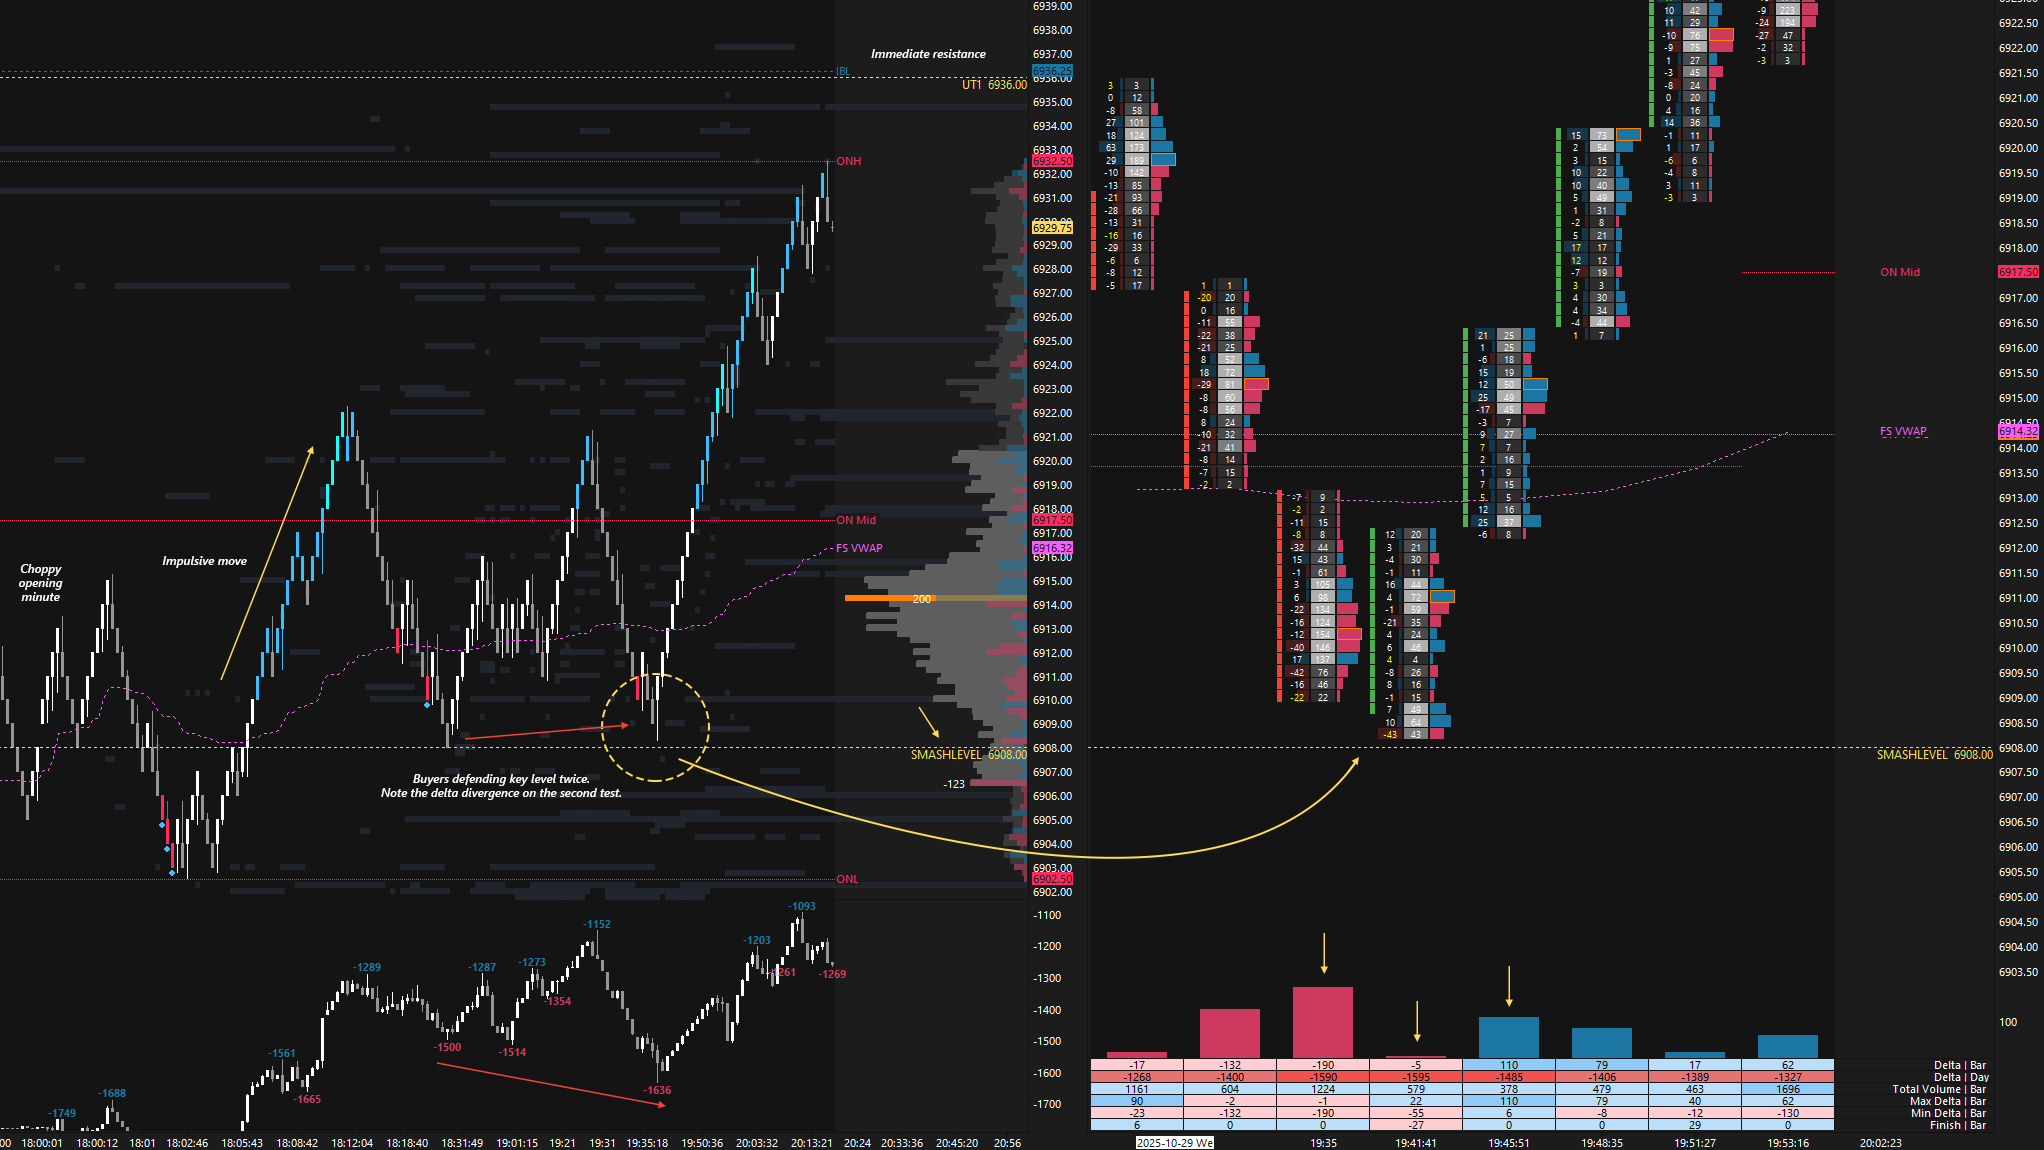
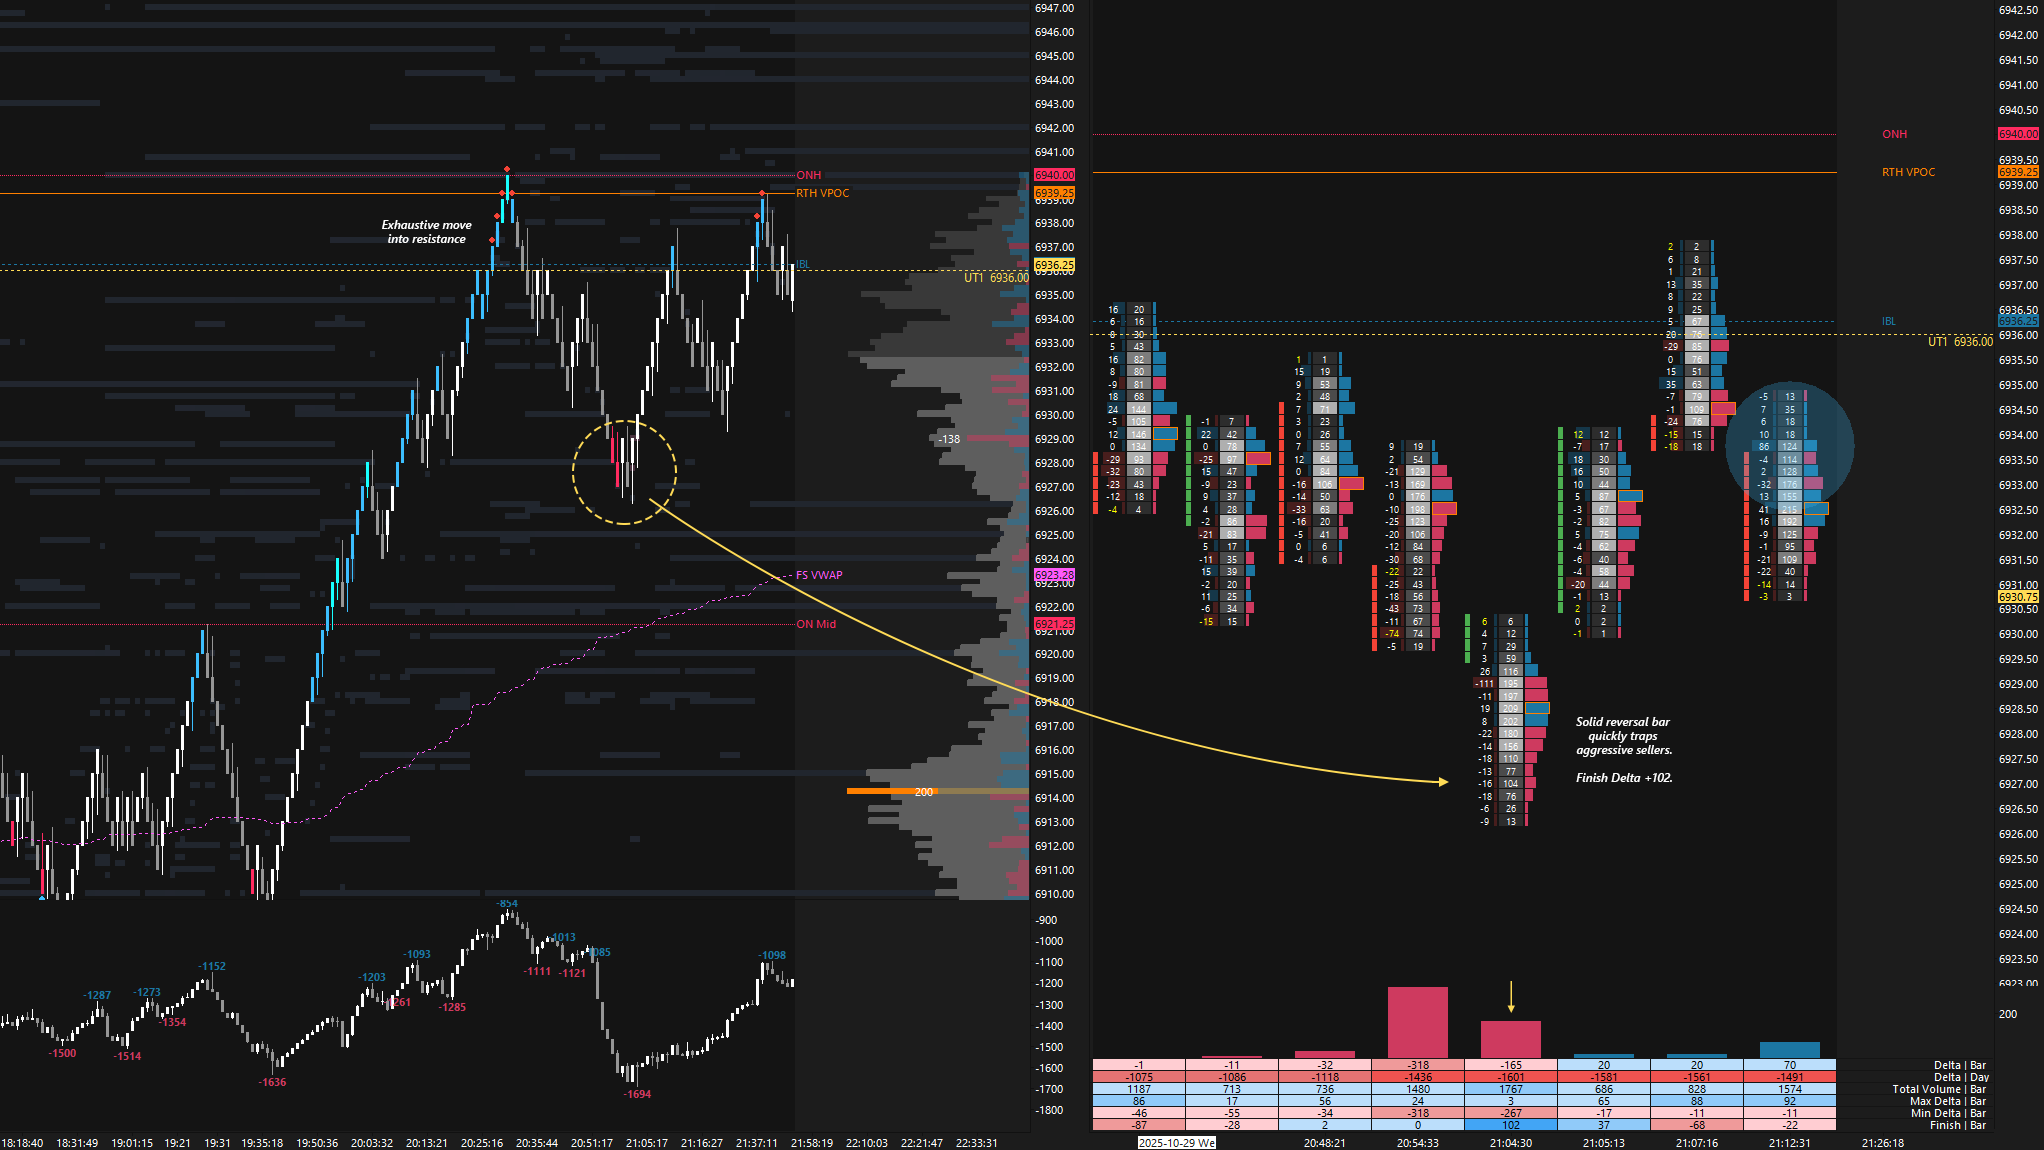
Holding 6908 quickly led to a test of UT1 at 6936, completing a 28-handle move. The move into 6936 was exhaustive, with no notable pullback, so the subsequent pullback was unsurprising. Buyers stepped in, forming a strong reversal bar (see Figure 2), which triggered a continuation higher, breaking 6936 and printing a new all-time high at 6953.75 in the process. Carry forward the ON ATH as unfinished business.
The Smashlevel at 6908 was breached pre-open, making it a crucial reference to monitor heading into the RTH session, as reiterated on X and Notes. Sellers managed to defend 6908 during the RTH session, but they struggled to gain traction below DT1 at 6889. Change took place in the K and J-periods, as the 6889 level was eventually breached. This resulted in the final downside target (FDT) at 6859 being tagged during the closing session. The session closed within the weekly gap area after partially filling it; however, the after-hours session has already produced a notable bounce, returning price to today’s value area.
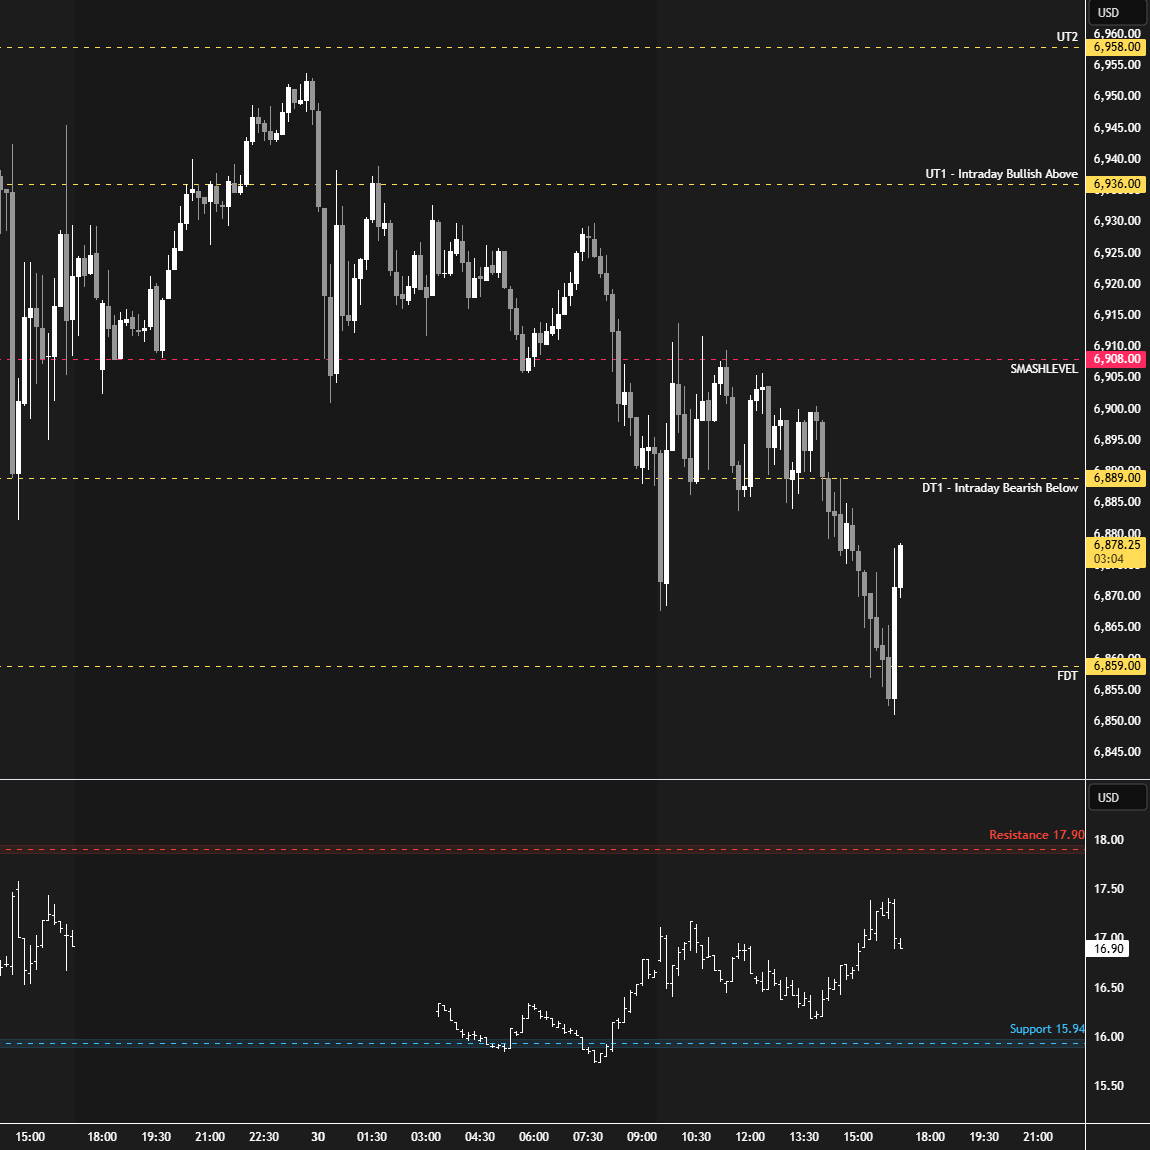
Sellers defended the pivot at 6908, resulting in a continuation lower that broke the 3-day balance low and partially filled the weekly gap area. As previously discussed, sellers have a lot of work to meaningfully shift the tone. Their main objective is to fill the weekly gap and establish acceptance within Friday’s range.
Failure to do so would be a sign of weak sellers, opening the door for a revisit of the current overnight all-time high at 6953.75, which we carry forward as unfinished business.
Immediate attention is on monitoring the after-hours strength; holding within today’s value area would signal strength, bringing a potential failed breakdown scenario into play.
In terms of levels, the Smashlevel is 6868—today’s IB low. Holding above 6868 would target the HVN at 6888 (UT1), with a final upside target (FUT) at 6908 under sustained buying pressure, with squeeze potential above 6908.
On the flip side, failure to hold 6868 would shift focus to the weekly unfilled gap at 6841 (DT1), with a final downside target (FDT) at 6812—the top of the daily gap—under sustained selling pressure.
Levels of Interest
Going into tomorrow’s session, I’ll closely observe the behavior around 6868.
Holding above 6868 would target 6888 / 6908
Break and hold below 6868 would target 6841 / 6812
Additionally, pay attention to the following VIX levels: 17.86 and 15.98. These levels can provide confirmation of strength or weakness.
Break and hold above 6908 with VIX below 15.98 would confirm strength.
Break and hold below 6812 with VIX above 17.86 would confirm weakness.
Overall, it's important to exercise caution when trading outside of the highlighted yellow levels. A non-cooperative VIX may suggest possible reversals i.e trade setups.
Thanks smash
In fact, in these examples above, the place of entry into the position is not the level per se, but the reaction from the level if it is confirmed through the order flow. That would then be what is called price risk, you get a "worse" entry price, but you have much more information. Thanks Smash...