
ES Daily Plan | October 29, 2025
Market Context & Key Levels for the Day Ahead

— For new subscribers
The yellow levels highlighted at the bottom left of the chart are the primary intraday levels I focus on. To avoid impulsive decisions at poor trade locations, I follow a simple but effective rule: exercise caution when initiating trades outside of these yellow levels.
This means I’m cautious about chasing longs above the Final Upside Target (FUT) and shorts below the Final Downside Target (FDT). It’s important to understand that not chasing does not imply initiating a trade in the opposite direction — discipline over impulse.
Be sure to review the Weekly Plan for a broader perspective, key levels, and market expectations for the week ahead.

Price can have three relationships to value: it can be above, below, or within it. “Responsive“ behavior aligns with expectations, while “Initiating“ behavior deviates from expectations.
Buying below value is expected and thus considered responsive activity.
Buying above value is unexpected and thus considered initiating activity.
Selling above value is expected and thus considered responsive activity.
Selling below value is unexpected and thus considered initiating activity.
For a more comprehensive understanding of these principles within the framework of Auction Market Theory (AMT), refer to CBOT - A Six-Part Study Guide to Market Profile.
Contextual Analysis & Plan
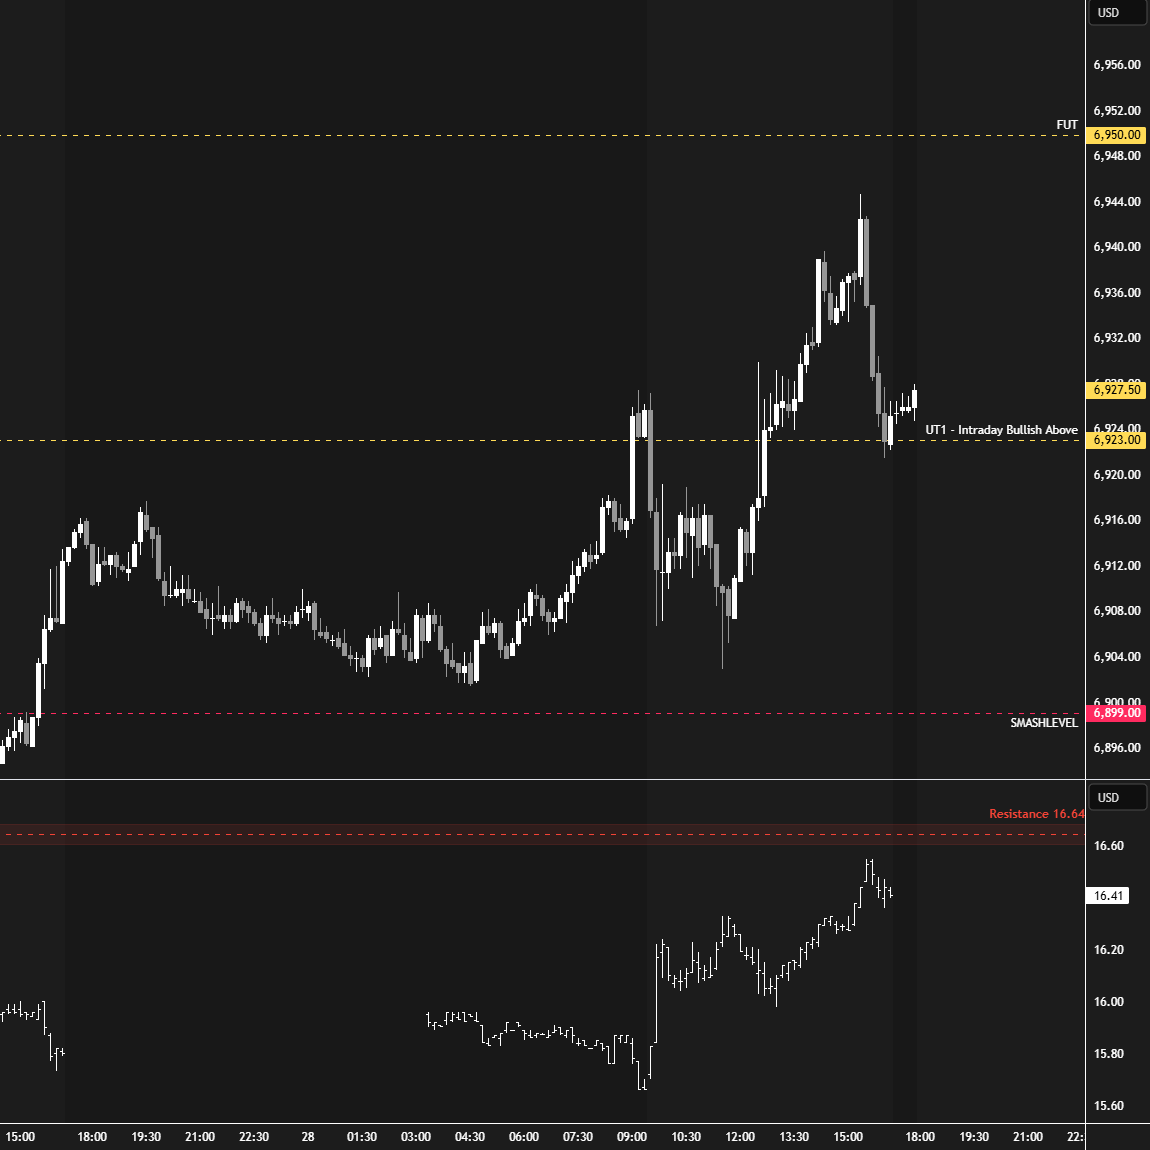
The overnight session looked above Monday’s spike area and failed early on, triggering a pullback. Buyers responded a couple of handles above the spike base at 6899 (ONL: 6901.50), leading to a continuation higher during the European session that tagged the UT1 at 6923.
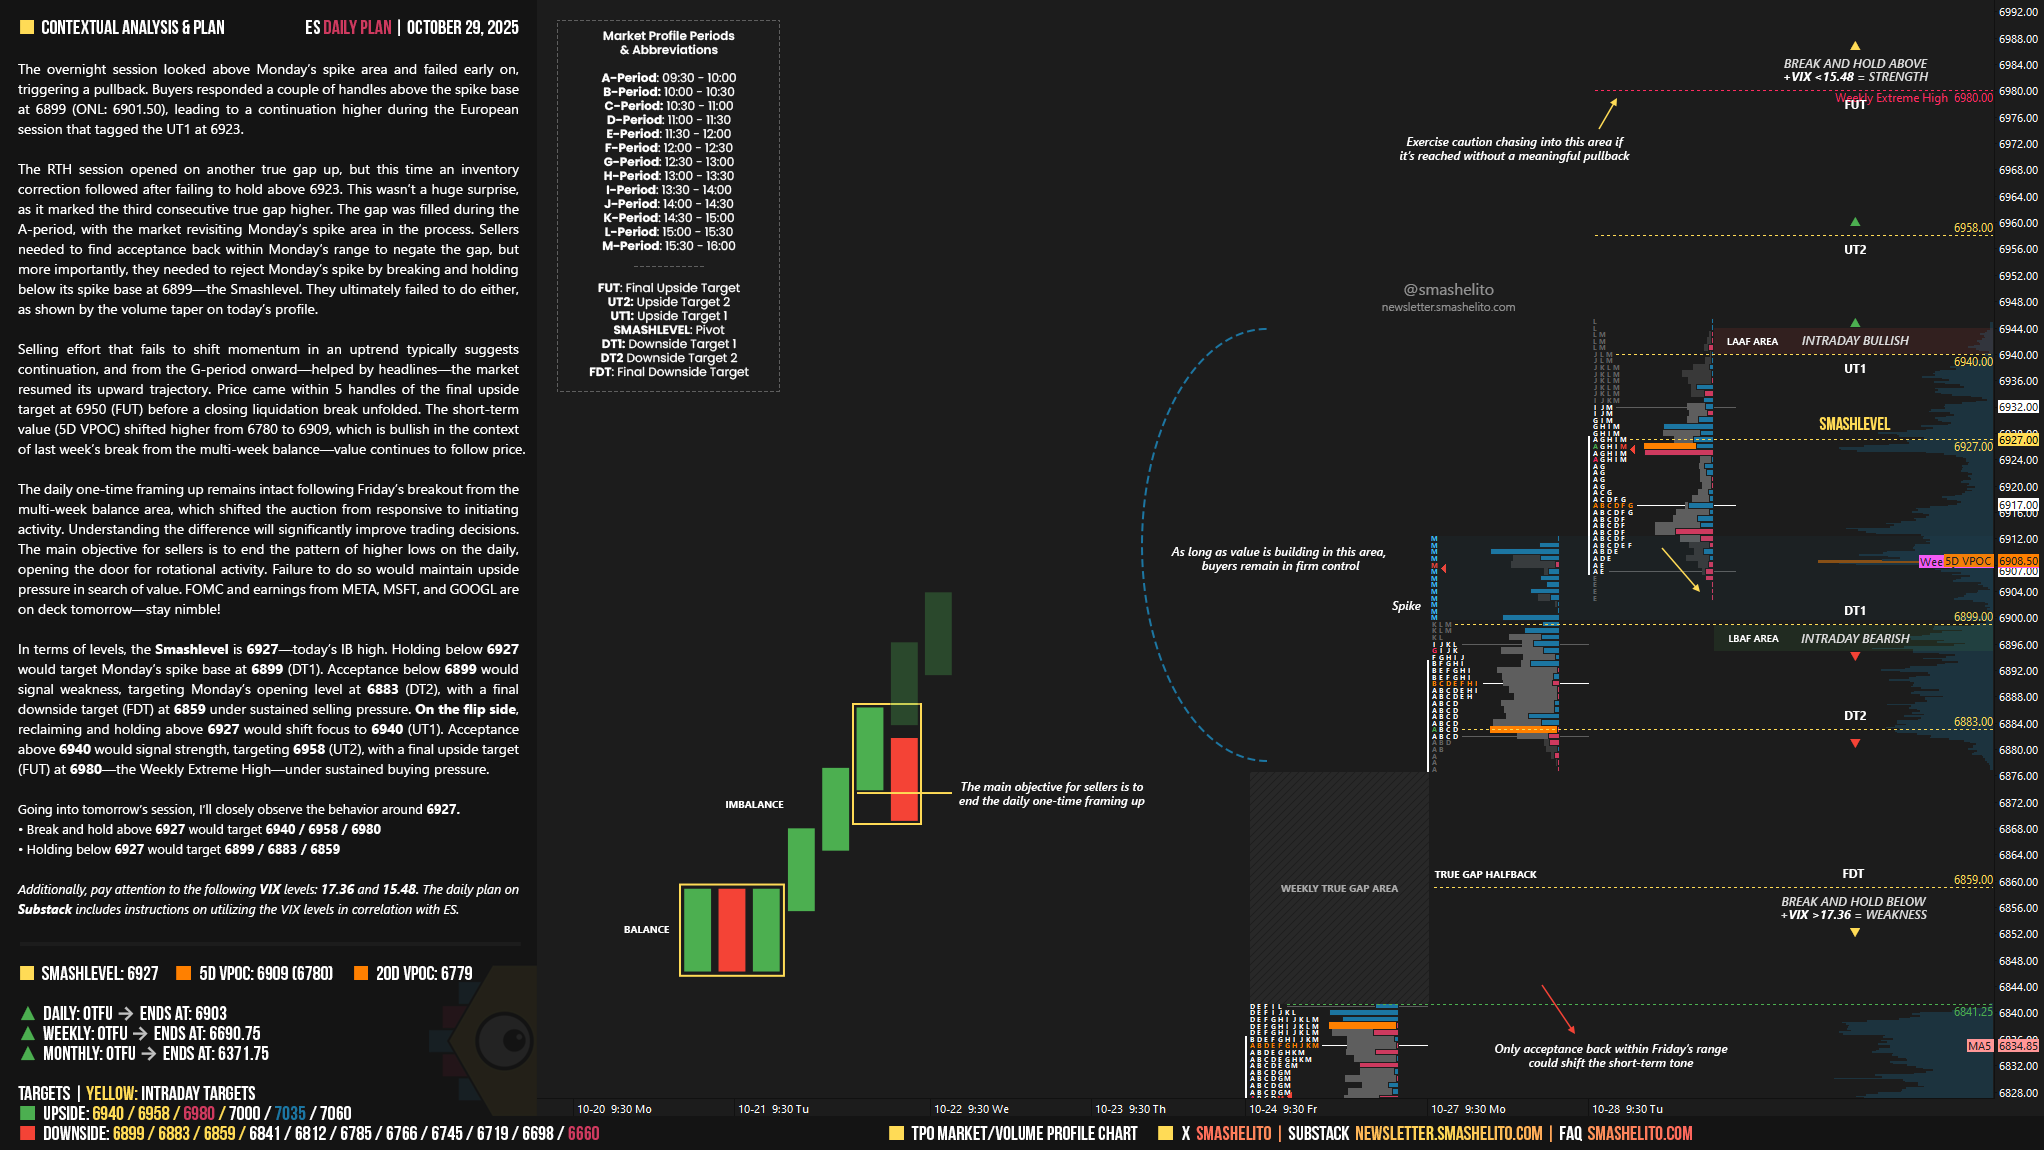
The RTH session opened on another true gap up, but this time an inventory correction followed after failing to hold above 6923. This wasn’t a huge surprise, as it marked the third consecutive true gap higher. The gap was filled during the A-period, with the market revisiting Monday’s spike area in the process. Sellers needed to find acceptance back within Monday’s range to negate the gap, but more importantly, they needed to reject Monday’s spike by breaking and holding below its spike base at 6899—the Smashlevel. They ultimately failed to do either, as shown by the volume taper on today’s profile.
Selling effort that fails to shift momentum in an uptrend typically suggests continuation, and from the G-period onward—helped by headlines—the market resumed its upward trajectory. Price came within 5 handles of the final upside target at 6950 (FUT) before a closing liquidation break unfolded. The short-term value (5D VPOC) shifted higher from 6780 to 6909, which is bullish in the context of last week’s break from the multi-week balance—value continues to follow price.
The daily one-time framing up remains intact following Friday’s breakout from the multi-week balance area, which shifted the auction from responsive to initiating activity. Understanding the difference will significantly improve trading decisions. The main objective for sellers is to end the pattern of higher lows on the daily, opening the door for rotational activity. Failure to do so would maintain upside pressure in search of value. FOMC and earnings from META, MSFT, and GOOGL are on deck tomorrow—stay nimble!
In terms of levels, the Smashlevel is 6927—today’s IB high. Holding below 6927 would target Monday’s spike base at 6899 (DT1). Acceptance below 6899 would signal weakness, targeting Monday’s opening level at 6883 (DT2), with a final downside target (FDT) at 6859 under sustained selling pressure.
On the flip side, reclaiming and holding above 6927 would shift focus to 6940 (UT1). Acceptance above 6940 would signal strength, targeting 6958 (UT2), with a final upside target (FUT) at 6980—the Weekly Extreme High—under sustained buying pressure.
Levels of Interest
Going into tomorrow’s session, I’ll closely observe the behavior around 6927.
Break and hold above 6927 would target 6940 / 6958 / 6980
Holding below 6927 would target 6899 / 6883 / 6859
Additionally, pay attention to the following VIX levels: 17.36 and 15.48. These levels can provide confirmation of strength or weakness.
Break and hold above 6980 with VIX below 15.48 would confirm strength.
Break and hold below 6859 with VIX above 17.36 would confirm weakness.
Overall, it's important to exercise caution when trading outside of the highlighted yellow levels. A non-cooperative VIX may suggest possible reversals i.e trade setups.
Thank you! Big day tomorrow!
How often are you combining profiles? I've been learning TPO and reading Steidlmayer on Markets. Besides clear ranges, I'm not sure if combining is beneficial.