
ES Daily Plan | October 28, 2025
Market Context & Key Levels for the Day Ahead

— For new subscribers
The yellow levels highlighted at the bottom left of the chart are the primary intraday levels I focus on. To avoid impulsive decisions at poor trade locations, I follow a simple but effective rule: exercise caution when initiating trades outside of these yellow levels.
This means I’m cautious about chasing longs above the Final Upside Target (FUT) and shorts below the Final Downside Target (FDT). It’s important to understand that not chasing does not imply initiating a trade in the opposite direction — discipline over impulse.
Be sure to review the Weekly Plan for a broader perspective, key levels, and market expectations for the week ahead.

Price can have three relationships to value: it can be above, below, or within it. “Responsive“ behavior aligns with expectations, while “Initiating“ behavior deviates from expectations.
Buying below value is expected and thus considered responsive activity.
Buying above value is unexpected and thus considered initiating activity.
Selling above value is expected and thus considered responsive activity.
Selling below value is unexpected and thus considered initiating activity.
For a more comprehensive understanding of these principles within the framework of Auction Market Theory (AMT), refer to CBOT - A Six-Part Study Guide to Market Profile.
Contextual Analysis & Plan
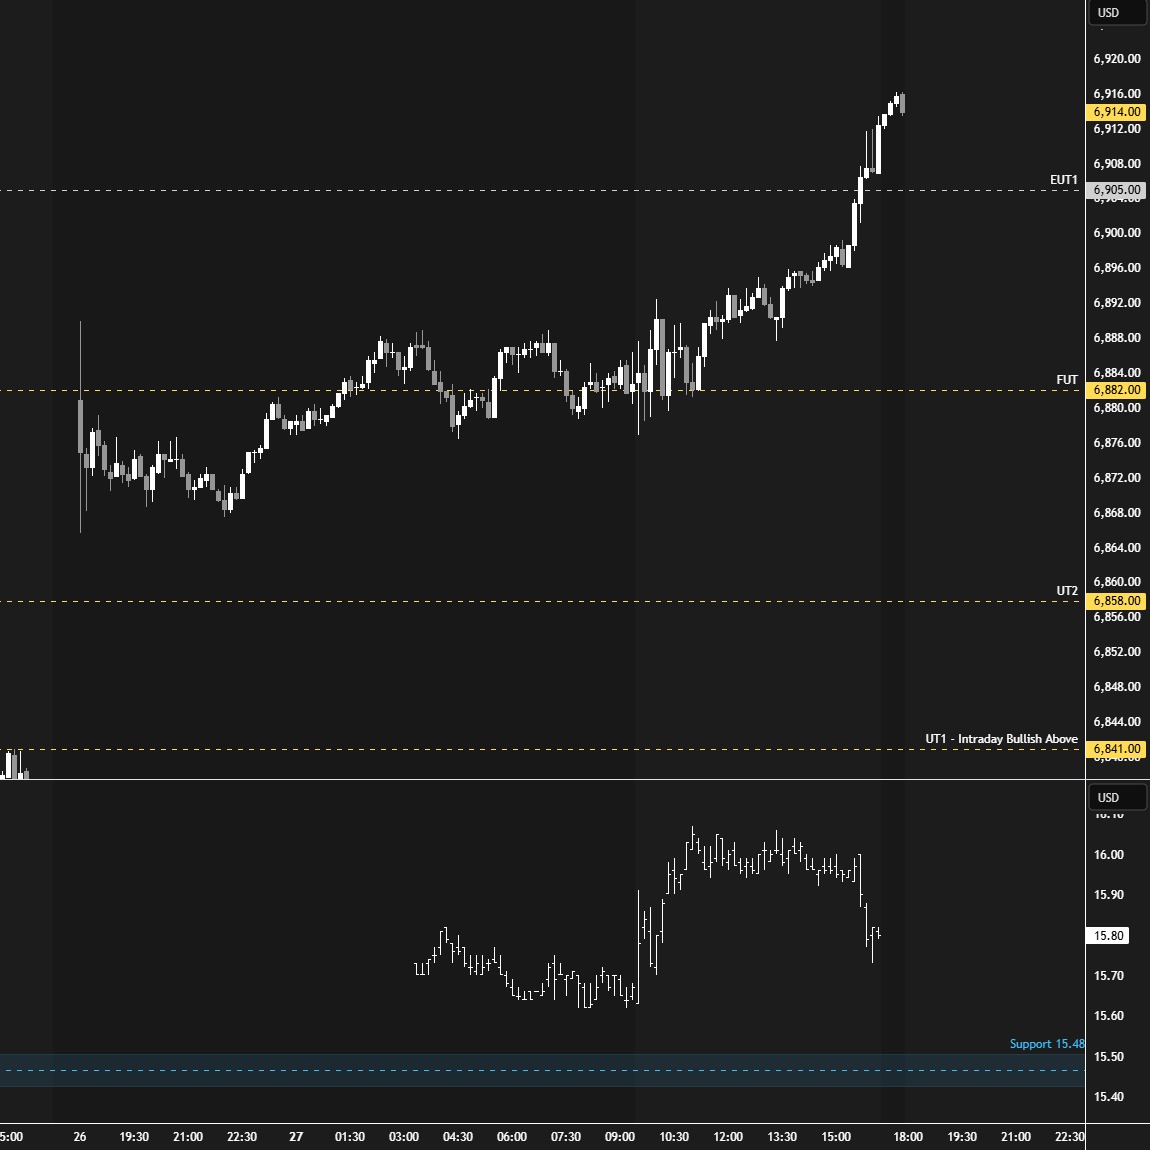
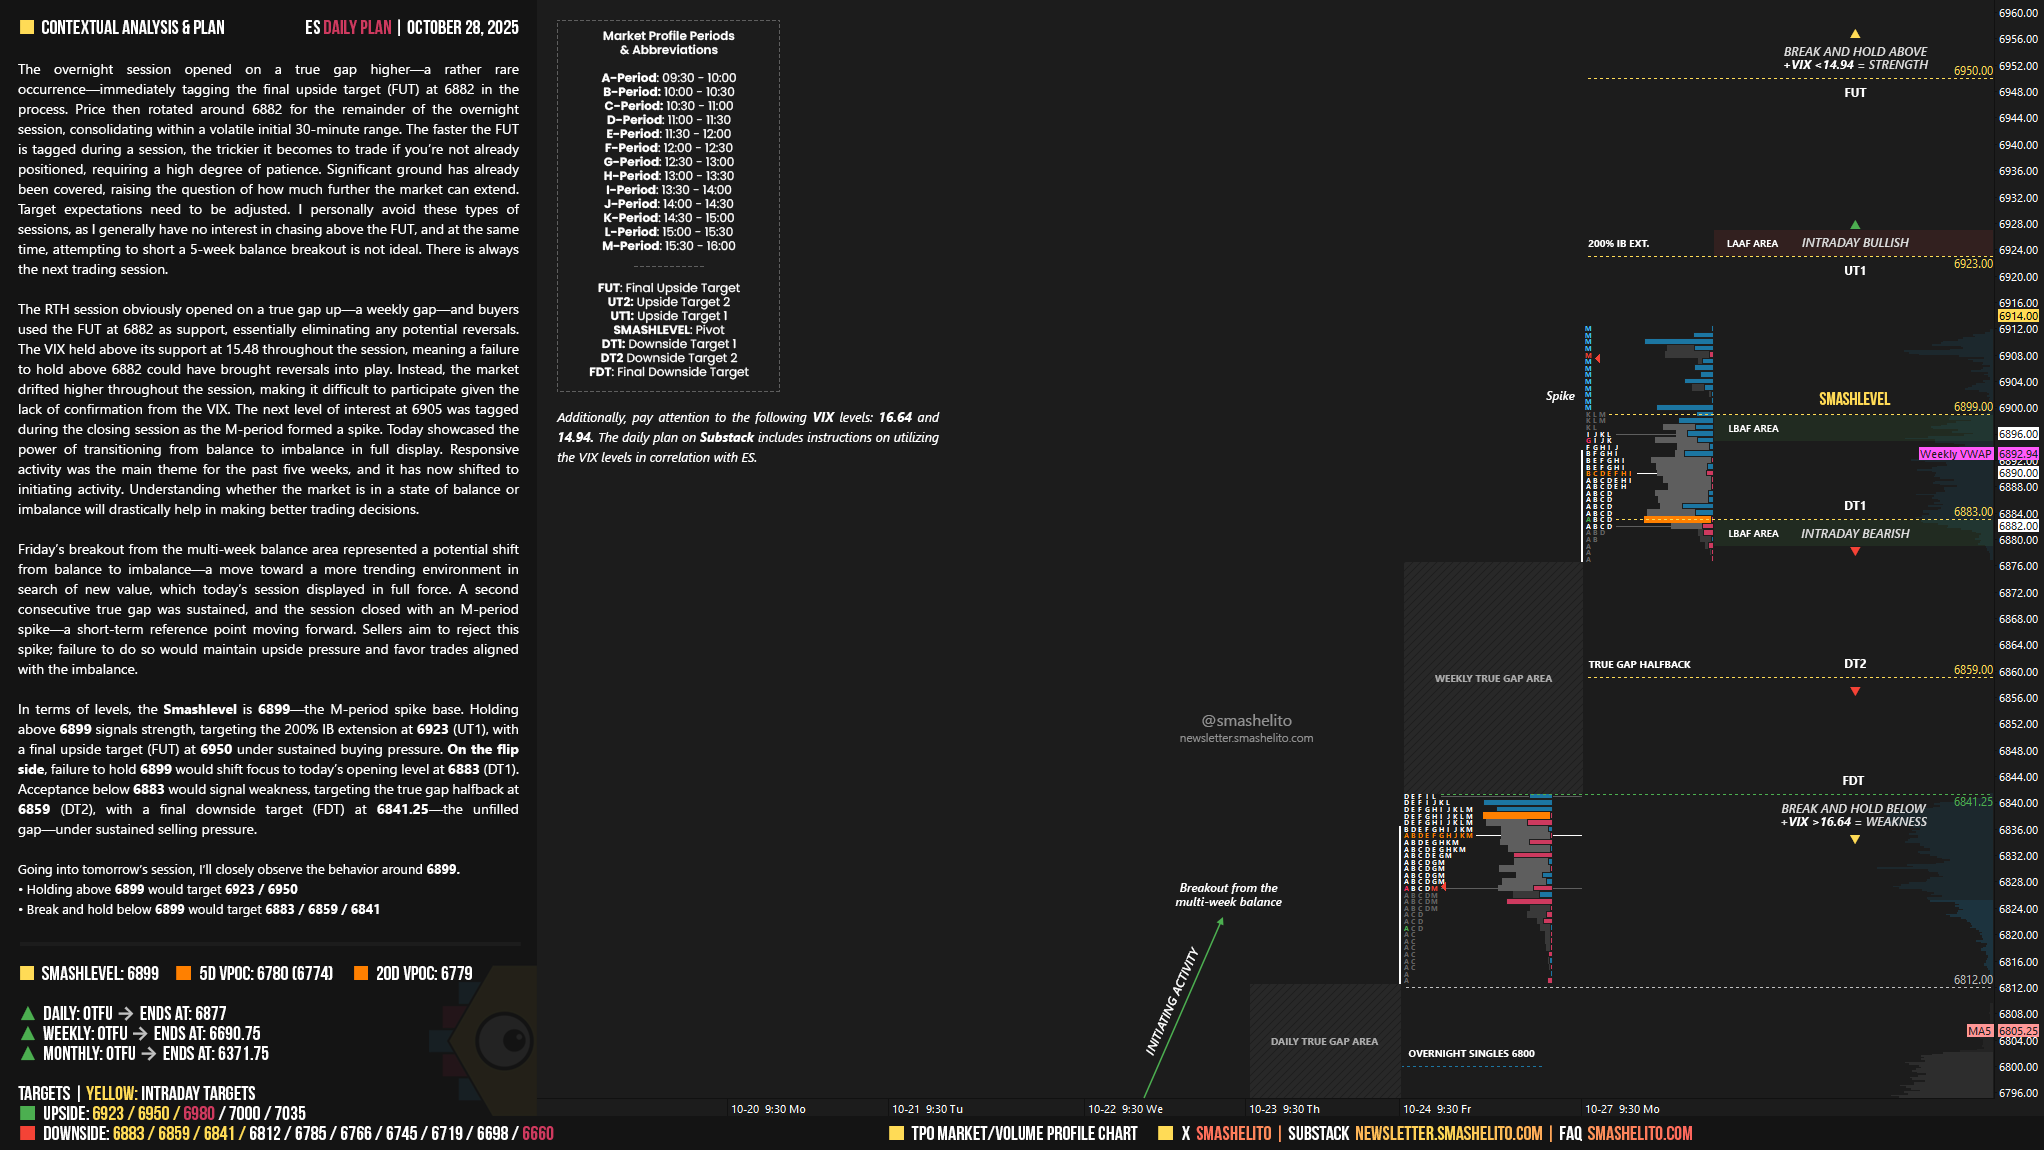
The overnight session opened on a true gap higher—a rather rare occurrence—immediately tagging the final upside target (FUT) at 6882 in the process. Price then rotated around 6882 for the remainder of the overnight session, consolidating within a volatile initial 30-minute range. The faster the FUT is tagged during a session, the trickier it becomes to trade if you’re not already positioned, requiring a high degree of patience. Significant ground has already been covered, raising the question of how much further the market can extend. Target expectations need to be adjusted. I personally avoid these types of sessions, as I generally have no interest in chasing above the FUT, and at the same time, attempting to short a 5-week balance breakout is not ideal. There is always the next trading session.
The RTH session obviously opened on a true gap up—a weekly gap—and buyers used the FUT at 6882 as support, essentially eliminating any potential reversals. The VIX held above its support at 15.48 throughout the session, meaning a failure to hold above 6882 could have brought reversals into play. Instead, the market drifted higher throughout the session, making it difficult to participate given the lack of confirmation from the VIX. The next level of interest at 6905 was tagged during the closing session as the M-period formed a spike. Today showcased the power of transitioning from balance to imbalance in full display. Responsive activity was the main theme for the past five weeks, and it has now shifted to initiating activity. Understanding whether the market is in a state of balance or imbalance will drastically help in making better trading decisions.
Friday’s breakout from the multi-week balance area represented a potential shift from balance to imbalance—a move toward a more trending environment in search of new value, which today’s session displayed in full force. A second consecutive true gap was sustained, and the session closed with an M-period spike—a short-term reference point moving forward. Sellers aim to reject this spike; failure to do so would maintain upside pressure and favor trades aligned with the imbalance.
In terms of levels, the Smashlevel is 6899—the M-period spike base. Holding above 6899 signals strength, targeting the 200% IB extension at 6923 (UT1), with a final upside target (FUT) at 6950 under sustained buying pressure.
On the flip side, failure to hold 6899 would shift focus to today’s opening level at 6883 (DT1). Acceptance below 6883 would signal weakness, targeting the true gap halfback at 6859 (DT2), with a final downside target (FDT) at 6841.25—the unfilled gap—under sustained selling pressure.
Levels of Interest
Going into tomorrow’s session, I’ll closely observe the behavior around 6899.
Holding above 6899 would target 6923 / 6950
Break and hold below 6899 would target 6883 / 6859 / 6841
Additionally, pay attention to the following VIX levels: 16.64 and 14.94. These levels can provide confirmation of strength or weakness.
Break and hold above 6950 with VIX below 14.94 would confirm strength.
Break and hold below 6841 with VIX above 16.64 would confirm weakness.
Overall, it's important to exercise caution when trading outside of the highlighted yellow levels. A non-cooperative VIX may suggest possible reversals i.e trade setups.
Smash, when you mention the above and then this "Understanding whether the market is in a state of balance or imbalance will drastically help in making better trading decisions." the main idea or objective is that it increases the probability of joining the Buying initiating activity., not looking so much for the Selling responsive activity in the case of the OTFU. Since we're looking for two-way auction movement, when we get out of balance, is the idea really to slightly change the way we view the profile to look for initiative confirmations?
''The faster the FUT is tagged during a session, the trickier it becomes to trade if you’re not already positioned, requiring a high degree of patience. I personally avoid these types of sessions, as I generally have no interest in chasing above the FUT, and at the same time, attempting to short a 5-week balance breakout is not ideal. There is always the next trading session.'' Thank you for sharing useful insights, Smash, appreciated as always.