
ES Daily Plan | October 23, 2025
Market Context & Key Levels for the Day Ahead

— For new subscribers
The yellow levels highlighted at the bottom left of the chart are the primary intraday levels I focus on. To avoid impulsive decisions at poor trade locations, I follow a simple but effective rule: exercise caution when initiating trades outside of these yellow levels.
This means I’m cautious about chasing longs above the Final Upside Target (FUT) and shorts below the Final Downside Target (FDT). It’s important to understand that not chasing does not imply initiating a trade in the opposite direction — discipline over impulse.
Be sure to review the ES Weekly Plan | October 20-24, 2025 for a broader perspective, key levels, and market expectations for the week ahead.
Contextual Analysis & Plan
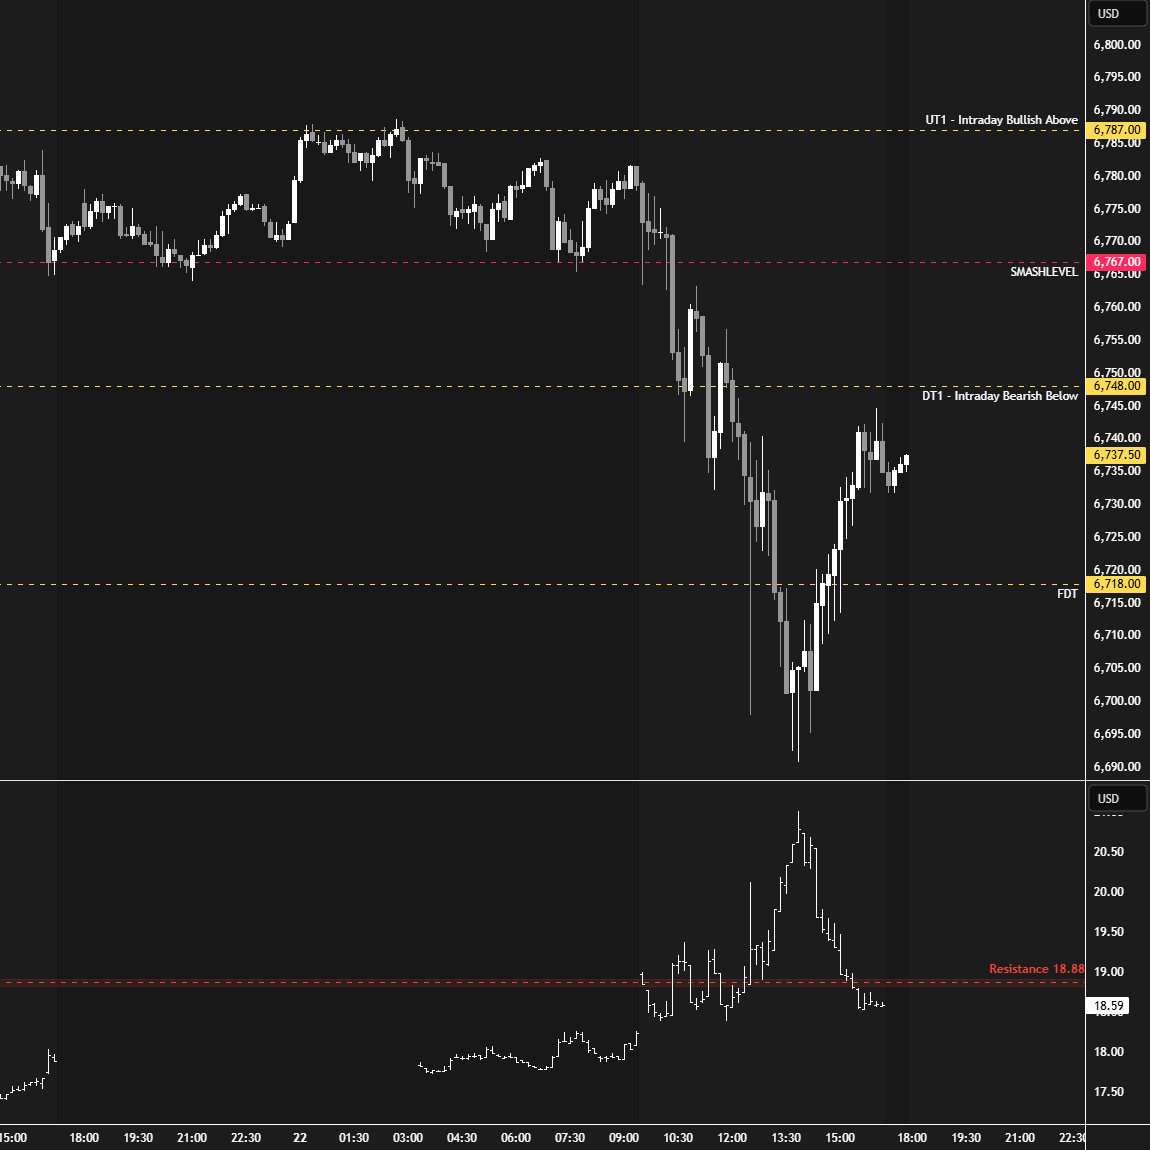
The overnight session was uneventful, trading within Tuesday’s range, with responsive sellers stepping in at UT1 6787 and buyers defending the Smashlevel at 6767, the pivot for the session. As discussed in the previous plan, only acceptance below 6767 could shift the short-term tone.
Change took place during the RTH session, with the B-period breaking below the 6767 level on notable negative delta (-6668). The C-period saw downside continuation, tagging and exceeding DT1 at 6748. Responsive buyers were active within Monday’s A-period excess, leading to a close of the C-period back within the initial balance range. The key question in the D-period was whether buyers could reclaim 6767, which would have opened the door for continuation higher.
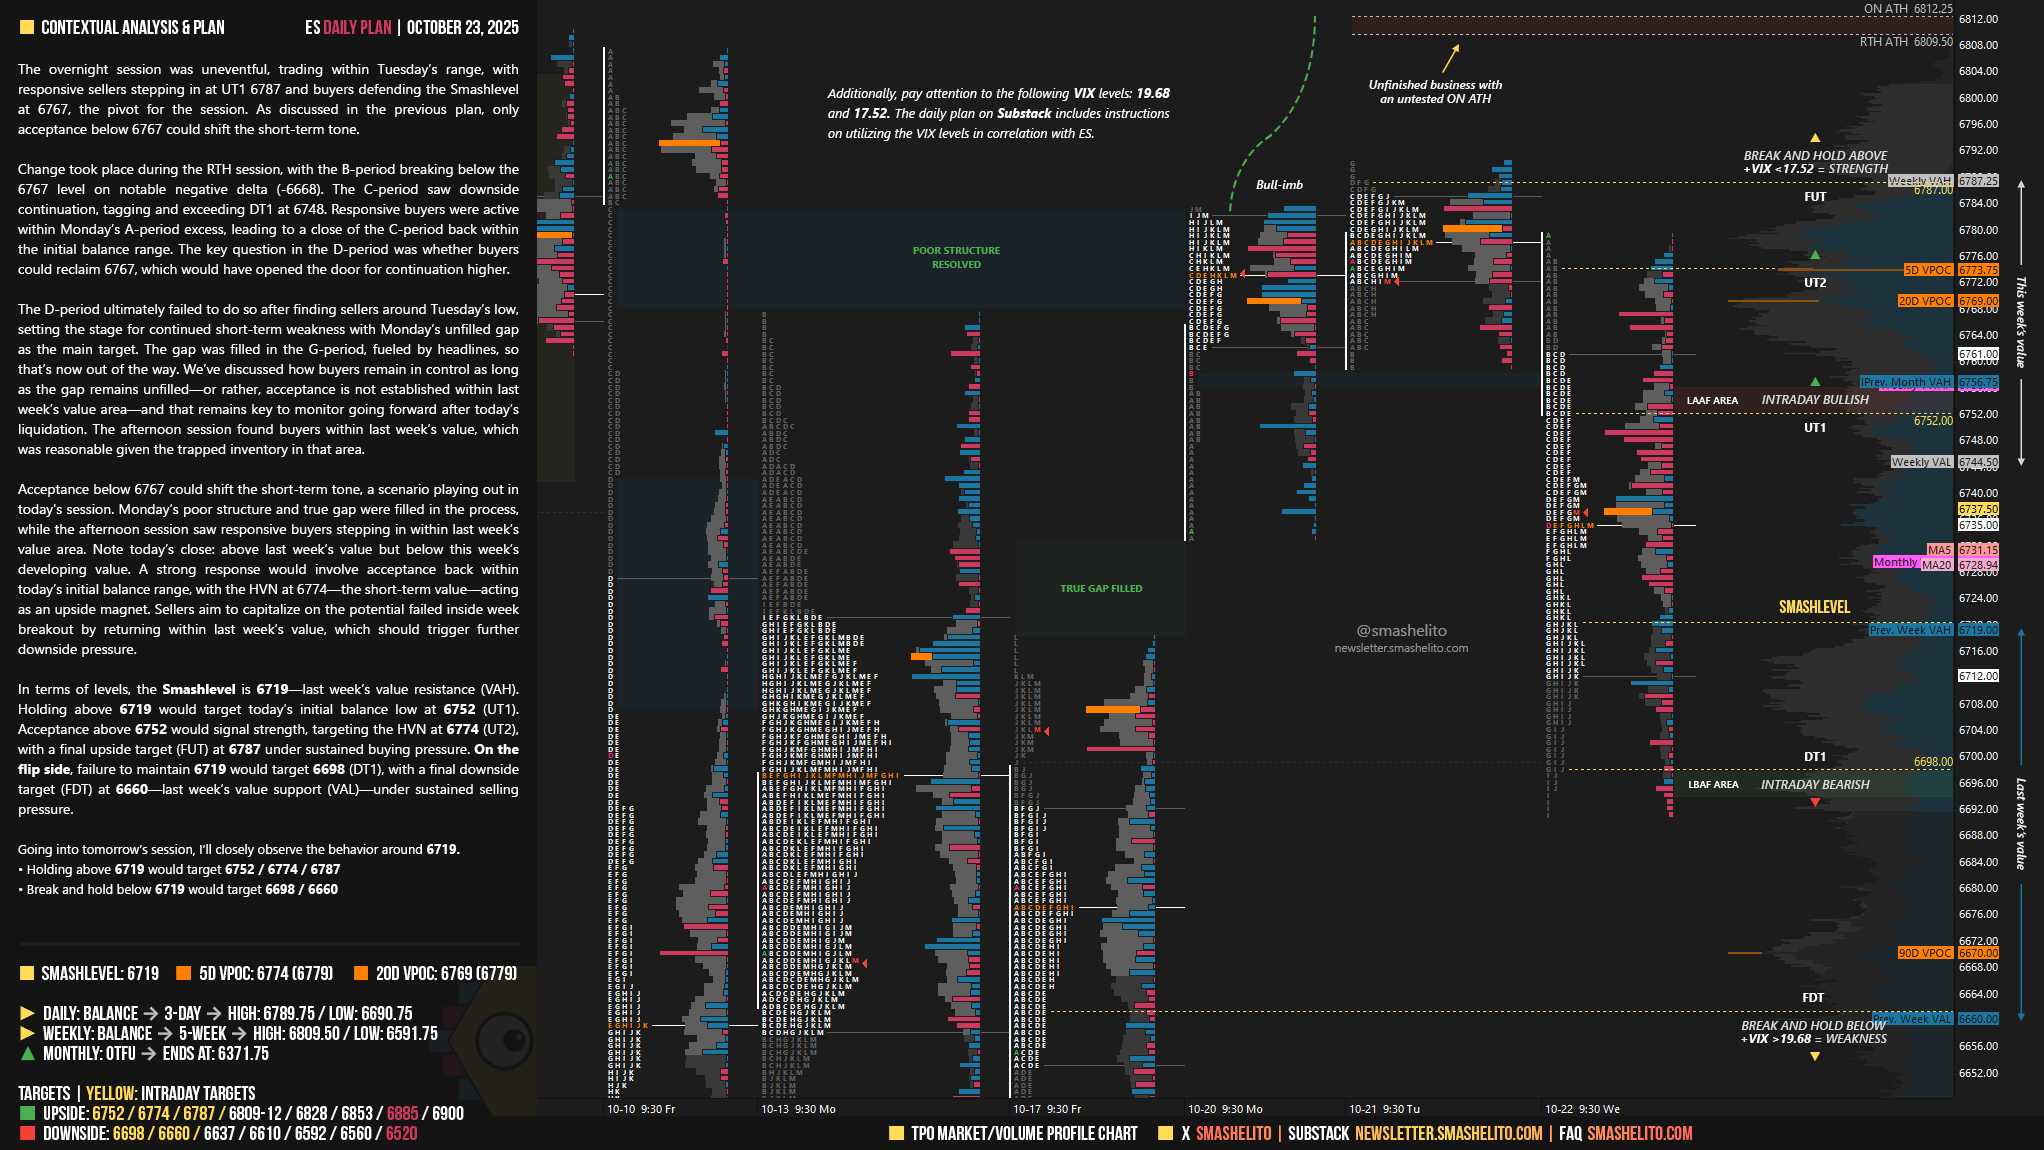
The D-period ultimately failed to do so after finding sellers around Tuesday’s low, setting the stage for continued short-term weakness with Monday’s unfilled gap as the main target. The gap was filled in the G-period, fueled by headlines, so that’s now out of the way. We’ve discussed how buyers remain in control as long as the gap remains unfilled—or rather, acceptance is not established within last week’s value area—and that remains key to monitor going forward after today’s liquidation. The afternoon session found buyers within last week’s value, which was reasonable given the trapped inventory in that area.
Acceptance below 6767 could shift the short-term tone, a scenario playing out in today’s session. Monday’s poor structure and true gap were filled in the process, while the afternoon session saw responsive buyers stepping in within last week’s value area.
Note today’s close: above last week’s value but below this week’s developing value. A strong response would involve acceptance back within today’s initial balance range, with the HVN at 6774—the short-term value—acting as an upside magnet. Sellers aim to capitalize on the potential failed inside week breakout by returning within last week’s value, which should trigger further downside pressure.
In terms of levels, the Smashlevel is 6719—last week’s value resistance (VAH). Holding above 6719 would target today’s initial balance low at 6752 (UT1). Acceptance above 6752 would signal strength, targeting the HVN at 6774 (UT2), with a final upside target (FUT) at 6787 under sustained buying pressure.
On the flip side, failure to maintain 6719 would target 6698 (DT1), with a final downside target (FDT) at 6660—last week’s value support (VAL)—under sustained selling pressure.
Levels of Interest
Going into tomorrow’s session, I’ll closely observe the behavior around 6719.
Holding above 6719 would target 6752 / 6774 / 6787
Break and hold below 6719 would target 6698 / 6660
Additionally, pay attention to the following VIX levels: 19.68 and 17.52. These levels can provide confirmation of strength or weakness.
Break and hold above 6787 with VIX below 17.52 would confirm strength.
Break and hold below 6660 with VIX above 19.68 would confirm weakness.
Overall, it's important to exercise caution when trading outside of the highlighted yellow levels. A non-cooperative VIX may suggest possible reversals i.e trade setups.
Thanks Smash!
Is the detail on the right side new? "Last week value" and "This week value." I hadn't noticed it in other newsletters. Thanks for everything, Smash!