
ES Daily Plan | October 22, 2025
Market Context & Key Levels for the Day Ahead

— For new subscribers
The yellow levels highlighted at the bottom left of the chart are the primary intraday levels I focus on. To avoid impulsive decisions at poor trade locations, I follow a simple but effective rule: exercise caution when initiating trades outside of these yellow levels.
This means I’m cautious about chasing longs above the Final Upside Target (FUT) and shorts below the Final Downside Target (FDT). It’s important to understand that not chasing does not imply initiating a trade in the opposite direction — discipline over impulse.
Be sure to review the ES Weekly Plan | October 20-24, 2025 for a broader perspective, key levels, and market expectations for the week ahead.
Contextual Analysis & Plan
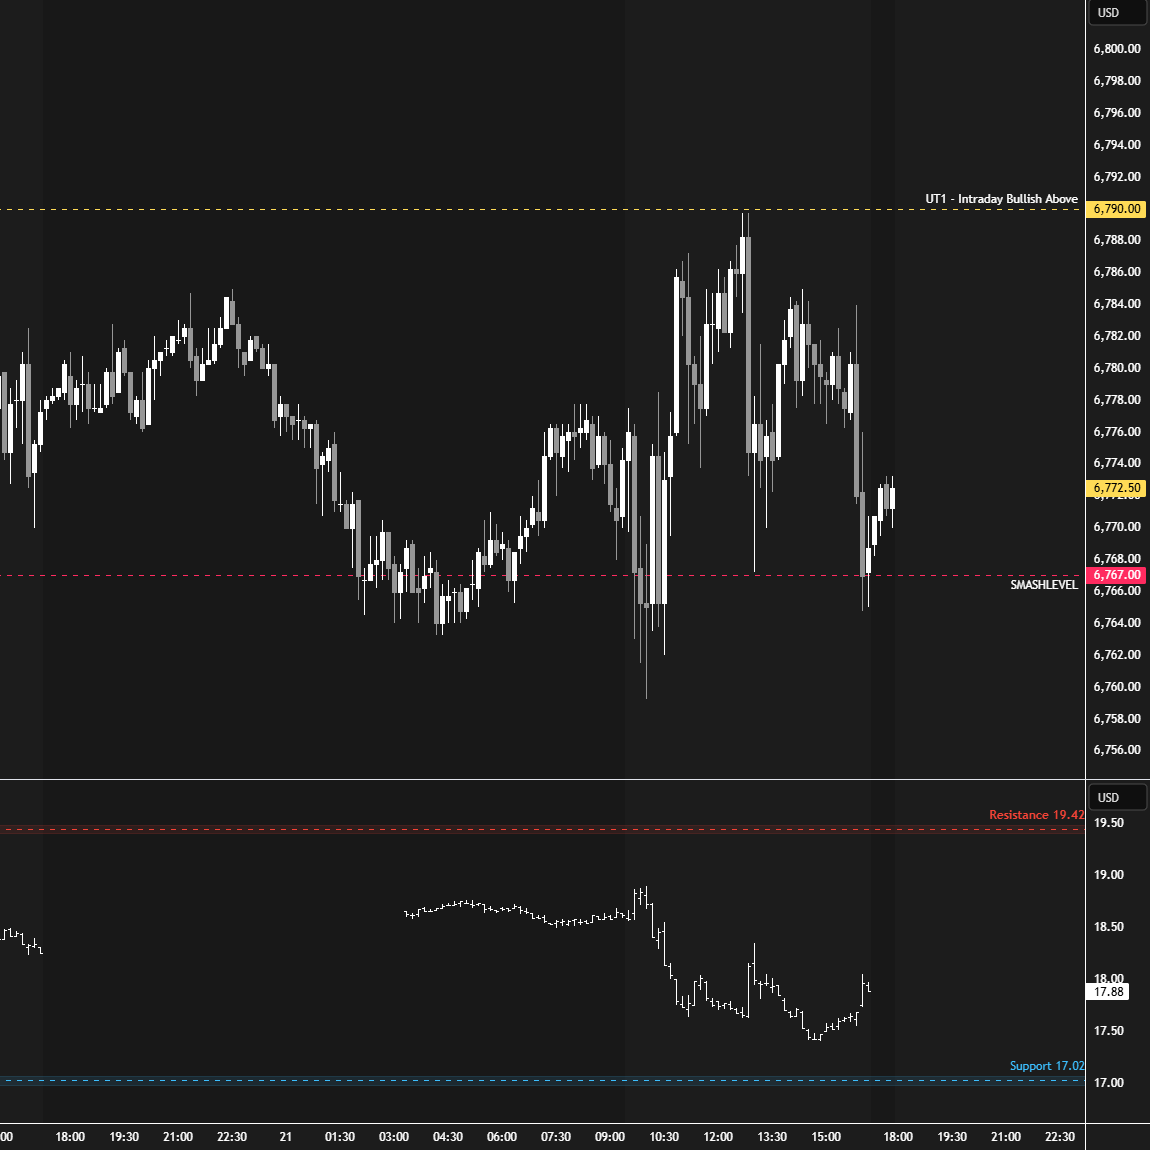
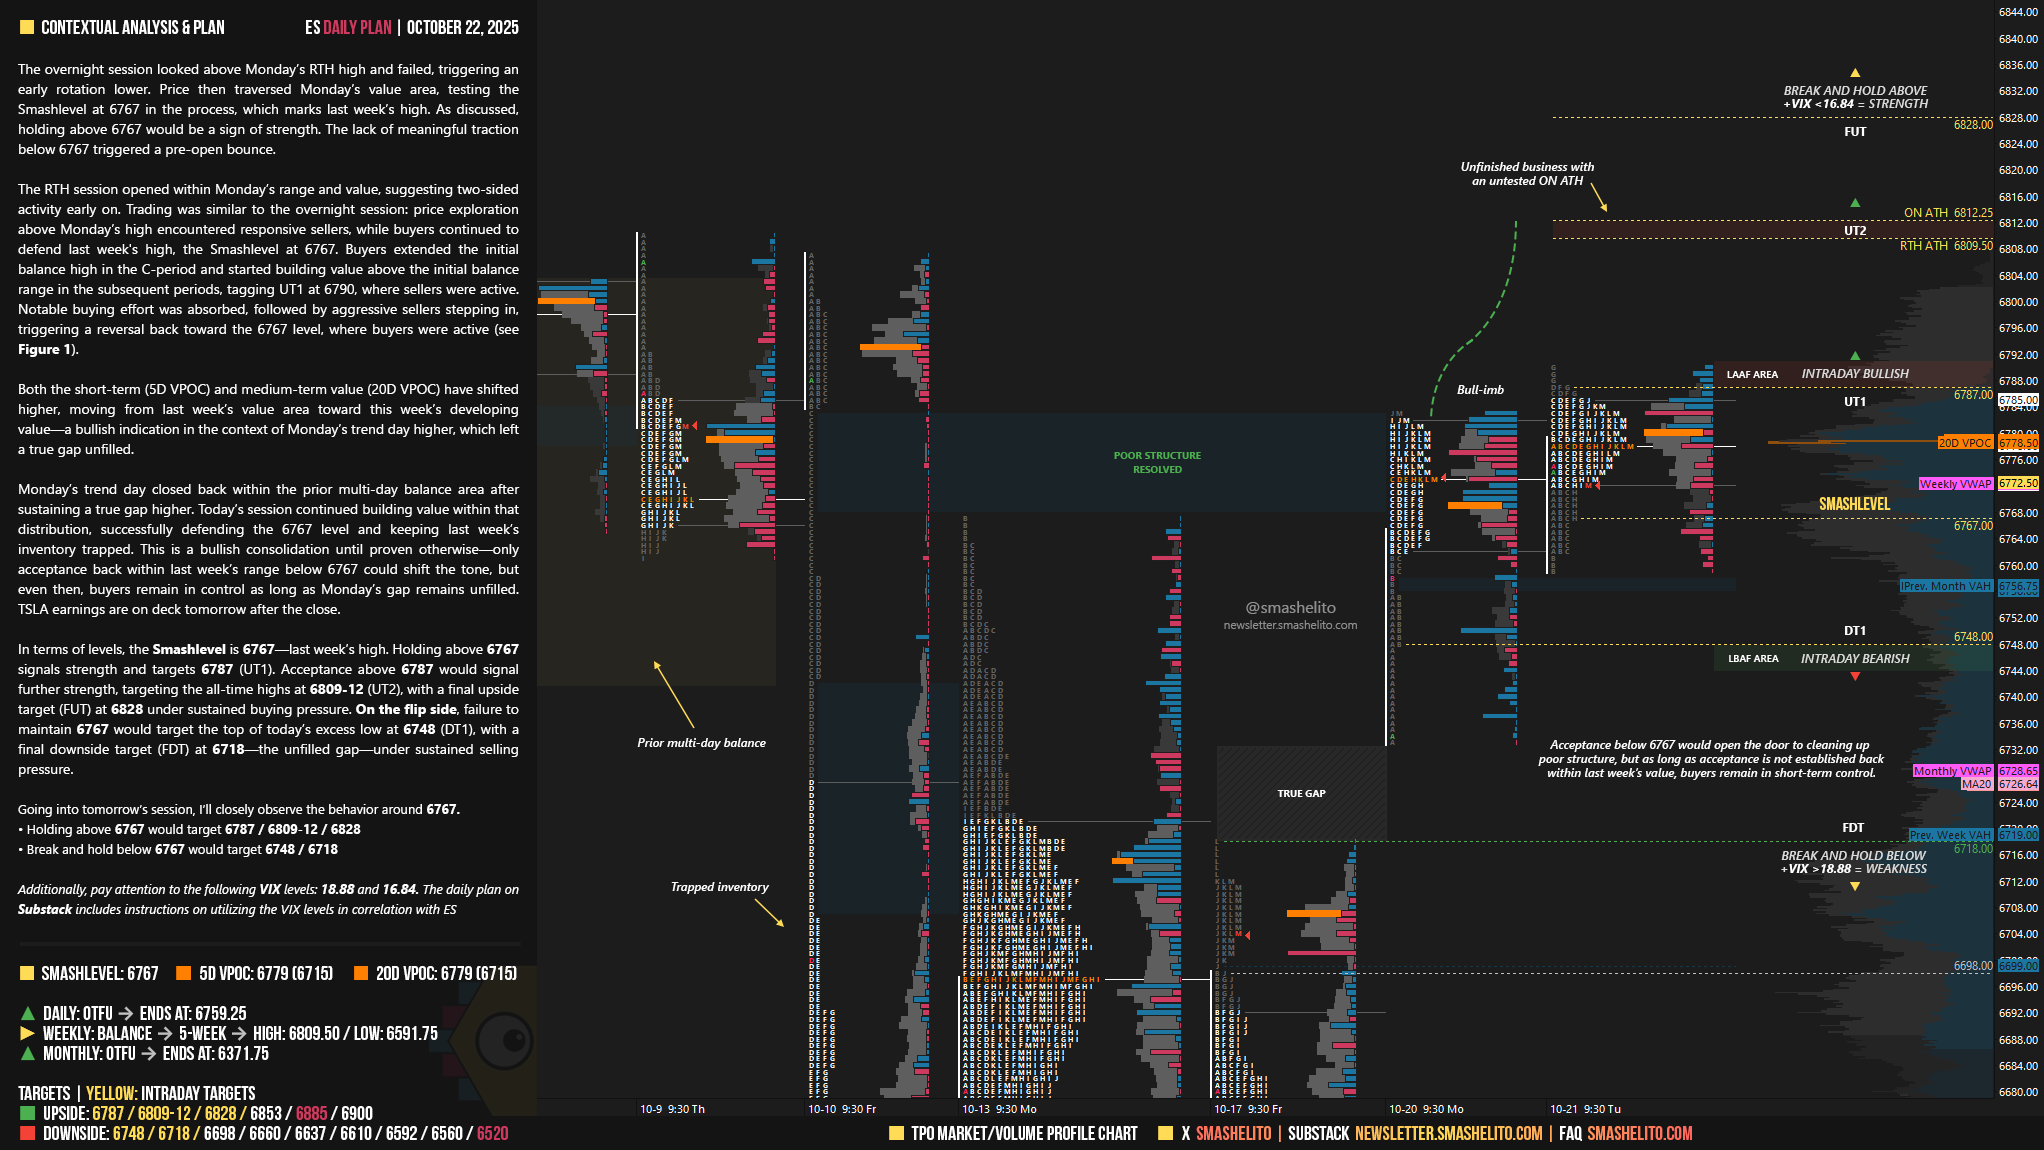
The overnight session looked above Monday’s RTH high and failed, triggering an early rotation lower. Price then traversed Monday’s value area, testing the Smashlevel at 6767 in the process, which marks last week’s high. As discussed, holding above 6767 would be a sign of strength. The lack of meaningful traction below 6767 triggered a pre-open bounce.
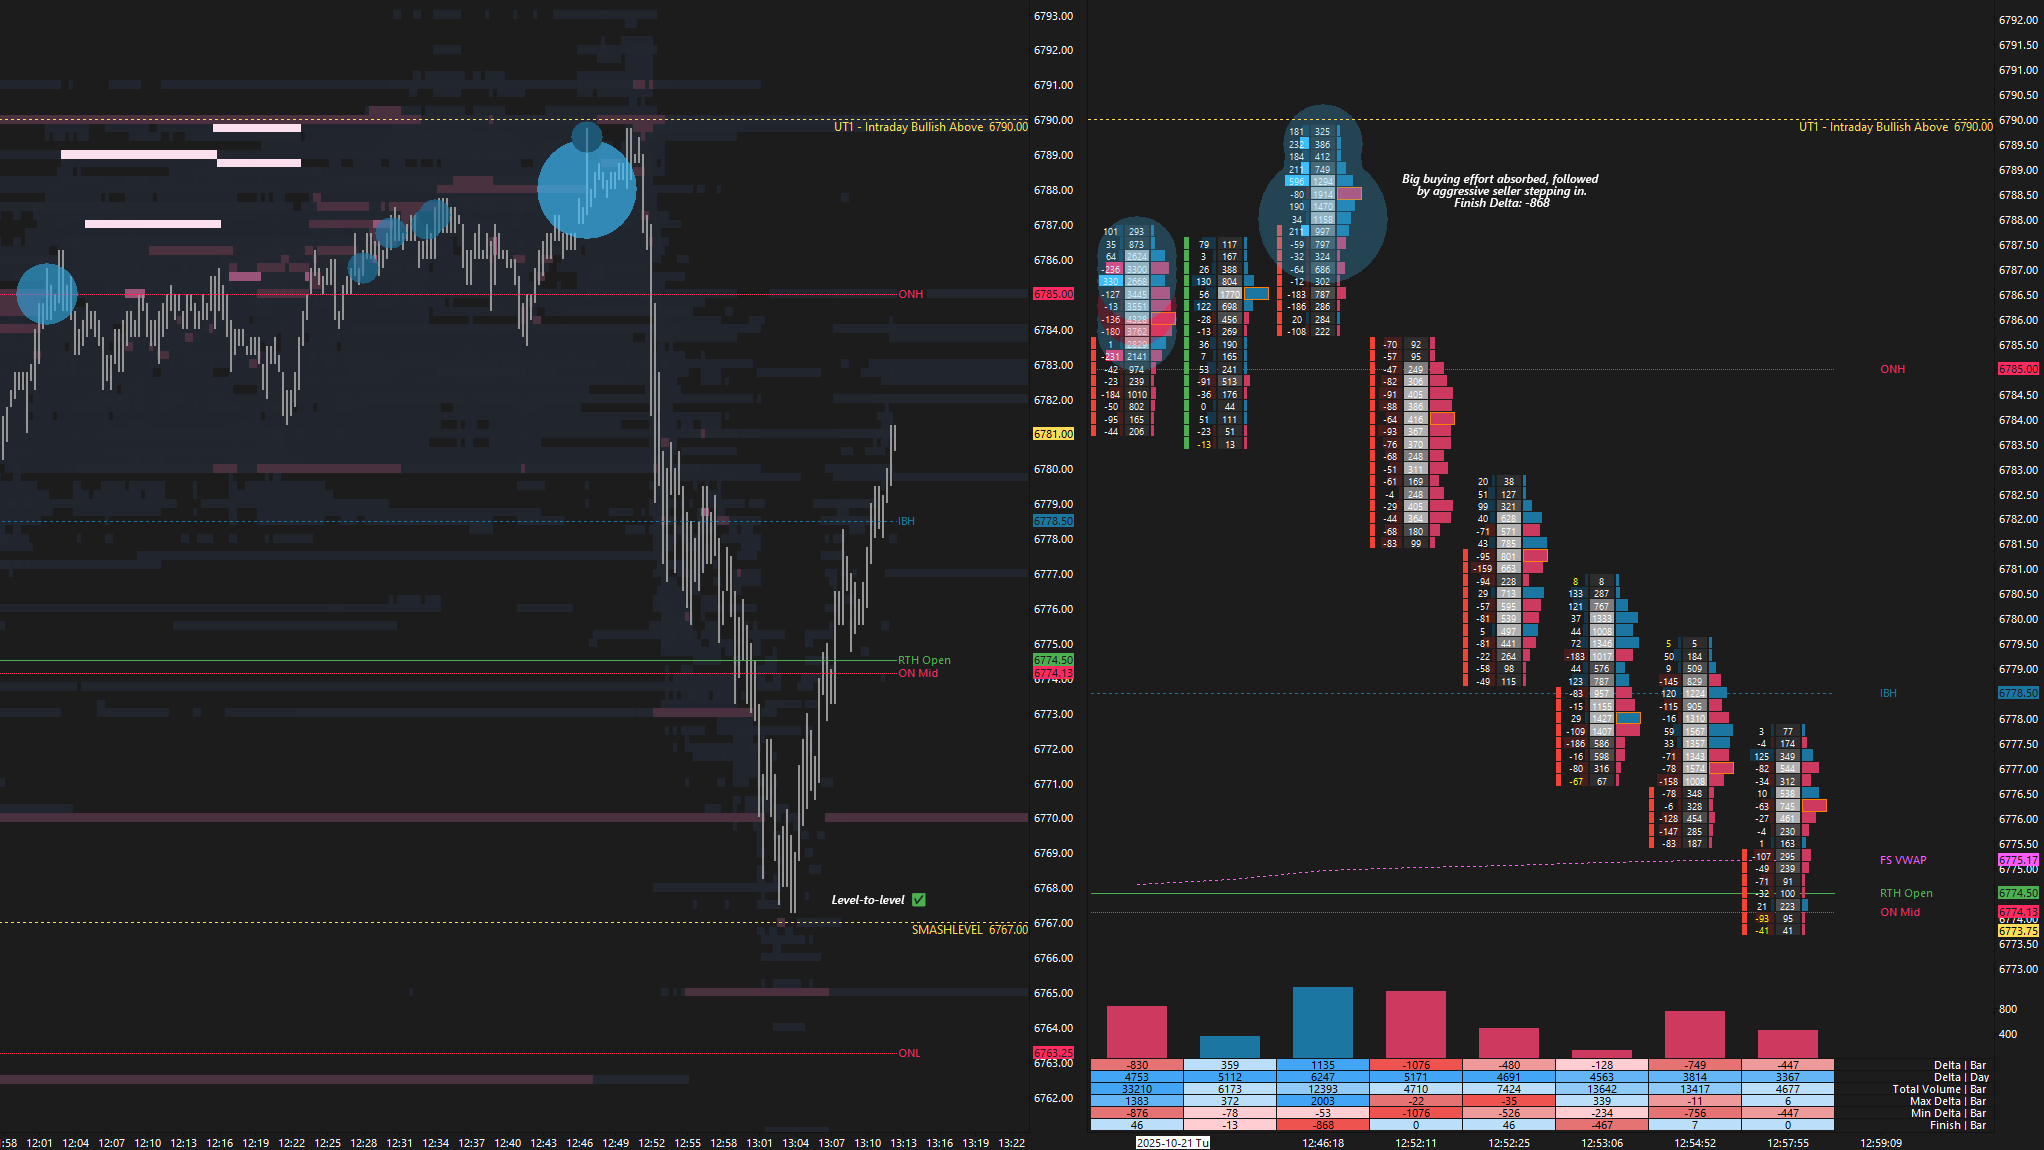
The RTH session opened within Monday’s range and value, suggesting two-sided activity early on. Trading was similar to the overnight session: price exploration above Monday’s high encountered responsive sellers, while buyers continued to defend last week’s high, the Smashlevel at 6767. Buyers extended the initial balance high in the C-period and started building value above the initial balance range in the subsequent periods, tagging UT1 at 6790, where sellers were active. Notable buying effort was absorbed, followed by aggressive sellers stepping in, triggering a reversal back toward the 6767 level, where buyers were active (see Figure 1).
Both the short-term (5D VPOC) and medium-term value (20D VPOC) have shifted higher, moving from last week’s value area toward this week’s developing value—a bullish indication in the context of Monday’s trend day higher, which left a true gap unfilled.
Monday’s trend day closed back within the prior multi-day balance area after sustaining a true gap higher. Today’s session continued building value within that distribution, successfully defending the 6767 level and keeping last week’s inventory trapped. This is a bullish consolidation until proven otherwise—only acceptance back within last week’s range below 6767 could shift the tone, but even then, buyers remain in control as long as Monday’s gap remains unfilled. TSLA earnings are on deck tomorrow after the close.
In terms of levels, the Smashlevel is 6767—last week’s high. Holding above 6767 signals strength and targets 6787 (UT1). Acceptance above 6787 would signal further strength, targeting the all-time highs at 6809-12 (UT2), with a final upside target (FUT) at 6828 under sustained buying pressure.
On the flip side, failure to maintain 6767 would target the top of today’s excess low at 6748 (DT1), with a final downside target (FDT) at 6718—the unfilled gap—under sustained selling pressure.
Levels of Interest
Going into tomorrow’s session, I’ll closely observe the behavior around 6767.
Holding above 6767 would target 6787 / 6809-12 / 6828
Break and hold below 6767 would target 6748 / 6718
Additionally, pay attention to the following VIX levels: 18.88 and 16.84. These levels can provide confirmation of strength or weakness.
Break and hold above 6828 with VIX below 16.84 would confirm strength.
Break and hold below 6718 with VIX above 18.88 would confirm weakness.
Overall, it's important to exercise caution when trading outside of the highlighted yellow levels. A non-cooperative VIX may suggest possible reversals i.e trade setups.
Many thanks Smash. Love you work ❤️
Thanks Chief 👨✈️