
ES Daily Plan | October 20, 2025
Market Context & Key Levels for the Day Ahead

— For new subscribers
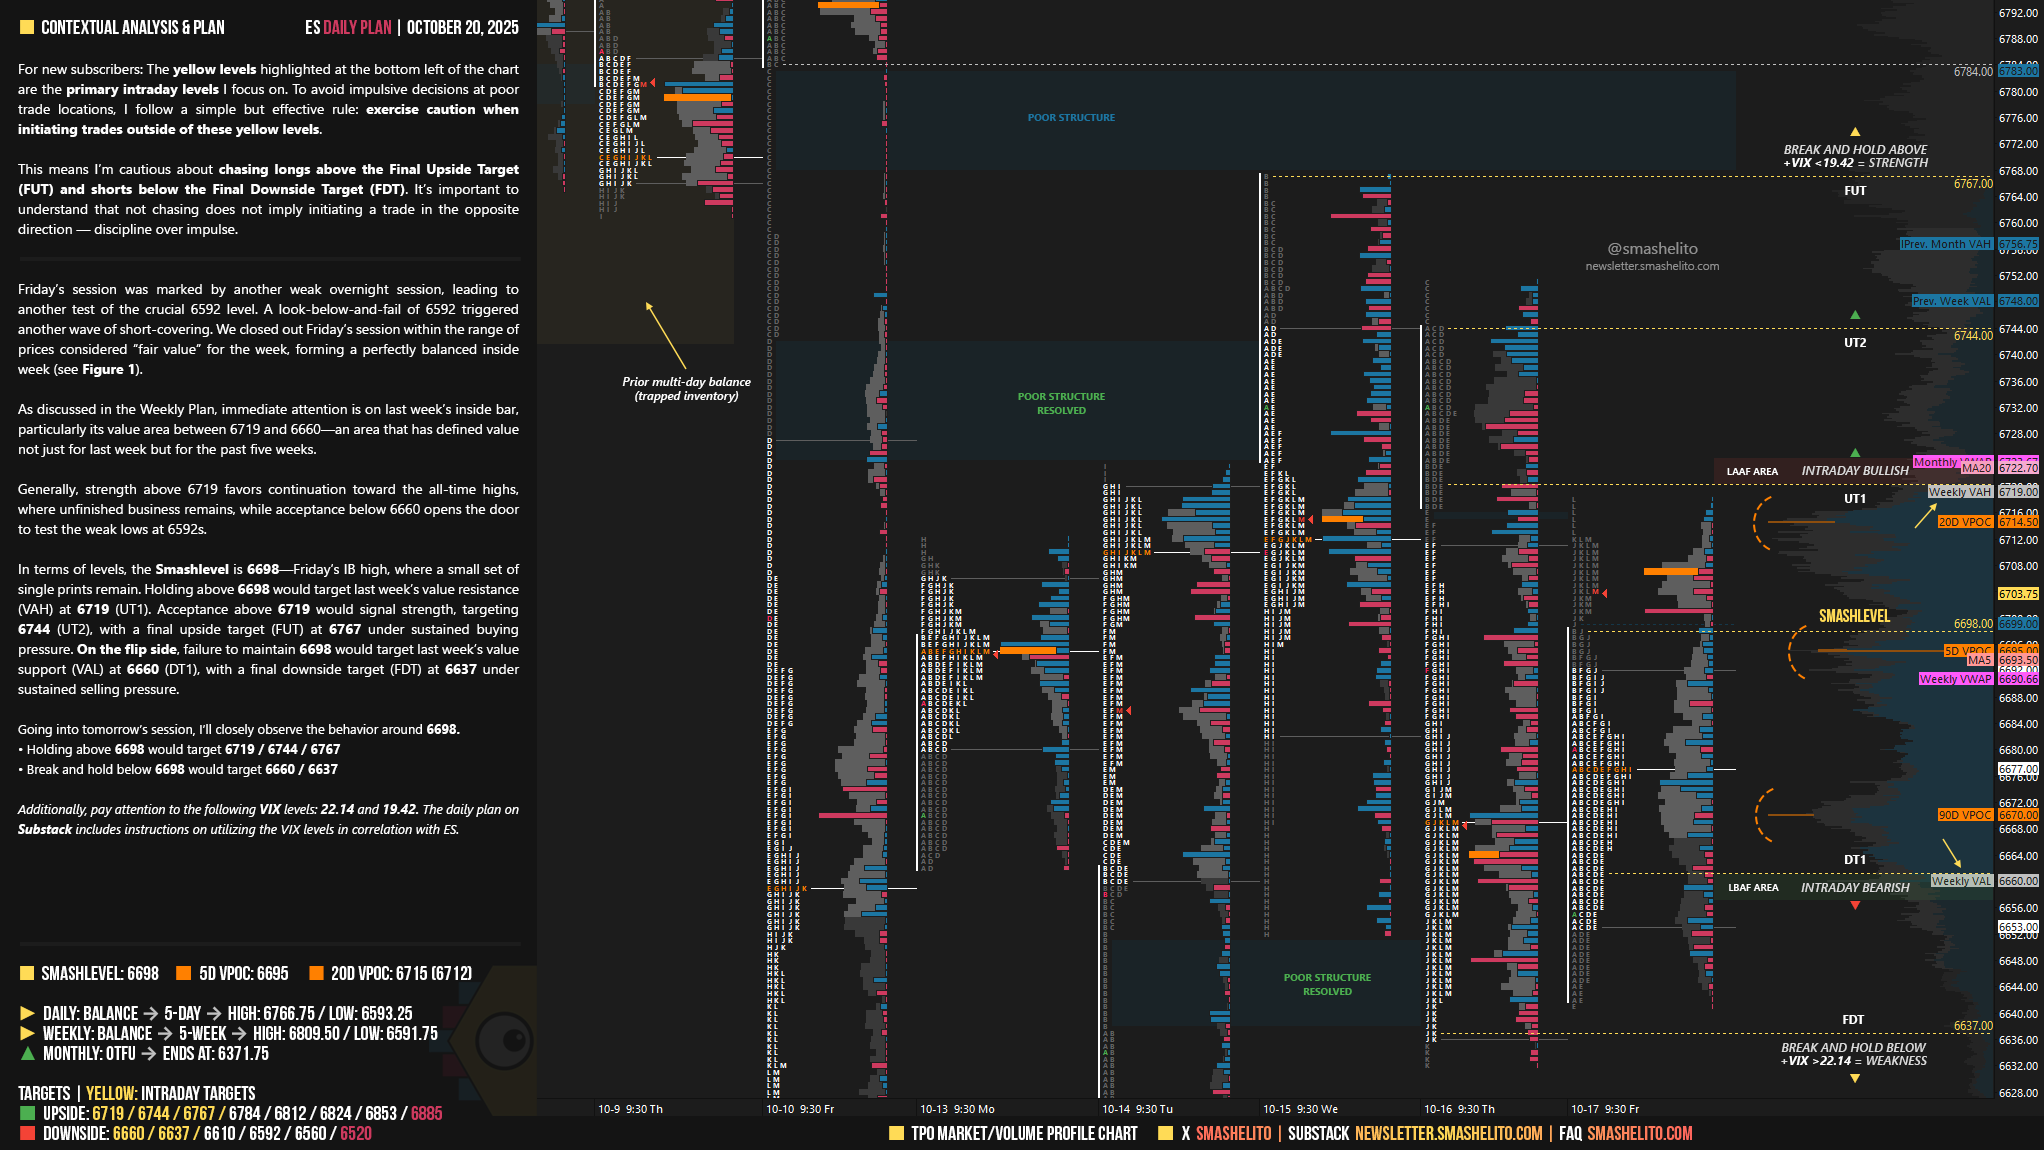
The yellow levels highlighted at the bottom left of the chart are the primary intraday levels I focus on. To avoid impulsive decisions at poor trade locations, I follow a simple but effective rule: exercise caution when initiating trades outside of these yellow levels.
This means I’m cautious about chasing longs above the Final Upside Target (FUT) and shorts below the Final Downside Target (FDT). It’s important to understand that not chasing does not imply initiating a trade in the opposite direction — discipline over impulse.
Be sure to review the ES Weekly Plan | October 20-24, 2025 for a broader perspective, key levels, and market expectations for the week ahead.
Contextual Analysis & Plan
Friday’s session was marked by another weak overnight session, leading to another test of the crucial 6592 level. A look-below-and-fail of 6592 triggered another wave of short-covering. We closed out Friday’s session within the range of prices considered “fair value” for the week, forming a perfectly balanced inside week (see Figure 1).
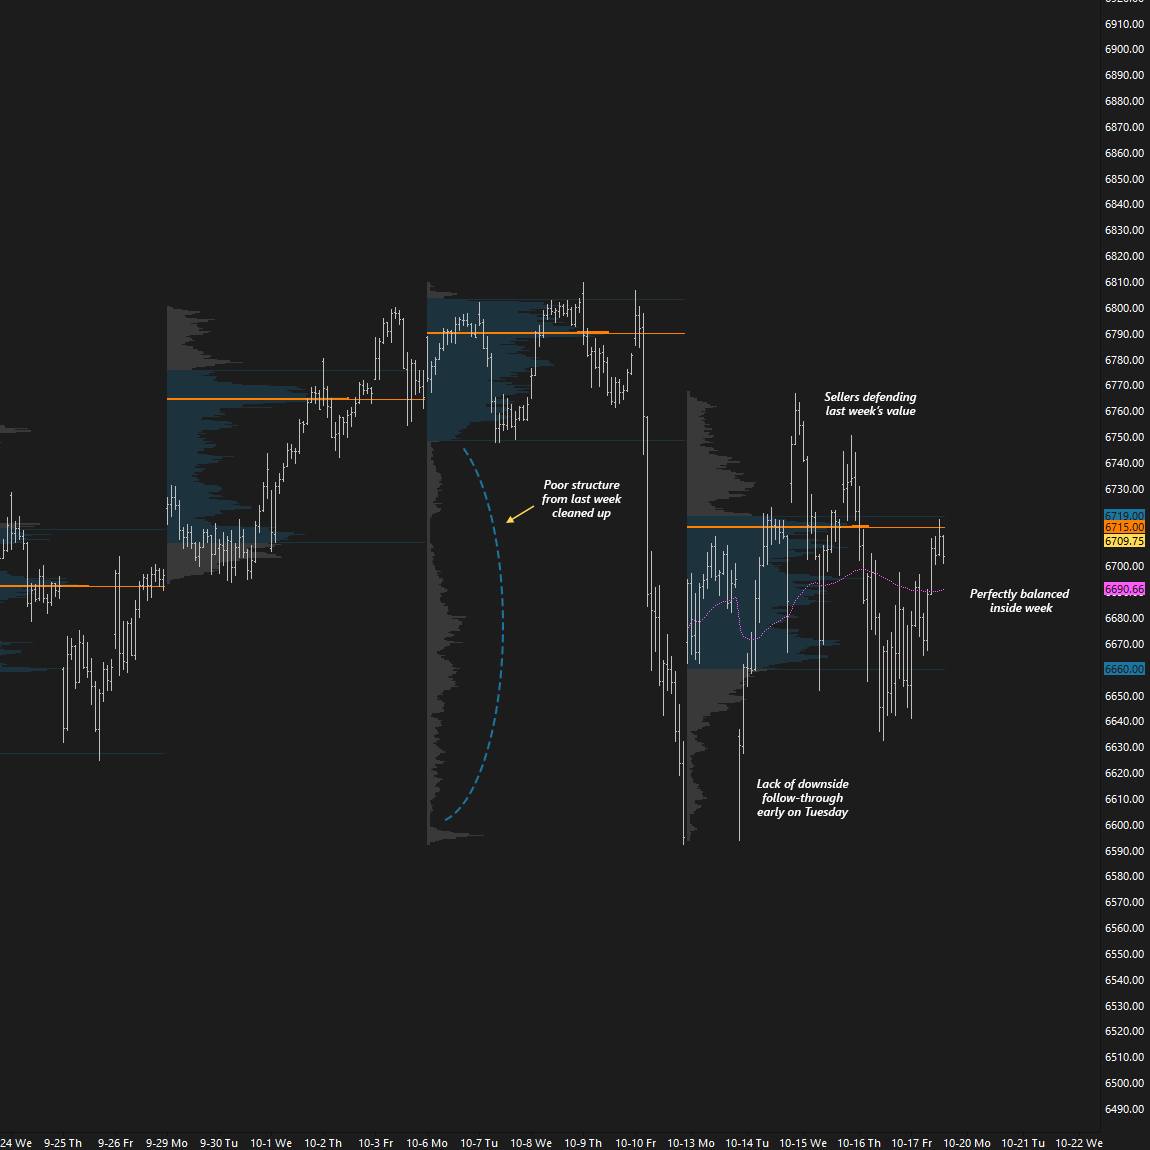
As discussed in the Weekly Plan, immediate attention is on last week’s inside bar, particularly its value area between 6719 and 6660—an area that has defined value not just for last week but for the past five weeks.
Generally, strength above 6719 favors continuation toward the all-time highs, where unfinished business remains, while acceptance below 6660 opens the door to test the weak lows at 6592s.
In terms of levels, the Smashlevel is 6698—Friday’s IB high, where a small set of single prints remain. Holding above 6698 would target last week’s value resistance (VAH) at 6719 (UT1). Acceptance above 6719 would signal strength, targeting 6744 (UT2), with a final upside target (FUT) at 6767 under sustained buying pressure.
On the flip side, failure to maintain 6698 would target last week’s value support (VAL) at 6660 (DT1), with a final downside target (FDT) at 6637 under sustained selling pressure.
Levels of Interest
Going into tomorrow’s session, I’ll closely observe the behavior around 6698.
Break and hold above 6698 would target 6719 / 6744 / 6767
Holding below 6698 would target 6660 / 6637
Additionally, pay attention to the following VIX levels: 22.14 and 19.42. These levels can provide confirmation of strength or weakness.
Break and hold above 6767 with VIX below 19.42 would confirm strength.
Break and hold below 6637 with VIX above 22.14 would confirm weakness.
Overall, it's important to exercise caution when trading outside of the highlighted yellow levels. A non-cooperative VIX may suggest possible reversals i.e trade setups.
Thanks Smash!