

— For new subscribers
The yellow levels highlighted at the bottom left of the chart are the primary intraday levels I focus on. To avoid impulsive decisions at poor trade locations, I follow a simple but effective rule: exercise caution when initiating trades outside of these yellow levels.
This means I’m cautious about chasing longs above the Final Upside Target (FUT) and shorts below the Final Downside Target (FDT). It’s important to understand that not chasing does not imply initiating a trade in the opposite direction. Discipline over impulse.
Be sure to review the Weekly Plan for a broader perspective, key levels, and market expectations for the week ahead.

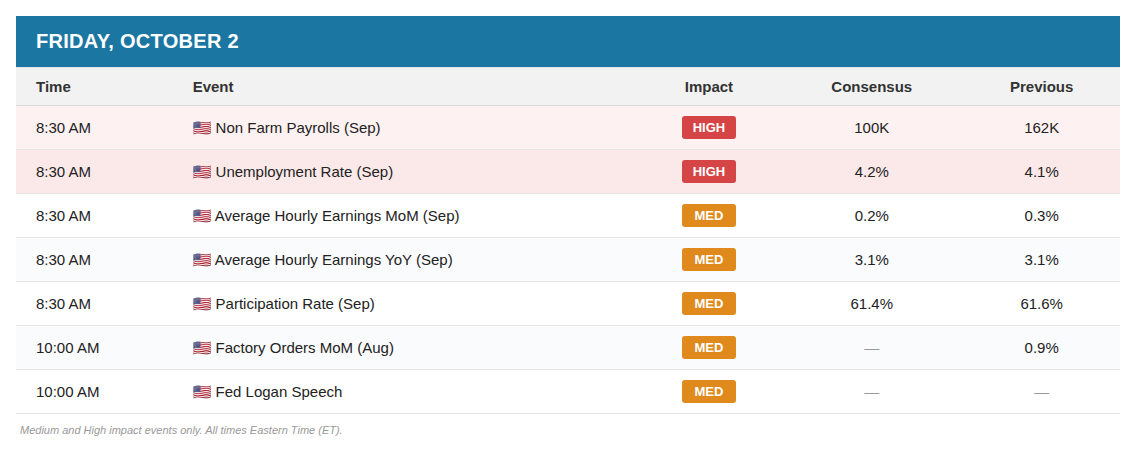
Catalysts
Contextual Analysis & Plan
During the overnight session, the auction immediately began retracing Wednesday’s downward spike after opening above 7718 (Smashlevel) and successfully defending the level (see Figure 1). Sellers stepped in a few ticks shy of the spike base at 7747 (UT1); however, buyers managed to establish a higher low, leading to a notable continuation higher. The Euro session fully retraced the early overnight gains following a sharp liquidation break, but the theme of sellers failing to gain traction below 7718 continued ahead of the RTH session.
The RTH session opened within the spike area, and sellers won the A-period by preventing buyers from reclaiming 7747 while breaking below 7718. This completed Tuesday’s bearish imbalance, tagging the high volume node at 7687 (DT2) in the process. Acceptance below 7687 would signal intraday weakness, which sellers ultimately failed to achieve despite heavy effort. Not a single 30-minute close below 7687 today, despite six different periods trading below it, which was notable. The afternoon session punished this failed selling effort, and the market returned to Wednesday’s spike area, where we ultimately closed.
Session Recap
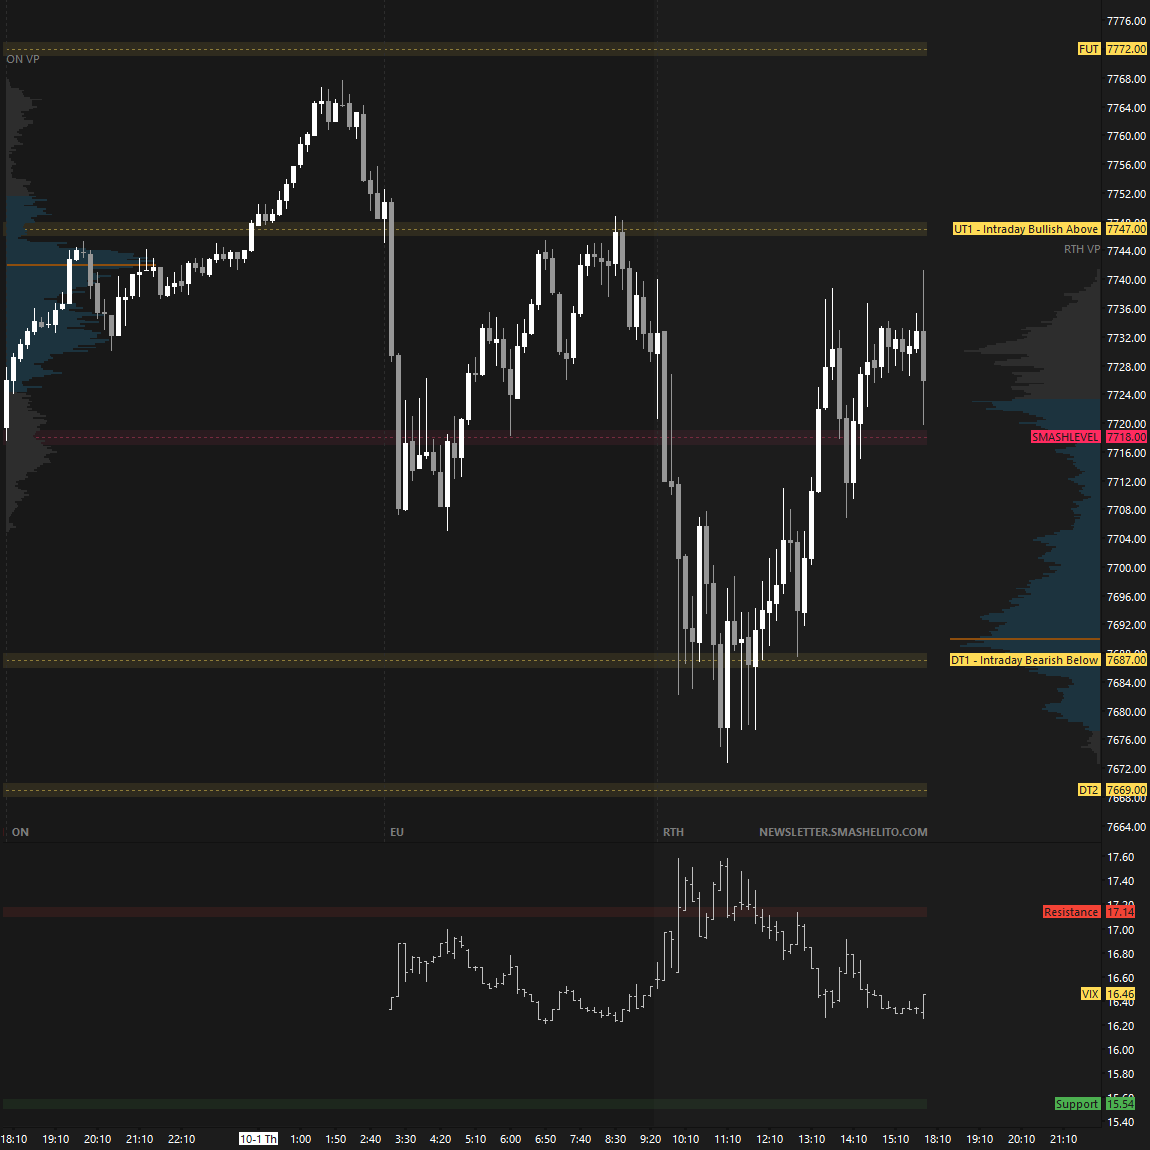
Price exploration below Wednesday’s range and the MA50 found responsive buyers today, ultimately resulting in a close back within the spike area. I’ll continue to use this spike area to gauge the state of the auction.
Looking at the short-term composite profile on the far right, three distributions stand out. The lower distribution comes from today’s morning session. The middle distribution is where value was built on Tuesday and during today’s afternoon session. The upper distribution is where value was established on Monday and Wednesday.
A return into the upper distribution by reclaiming 7747 would be a sign of strength, while a return into the lower distribution, with 7709 being the key level to break, would maintain downside pressure.
In terms of levels, the Smashlevel is at 7709, today’s afternoon pullback low, which aligns with Wednesday’s low and today’s halfback. Holding above 7709 would target 7747 (UT1), where a potential LAAF is of interest. Acceptance above 7747 would signal intraday strength, targeting 7772 (UT2), with the HVN at 7794 (FUT) serving as the final upside target under sustained buying pressure.
On the flip side, failure to hold 7709 would maintain downside pressure and target the HVN at 7687 (DT1), where a potential LBAF is of interest, with 7669 (FDT) serving as the final downside target under sustained selling pressure.
Visual Representation
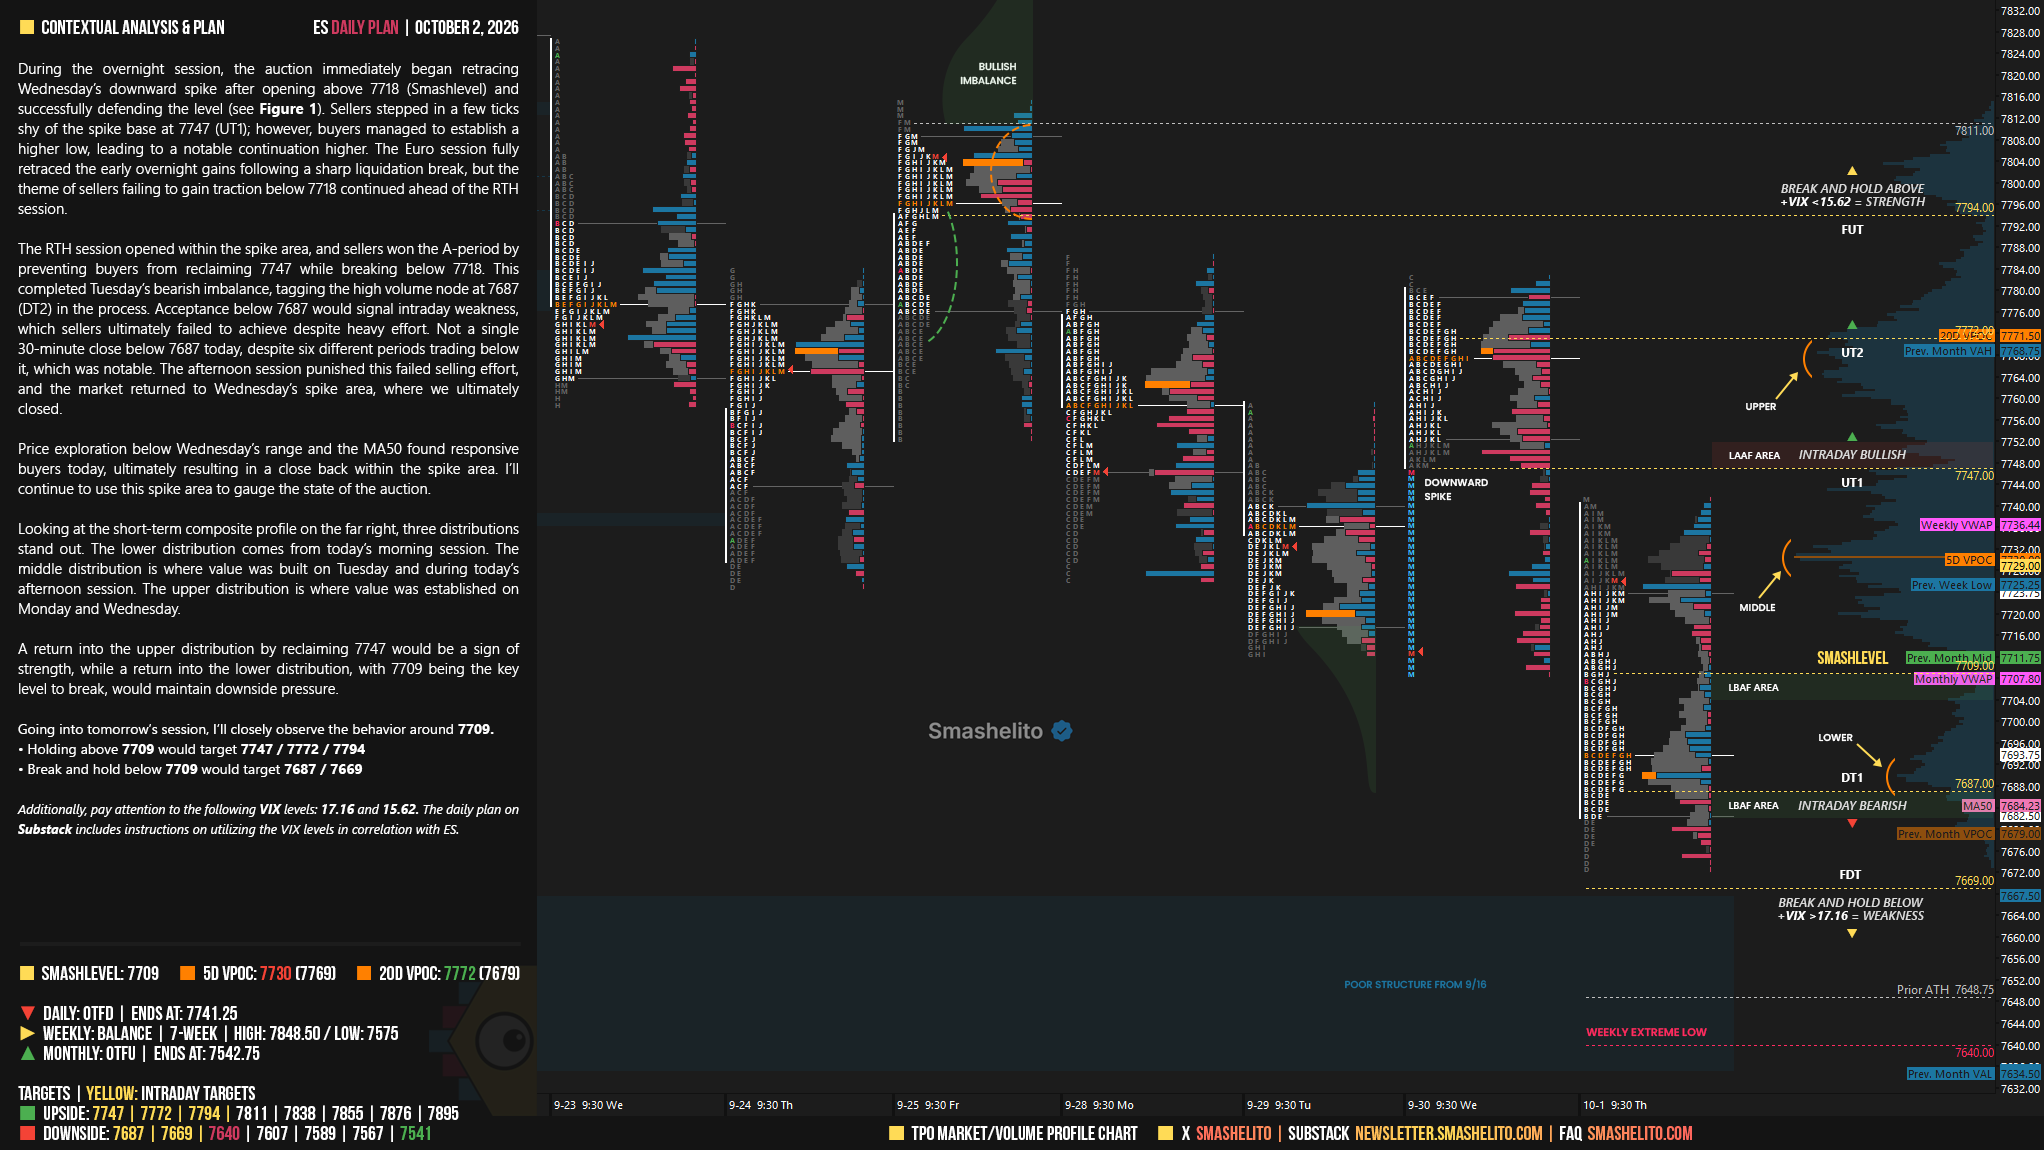
Levels of Interest
Going into tomorrow’s session, I’ll closely observe the behavior around 7709.
Holding above 7709 would target 7747 / 7772 / 7794
Break and hold below 7709 would target 7687 / 7669
Additionally, pay attention to the following VIX levels: 17.16 and 15.62. These levels can provide confirmation of strength or weakness.
Break and hold above 7794 with VIX below 15.62 would confirm strength.
Break and hold below 7669 with VIX above 17.16 would confirm weakness.
Overall, it's important to exercise caution when trading outside of the highlighted yellow levels. A non-cooperative VIX may suggest possible reversals i.e trade setups.
Thanks smash great levels you are very talented and generous for sharing this with us
Heavy big lots kept hitting this 772X area hmmm.