

Welcome to this week’s plan. Inside, you’ll find a quick review of last week’s price action, key economic events, market structure, context for the week ahead, and the levels I’ll be focusing on. Let’s get prepared.
Contents
Last Week in Review
Economic & Earnings Calendar
Market Structure
Contextual Analysis & Plan
Key Levels of Interest
Last Week in Review
Last week’s plan:

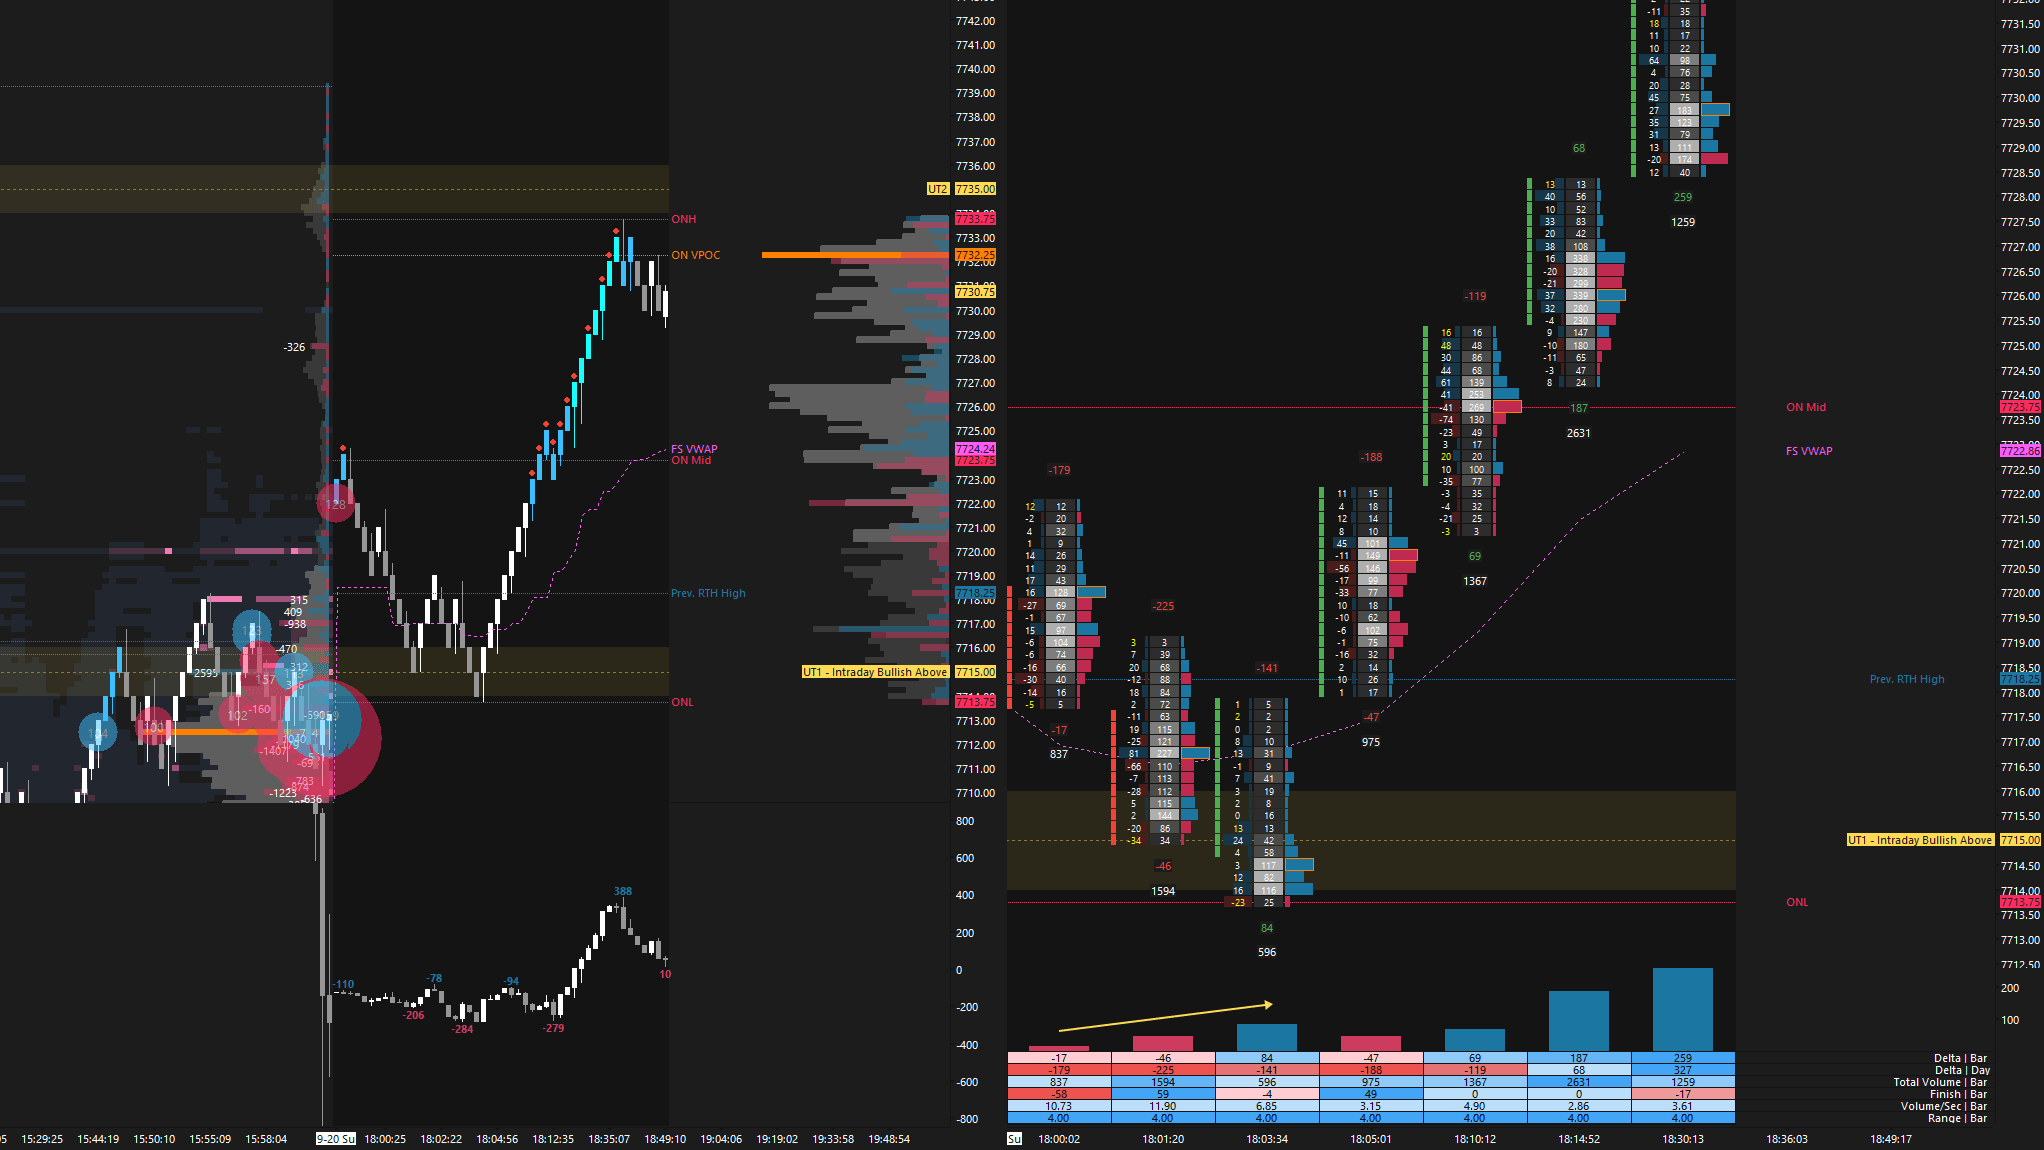
Last week kicked off with notable strength, as Monday opened with a sizable true gap higher after a strong overnight session. Buyers defended 7715 early overnight, which was a sign of strength (see Figure 1), and from that point, the auction basically never looked back. The RTH session then saw a vicious continuation higher after holding the key 7757 level, followed by notable aggressive buyers stepping in (see Figure 2).
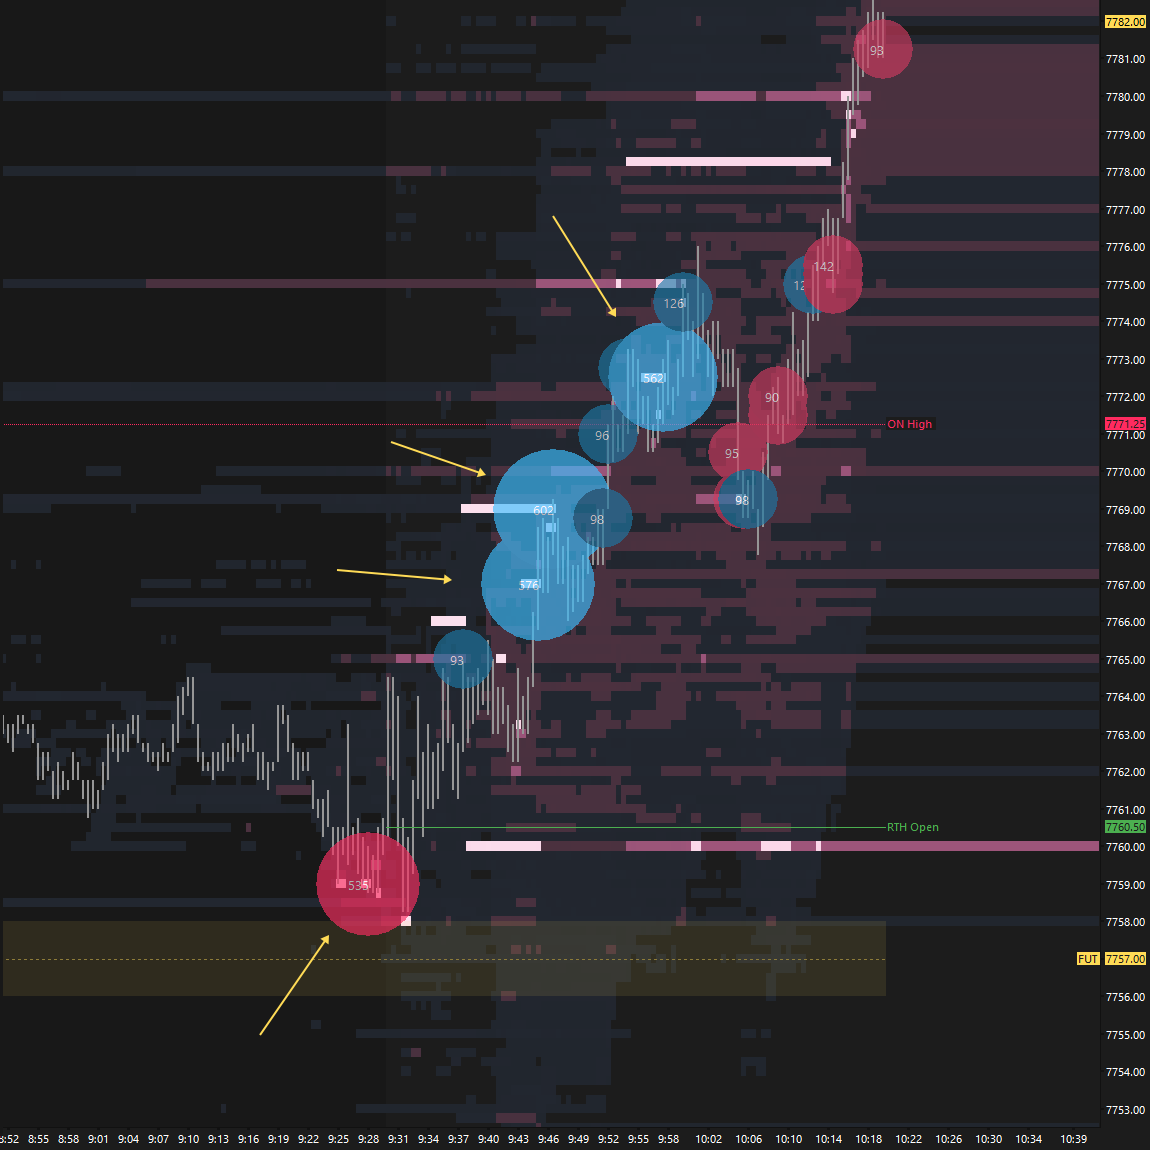
Failure by sellers to defend 7757 was short-term bullish, opening the door to a revisit of the all-time highs, as outlined in last week’s plan.
“If we open with strength, the key for sellers will be to defend the daily NVPOC at 7757. Failure to defend this area would set the stage for a revisit of the all-time highs.”
Monday’s session printed a new all-time high, reaching the weekly resistance area between 7855 and 7825 in the process. Keep in mind that while ES printed a new ATH on the continuous contract, SPX (7,816.70) and SPY (779.37) have yet to do the same.
Heading into Tuesday’s session, we discussed the potential complexity of reaching the Weekly Extreme High as early as Monday and how this could make the rest of the week tricky to trade.
It’s not uncommon for price action to become uneventful after a move like Monday’s, which can be frustrating for traders who were not part of it. Tuesday was exactly that, extremely uneventful. A new ATH was printed at 7848.50, a couple of ticks above Monday’s high, making it a weak high. This was a sign of potential short-term exhaustion, suggesting that stronger buyers would be found lower, as discussed in Wednesday’s plan.
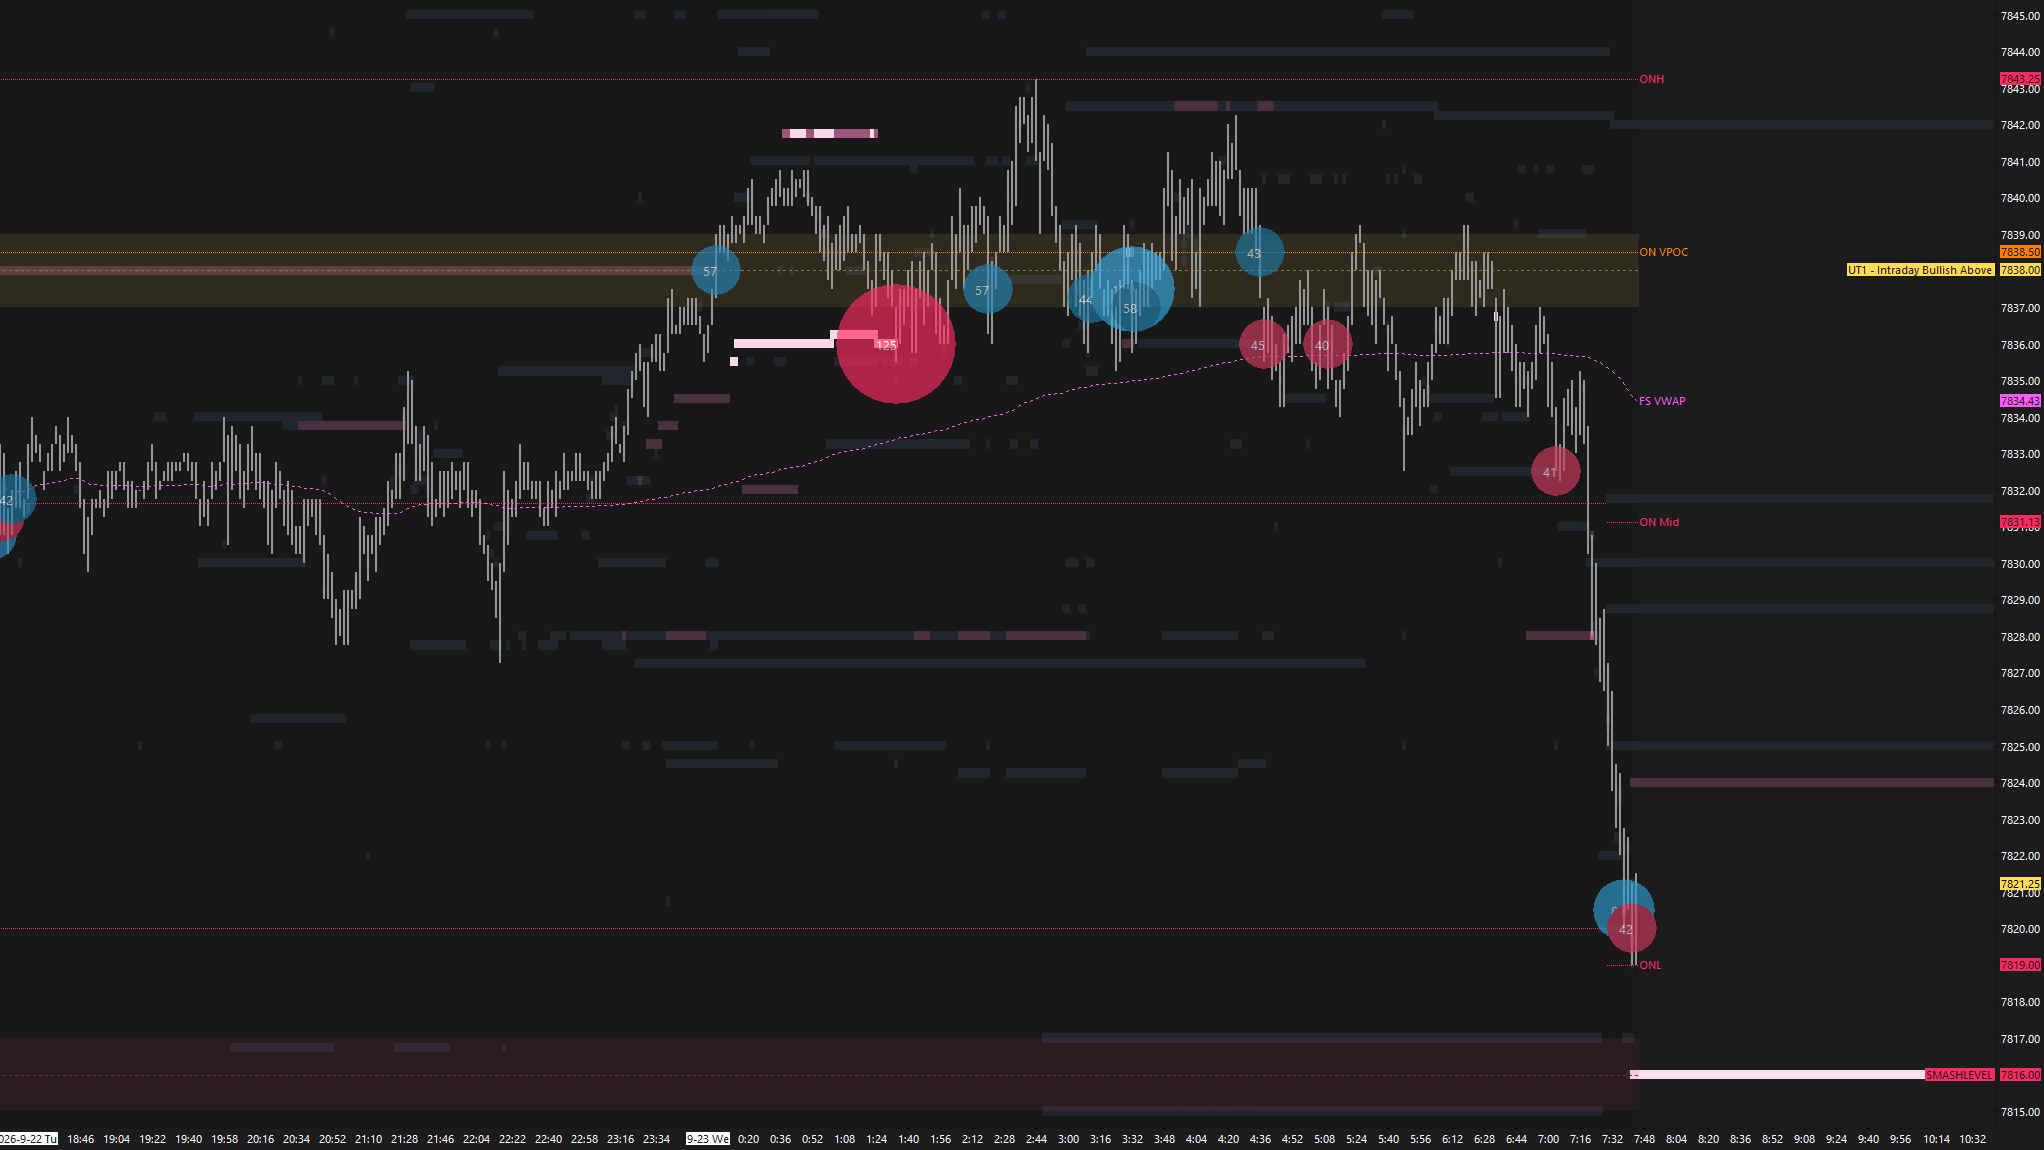
On Wednesday, long liquidation took place. Weakness already started overnight after buyers failed to gain traction above the prior ATH at 7838 (see Figure 3).
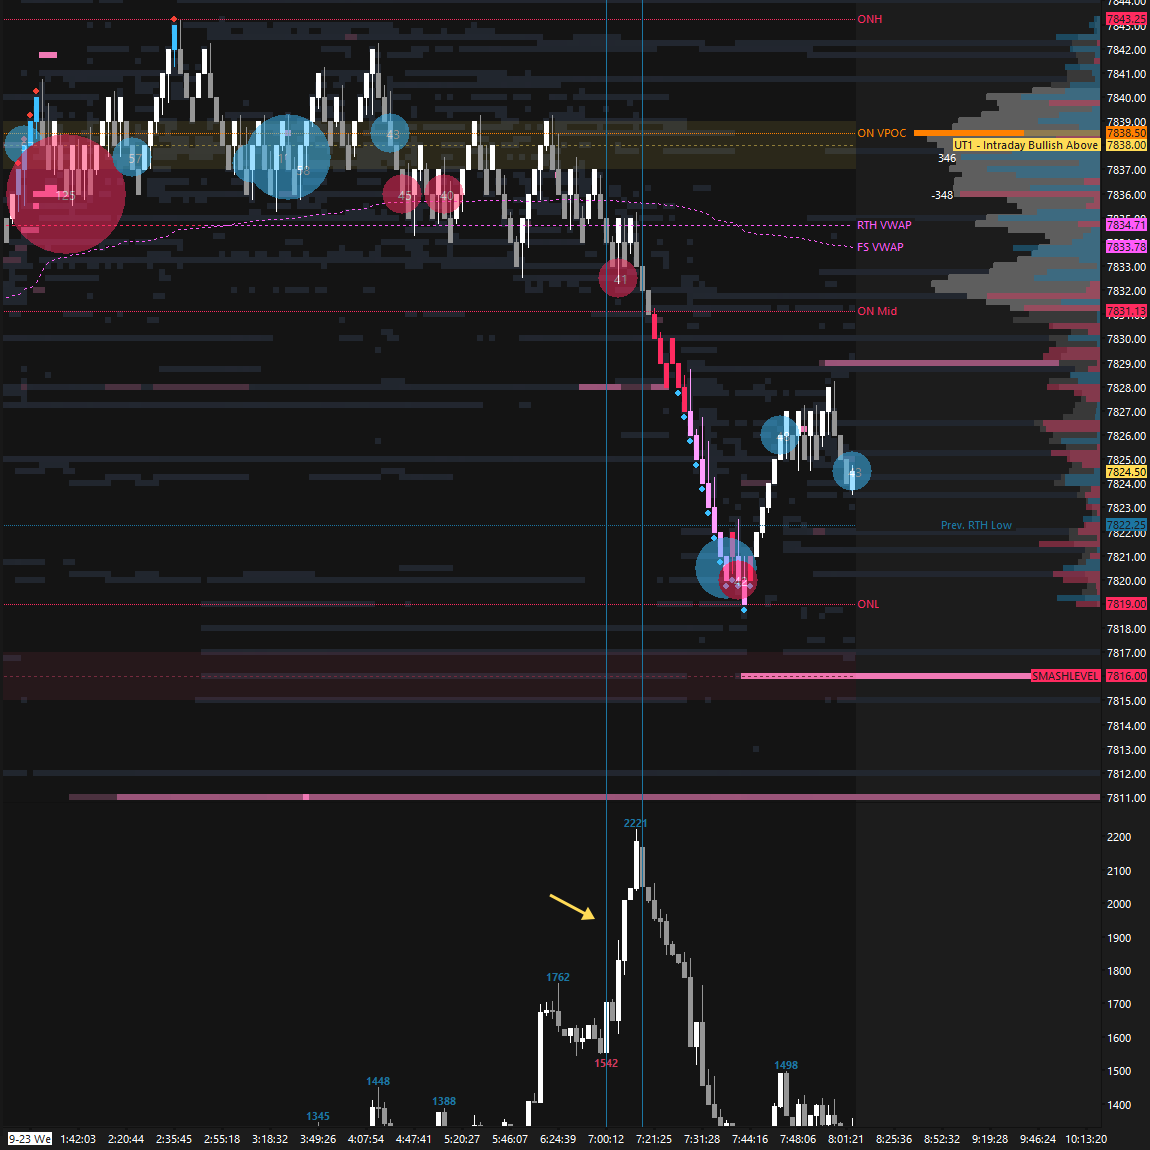
Note how aggressive buyers were absorbed by passive sellers just before that overnight flush (see Figure 4 and Figure 5).
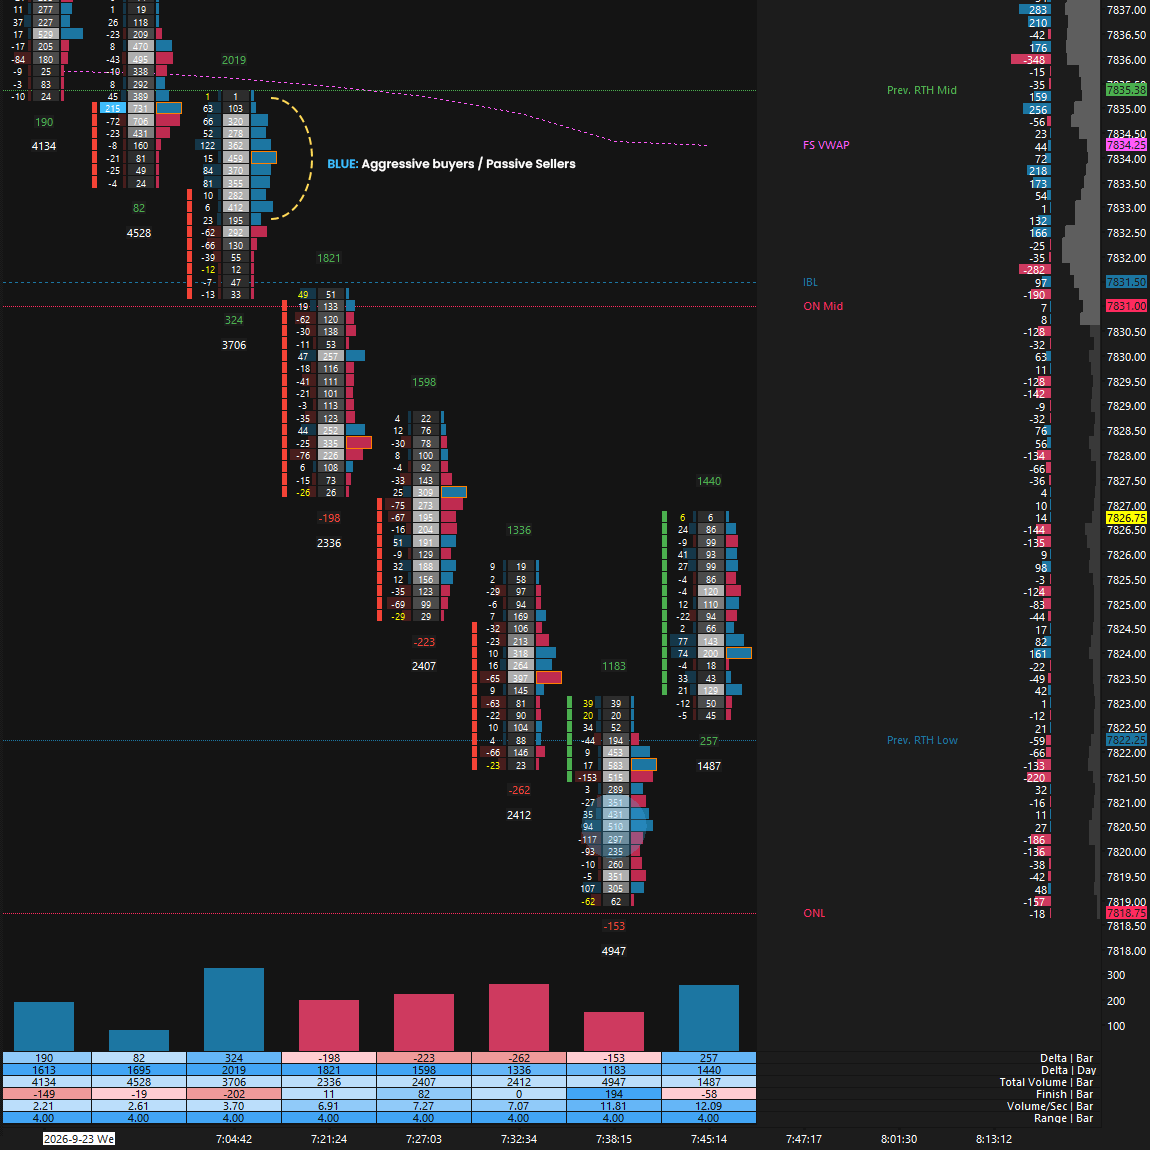
Wednesday’s RTH session fully cleaned up Monday’s poor structure, forming a b-shaped profile indicative of long liquidation (see Figure 6). The key question was whether sellers could follow through, or if stronger buyers would step in.
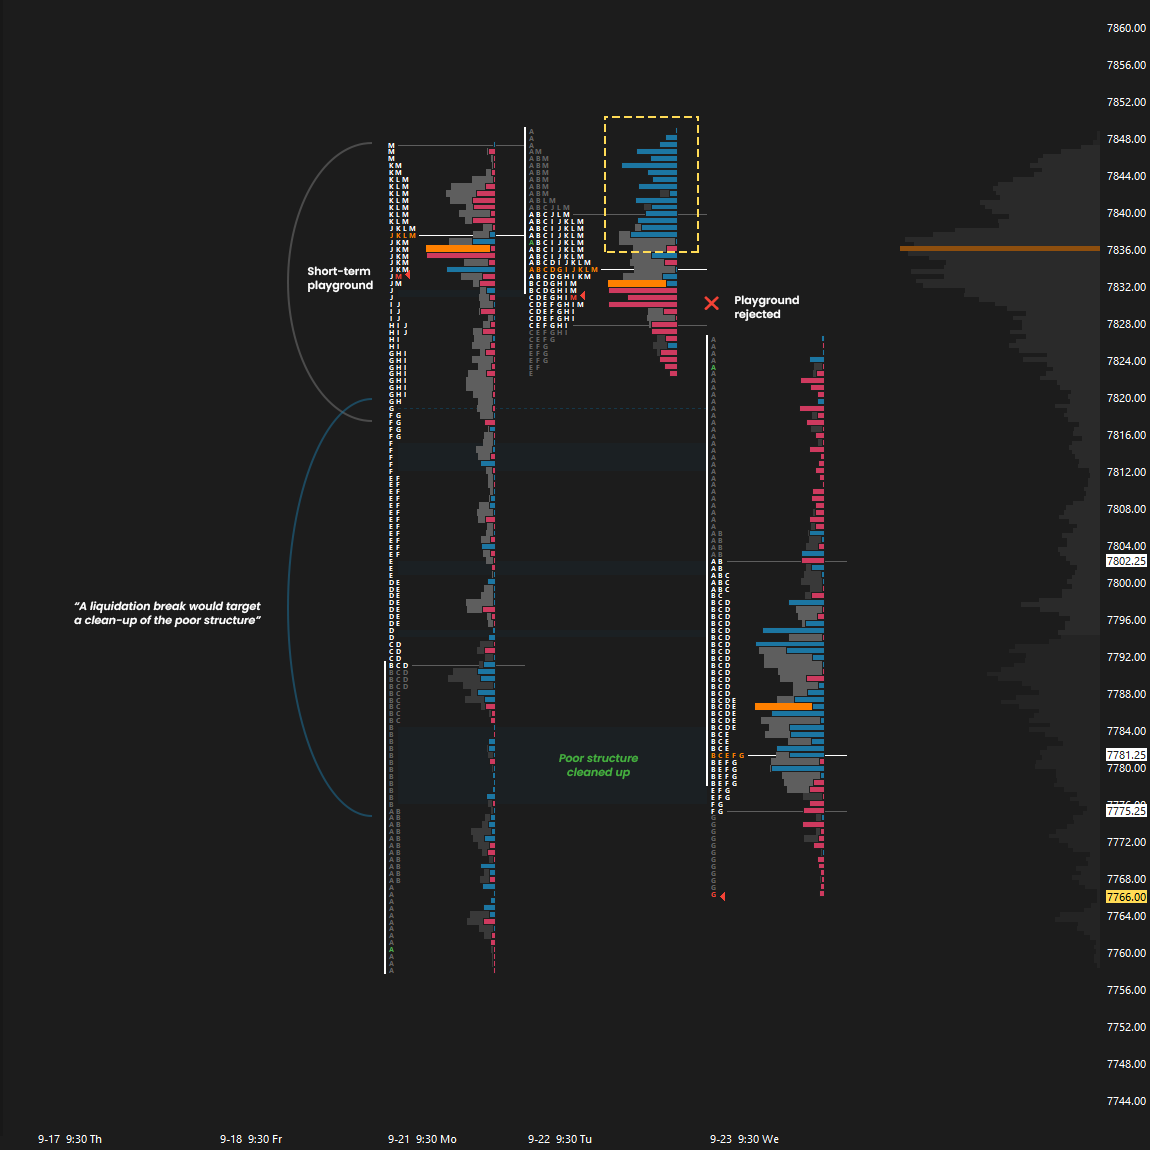
Thursday’s session was highly interesting, as it opened with a true gap down following a weak overnight session. However, despite the overnight and early RTH weakness, the session closed back within Wednesday’s range, only partially filling Monday’s gap at 7718.75. The reversal was driven by news headlines.
On Friday, it was all about whether buyers could remain within Wednesday’s range by holding above 7758, the Smashlevel in Friday’s plan. The 7758 level played a pivotal role during both the overnight and RTH sessions, delivering great trading opportunities (see Figure 7).
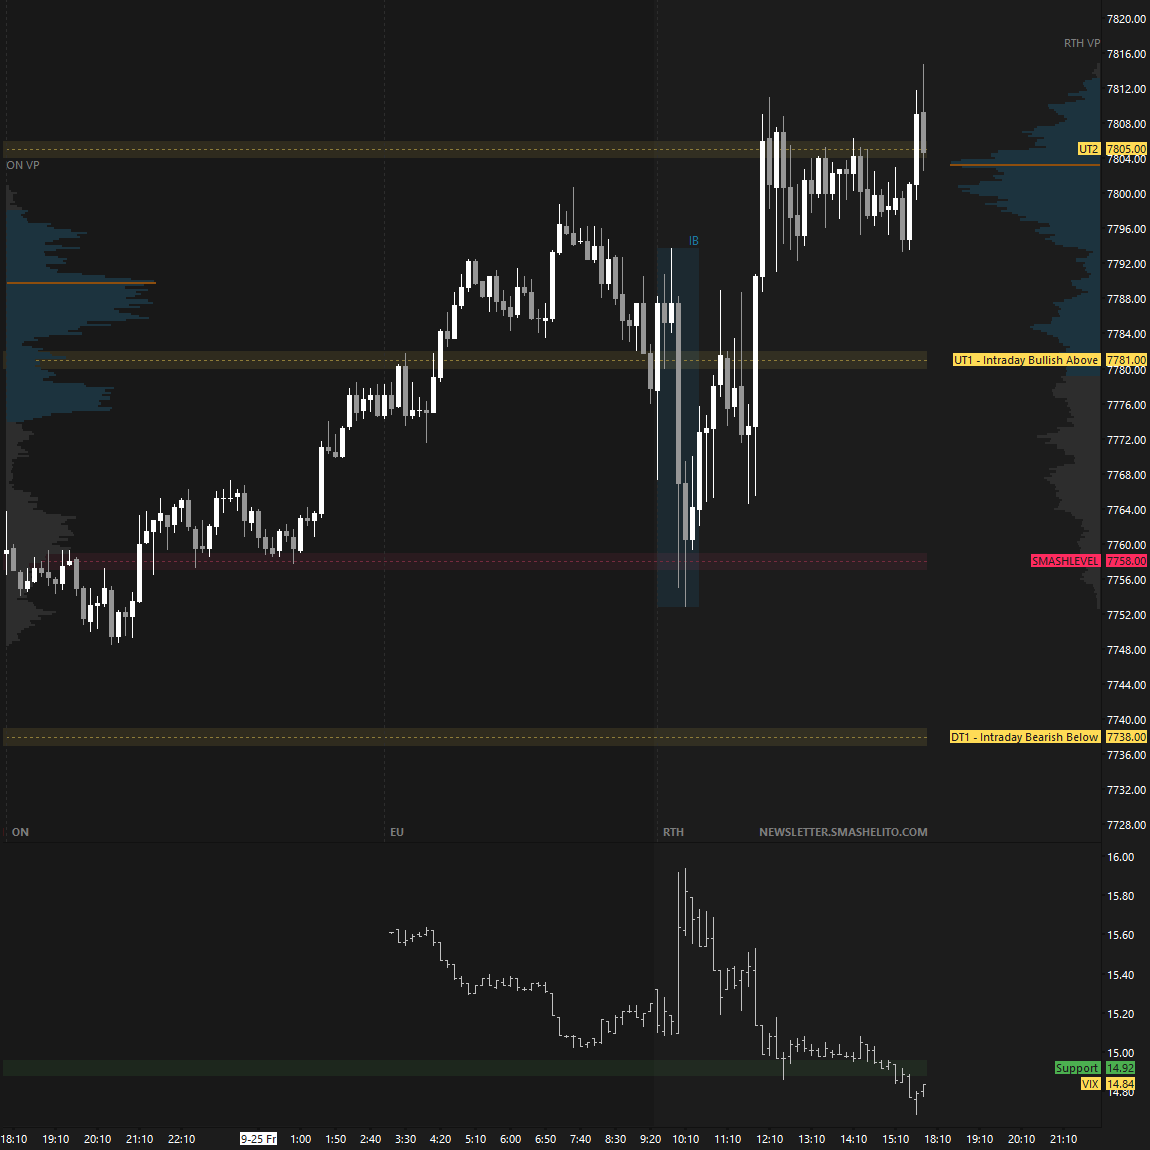
The closing period, referring to the M-period, delivered a great reversal sequence from an orderflow perspective (see Figure 8). Notable aggressive selling failed to push price lower as passive buyers absorbed the selling pressure, ultimately resulting in a closing squeeze. The entry bar is not the reversal bar itself, but the following bar, as the idea is to join the move once aggressive buyers step in following the absorption.
Figure 8


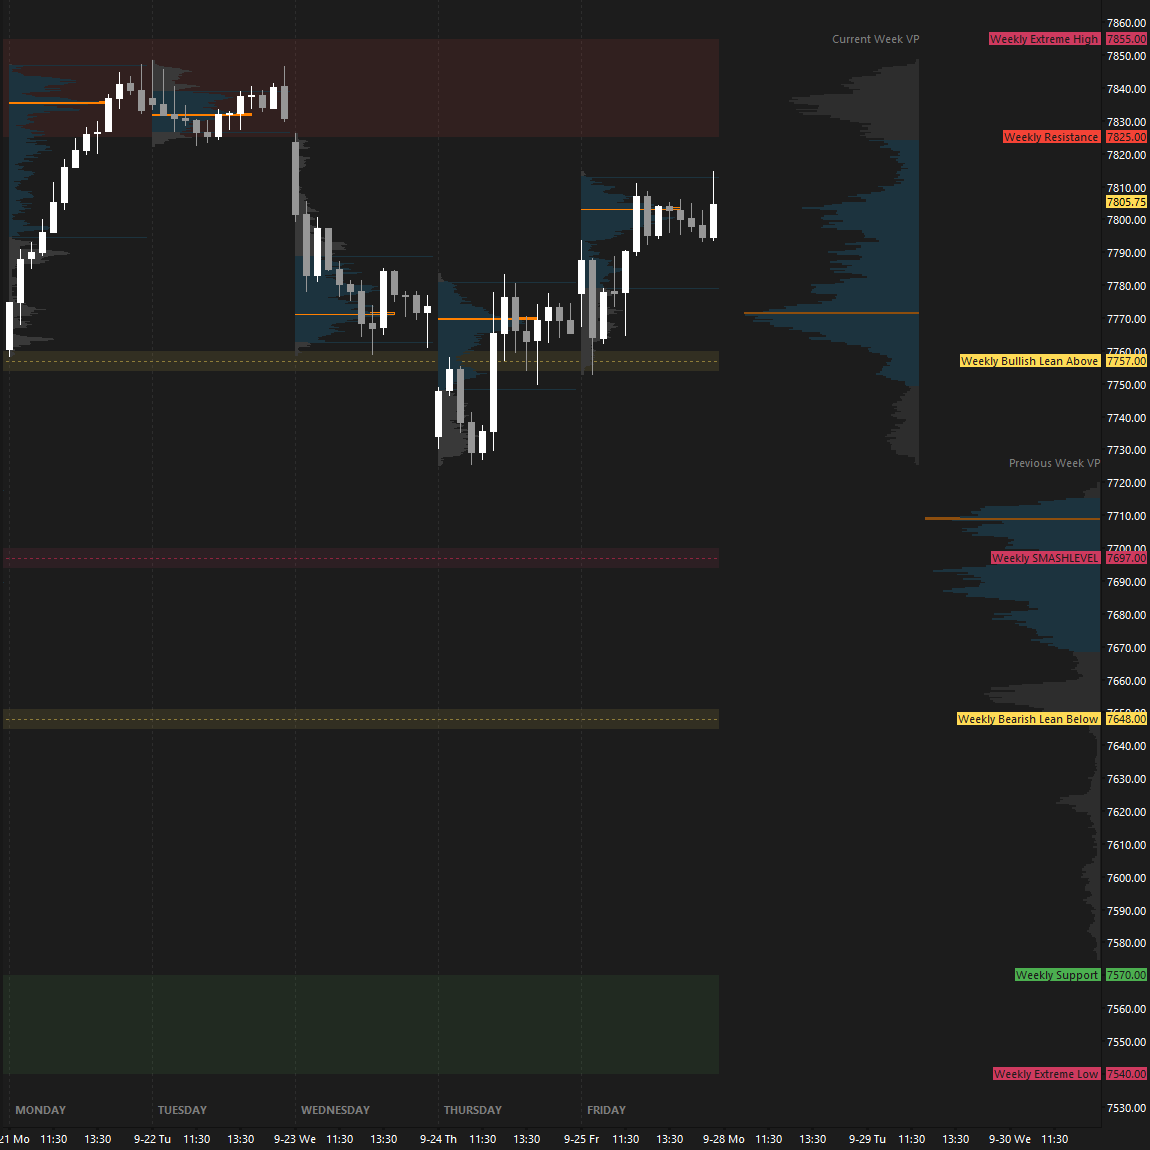
Looking at the weekly levels, the upside was capped by the weekly resistance area, while the auction held above 7757 for most of the week, with the exception of Thursday’s early weakness, ultimately signaling strength.
Weekly Levels in Review
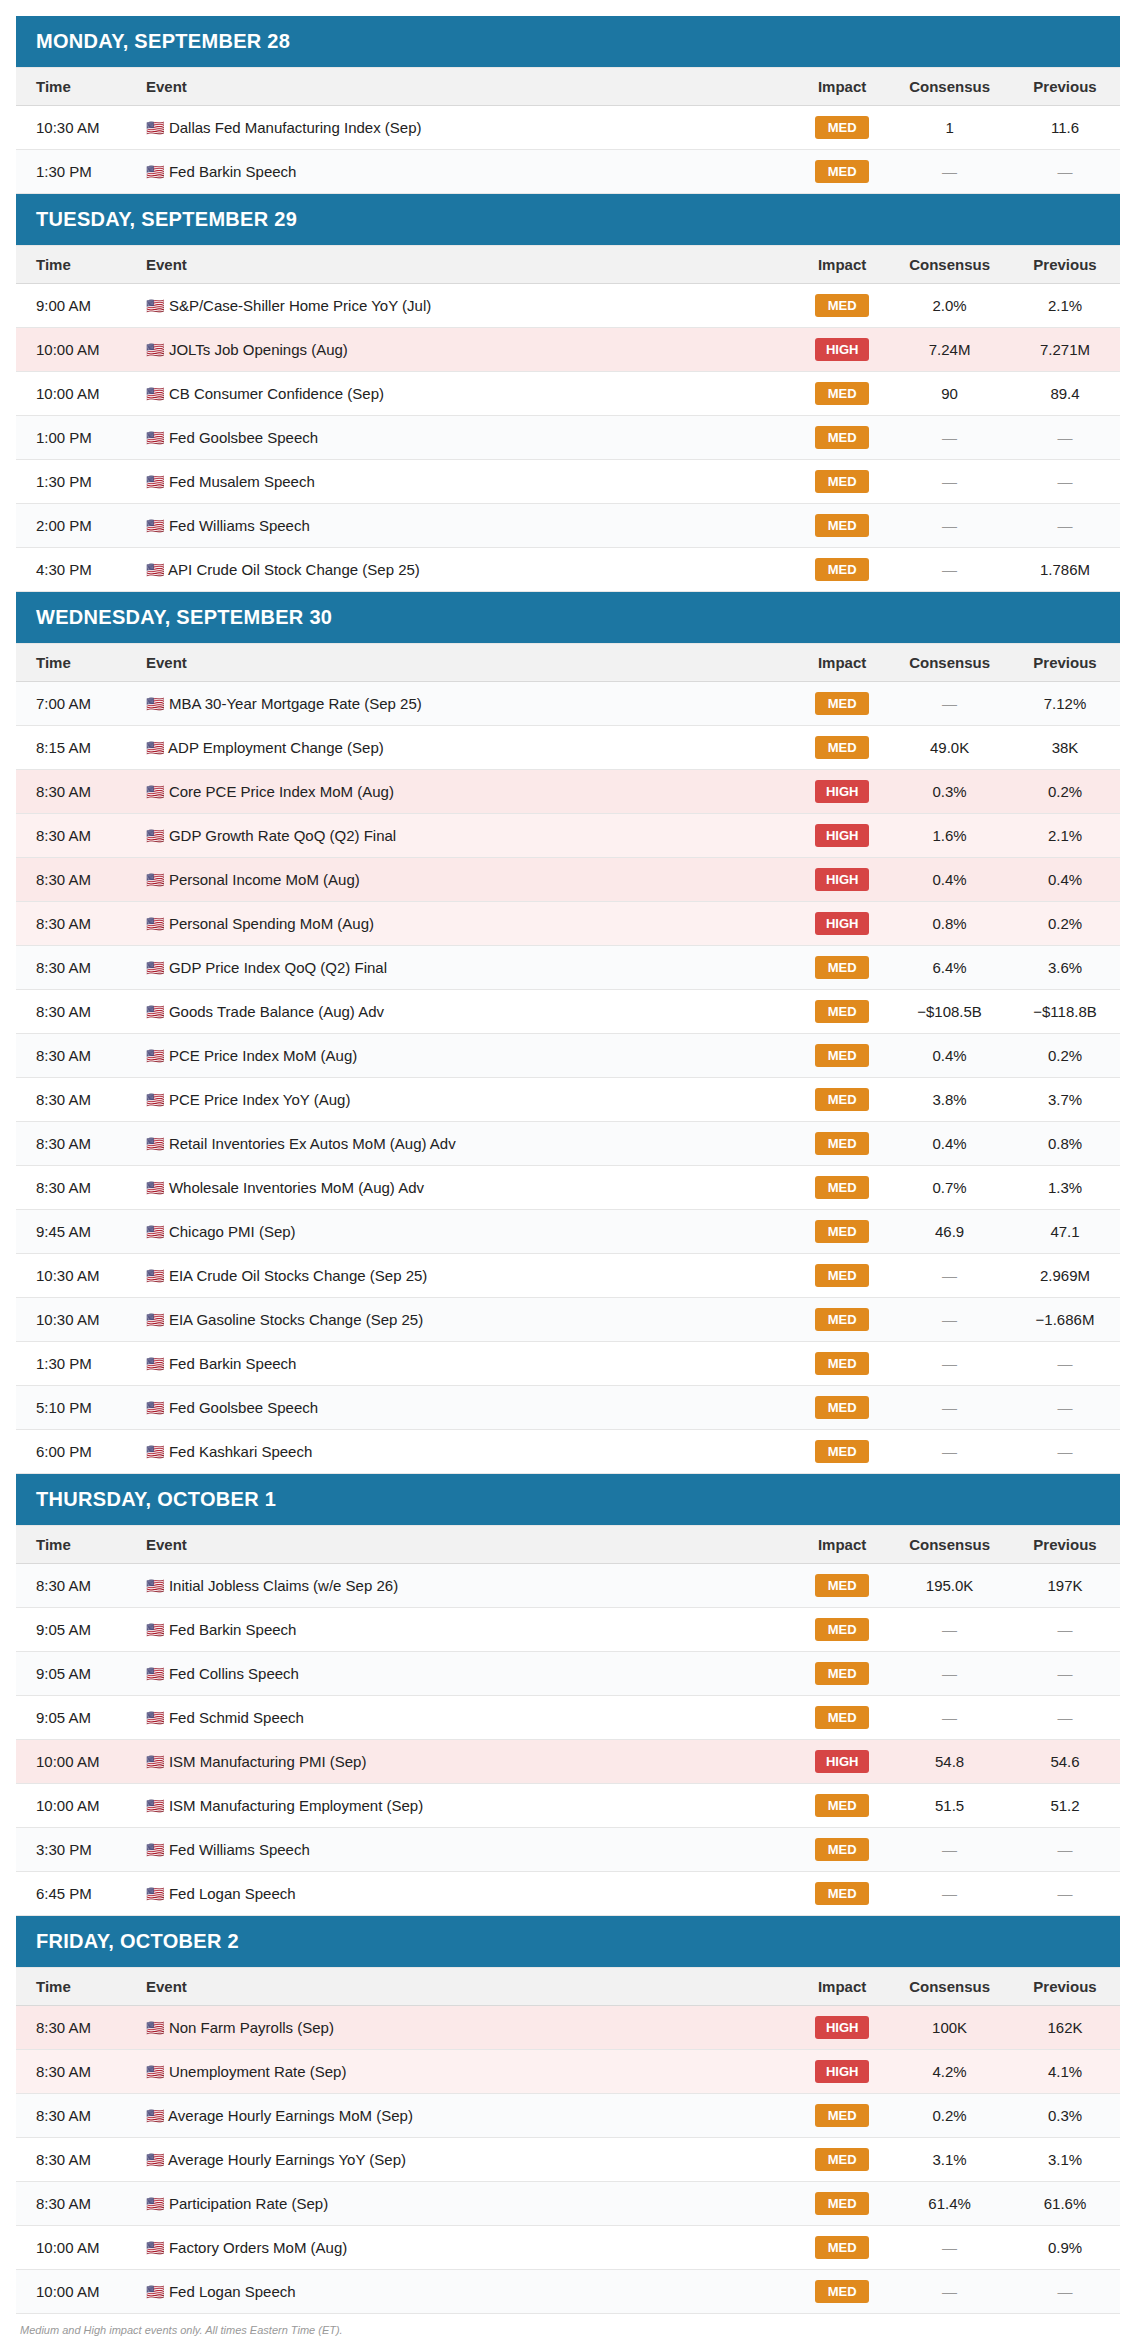
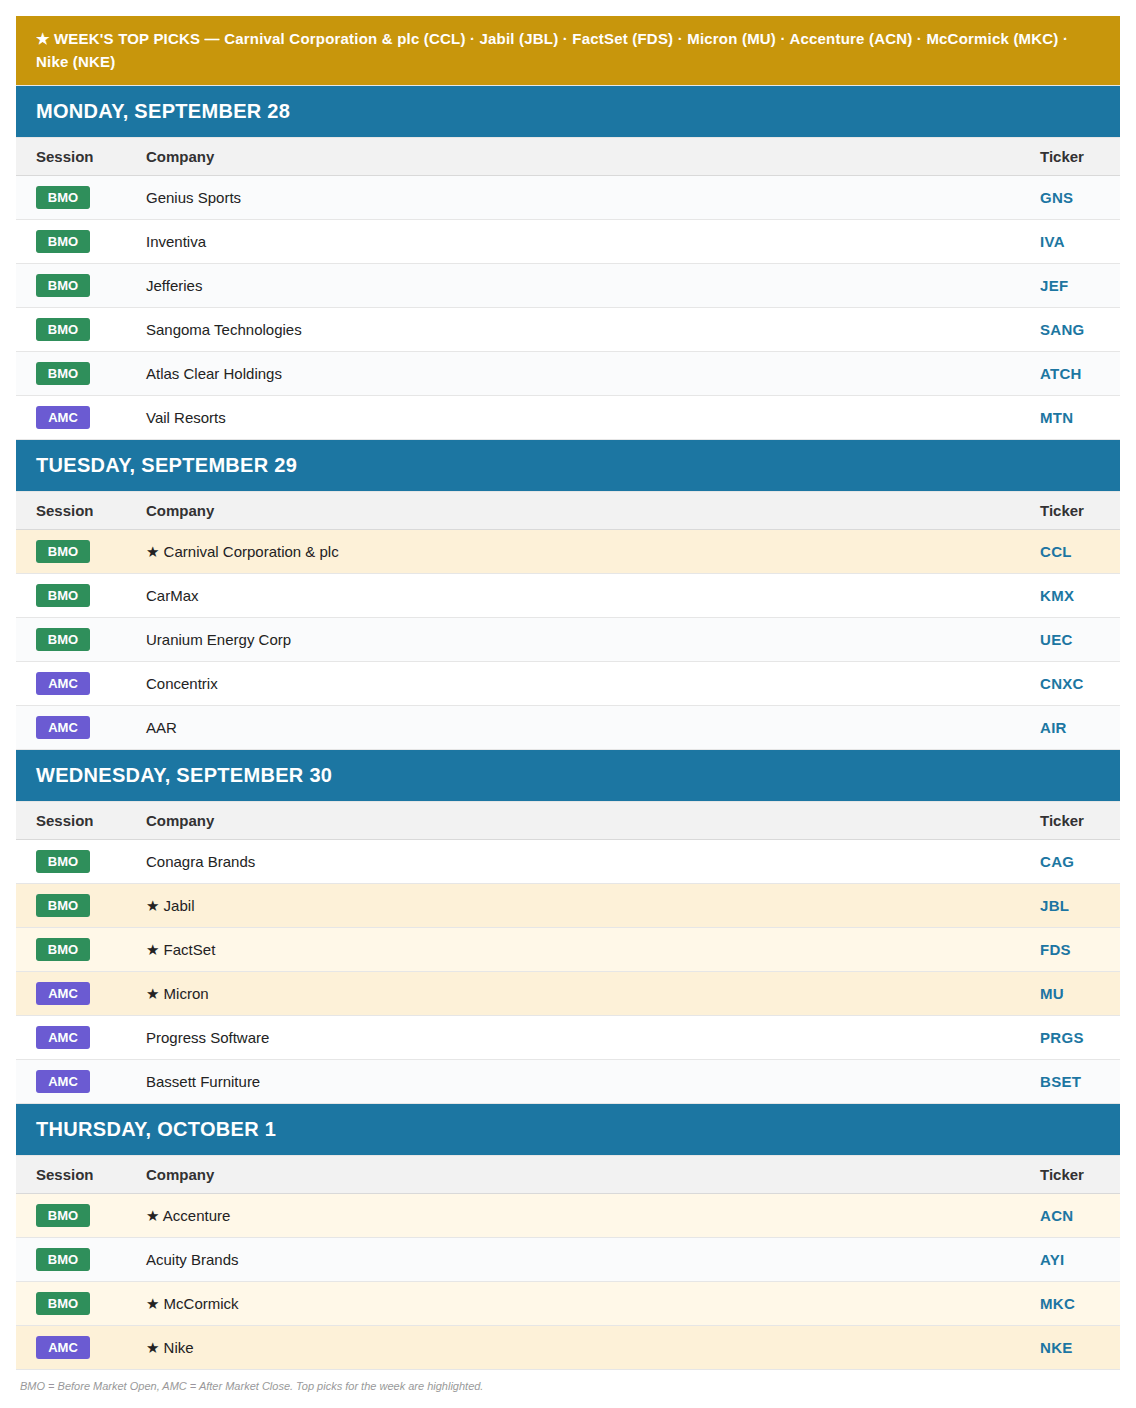
Economic & Earnings Calendar
Market Structure
🟨 Daily: BALANCE | 5-Day | High: 7848.50 / Low: 7725.25
🟨 Weekly: BALANCE | 7-Week | High: 7848.50 / Low: 7575
🟩 Monthly: OTFU | Ends at: 7542.75
Balance: A market condition where price consolidates within a defined range, reflecting indecision as the market awaits more market-generated information. We apply balance guidelines, favoring fade trades at range extremes (highs/lows) and preparing for breakout setups if balance resolves.
One-Time Framing Up (OTFU): A market condition where each subsequent bar forms a higher low, signaling a strong upward trend.
One-Time Framing Down (OTFD): A market condition where each subsequent bar forms a lower high, signaling a strong downward trend.
Contextual Analysis & Plan
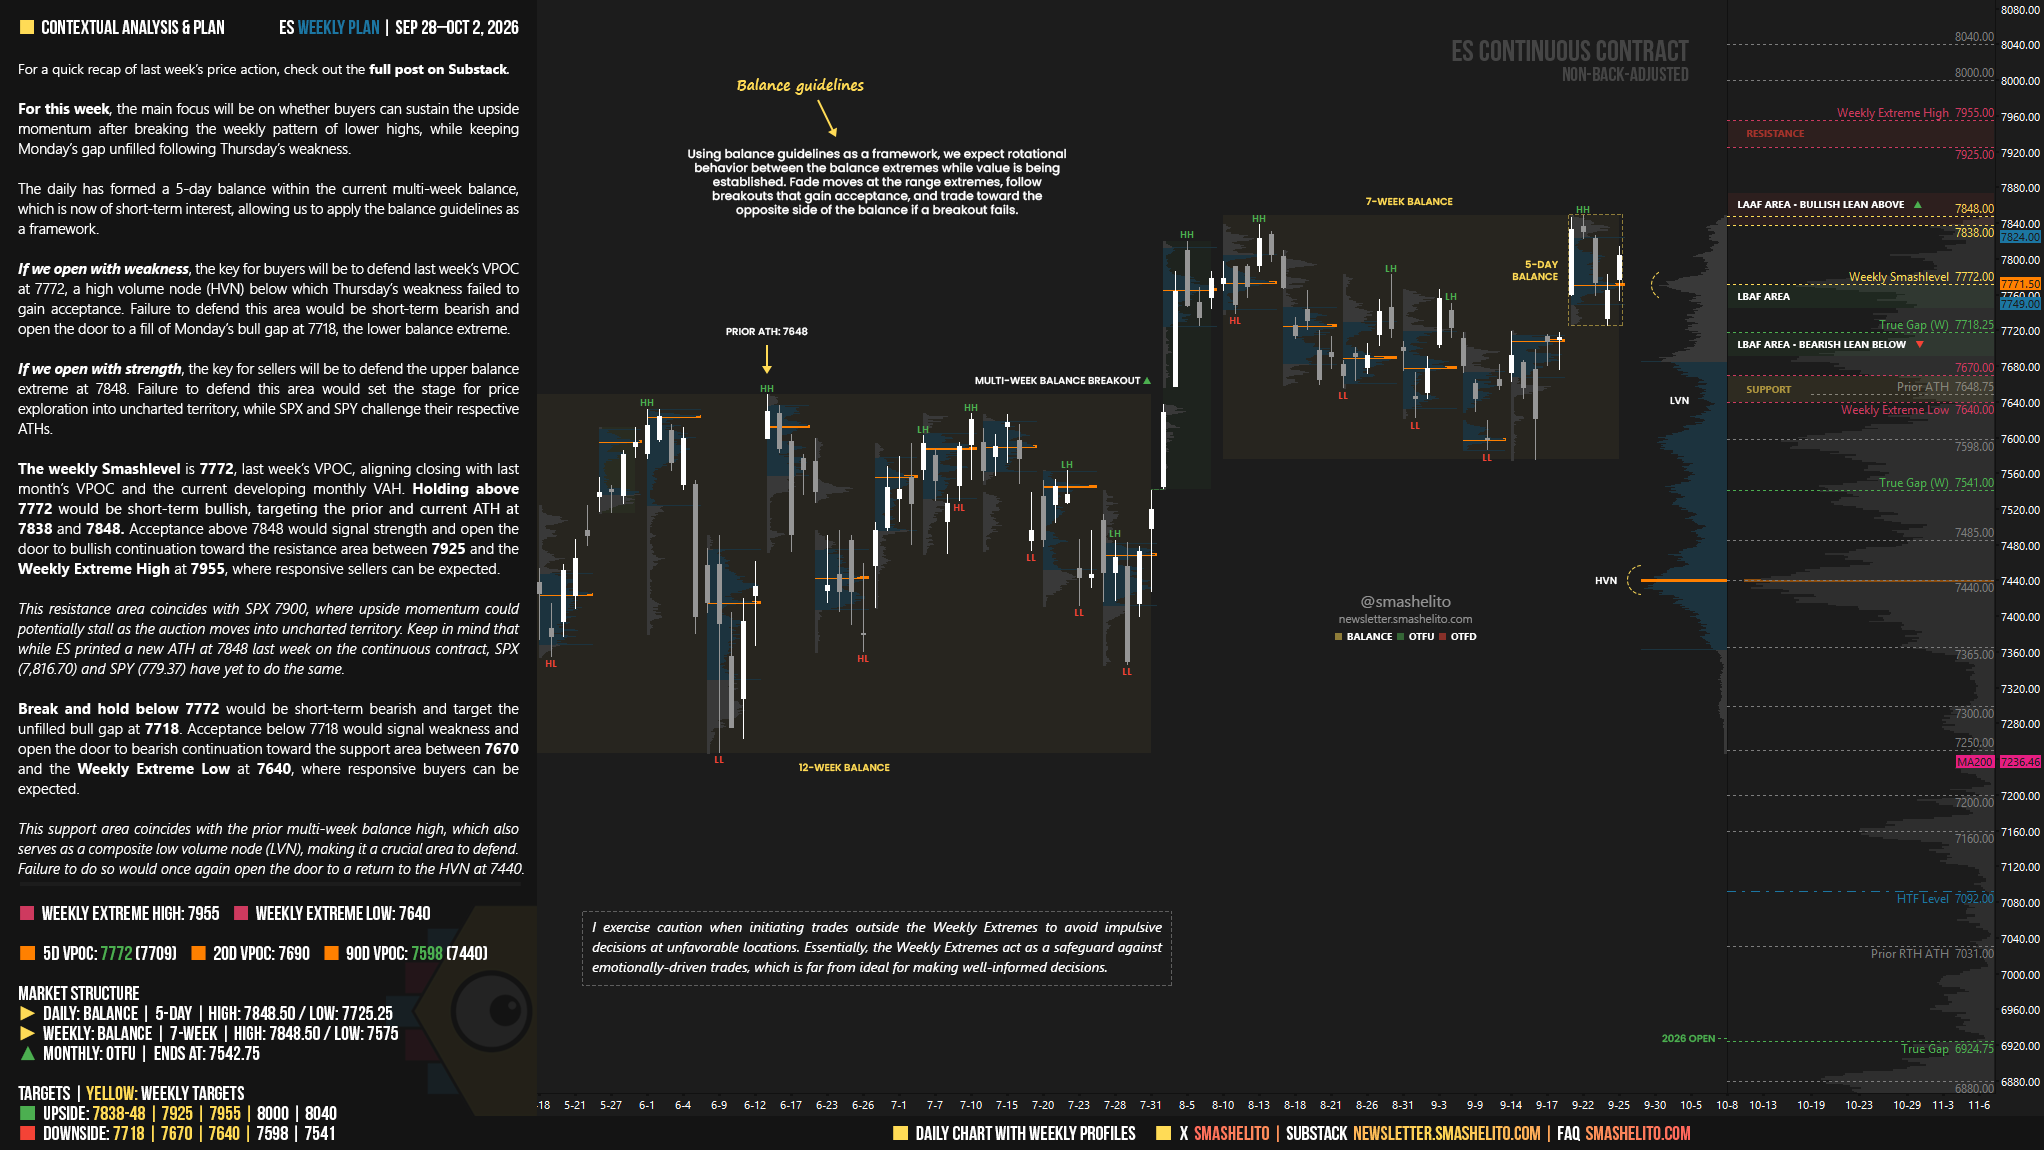
For this week, the main focus will be on whether buyers can sustain the upside momentum after breaking the weekly pattern of lower highs, while keeping Monday’s gap unfilled following Thursday’s weakness.
The daily has formed a 5-day balance within the current multi-week balance, which is now of short-term interest, allowing us to apply the balance guidelines as a framework.
If we open with weakness, the key for buyers will be to defend last week’s VPOC at 7772, a high volume node (HVN) below which Thursday’s weakness failed to gain acceptance. Failure to defend this area would be short-term bearish and open the door to a fill of Monday’s bull gap at 7718, the lower balance extreme.
If we open with strength, the key for sellers will be to defend the upper balance extreme at 7848. Failure to defend this area would set the stage for price exploration into uncharted territory, while SPX and SPY challenge their respective ATHs.
The weekly Smashlevel is 7772, last week’s VPOC, aligning closing with last month’s VPOC and the current developing monthly VAH. Holding above 7772 would be short-term bullish, targeting the prior and current ATH at 7838 and 7848. Acceptance above 7848 would signal strength and open the door to bullish continuation toward the resistance area between 7925 and the Weekly Extreme High at 7955, where responsive sellers can be expected.
This resistance area coincides with SPX 7900, where upside momentum could potentially stall as the auction moves into uncharted territory. Keep in mind that while ES printed a new ATH at 7848 last week on the continuous contract, SPX (7,816.70) and SPY (779.37) have yet to do the same.
Break and hold below 7772 would be short-term bearish and target the unfilled bull gap at 7718. Acceptance below 7718 would signal weakness and open the door to bearish continuation toward the support area between 7670 and the Weekly Extreme Low at 7640, where responsive buyers can be expected.
This support area coincides with the prior multi-week balance high, which also serves as a composite low volume node (LVN), making it a crucial area to defend. Failure to do so would once again open the door to a return to the HVN at 7440.
Visual Representation
Key Levels of Interest
In the upcoming week, I will closely observe the behavior around 7772.
Holding above 7772 would target 7838-48 / 7925 / 7955* / 8000 / 8040
Break and hold below 7772 would target 7718 / 7670 / 7640* / 7598 / 7541
*Weekly Extremes (defined by proprietary models). I exercise caution when initiating trades outside the Weekly Extremes to avoid impulsive decisions at unfavorable locations. Essentially, the Weekly Extremes act as a safeguard against emotionally-driven trades, which is far from ideal for making well-informed decisions.
As usual, a detailed Daily Plan will be posted tomorrow. Hope you all enjoy the rest of the weekend!
Thank you
Thank you Smash!