
ES Daily Plan | October 2, 2025
Market Context & Key Levels for the Day Ahead

— For new subscribers
The yellow levels highlighted at the bottom left of the chart are the primary intraday levels I focus on. To avoid impulsive decisions at poor trade locations, I follow a simple but effective rule: exercise caution when initiating trades outside of these yellow levels.
This means I’m cautious about chasing longs above the Final Upside Target (FUT) and shorts below the Final Downside Target (FDT). It’s important to understand that not chasing does not imply initiating a trade in the opposite direction — discipline over impulse.
Be sure to review the ES Weekly Plan | Sep 29 - Oct 3, 2025 for a broader perspective, key levels, and market expectations for the week ahead.
Contextual Analysis & Plan
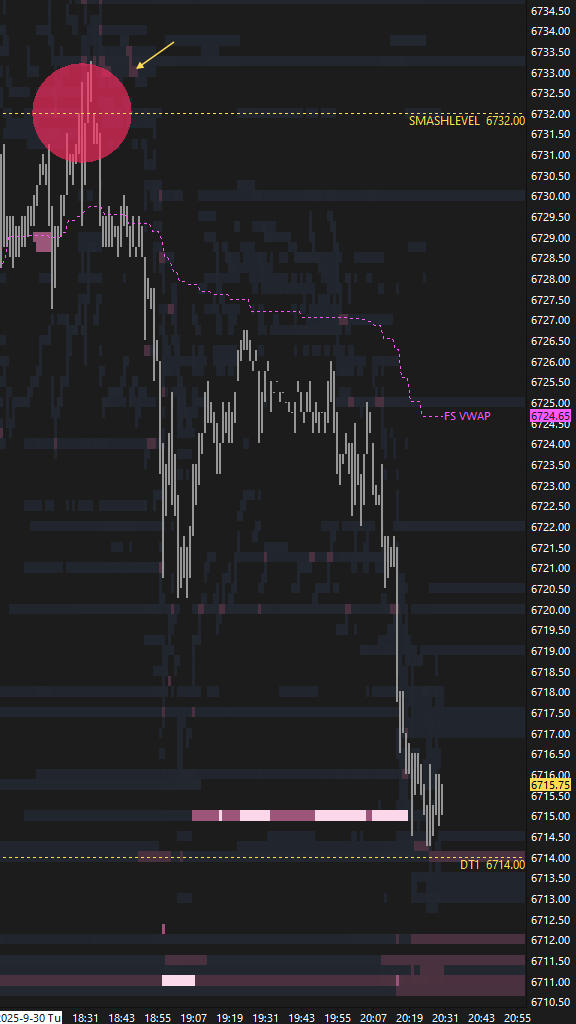
The overnight session kicked off with an immediate test of the Smashlevel at 6732, where sellers were active (see Figure 1). From there, price quickly tagged DT1 at 6714—a level aligned with several key references, where buyers were expected to defend. Failure to hold that area would trap Tuesday’s closing-rally inventory and potentially open the door to the final downside target at 6687. Buyers ultimately failed to defend 6714, leading to a quick drop to test the FDT at 6687, where downside momentum stalled. A pre-open bounce then unfolded, driving price back to 6714.
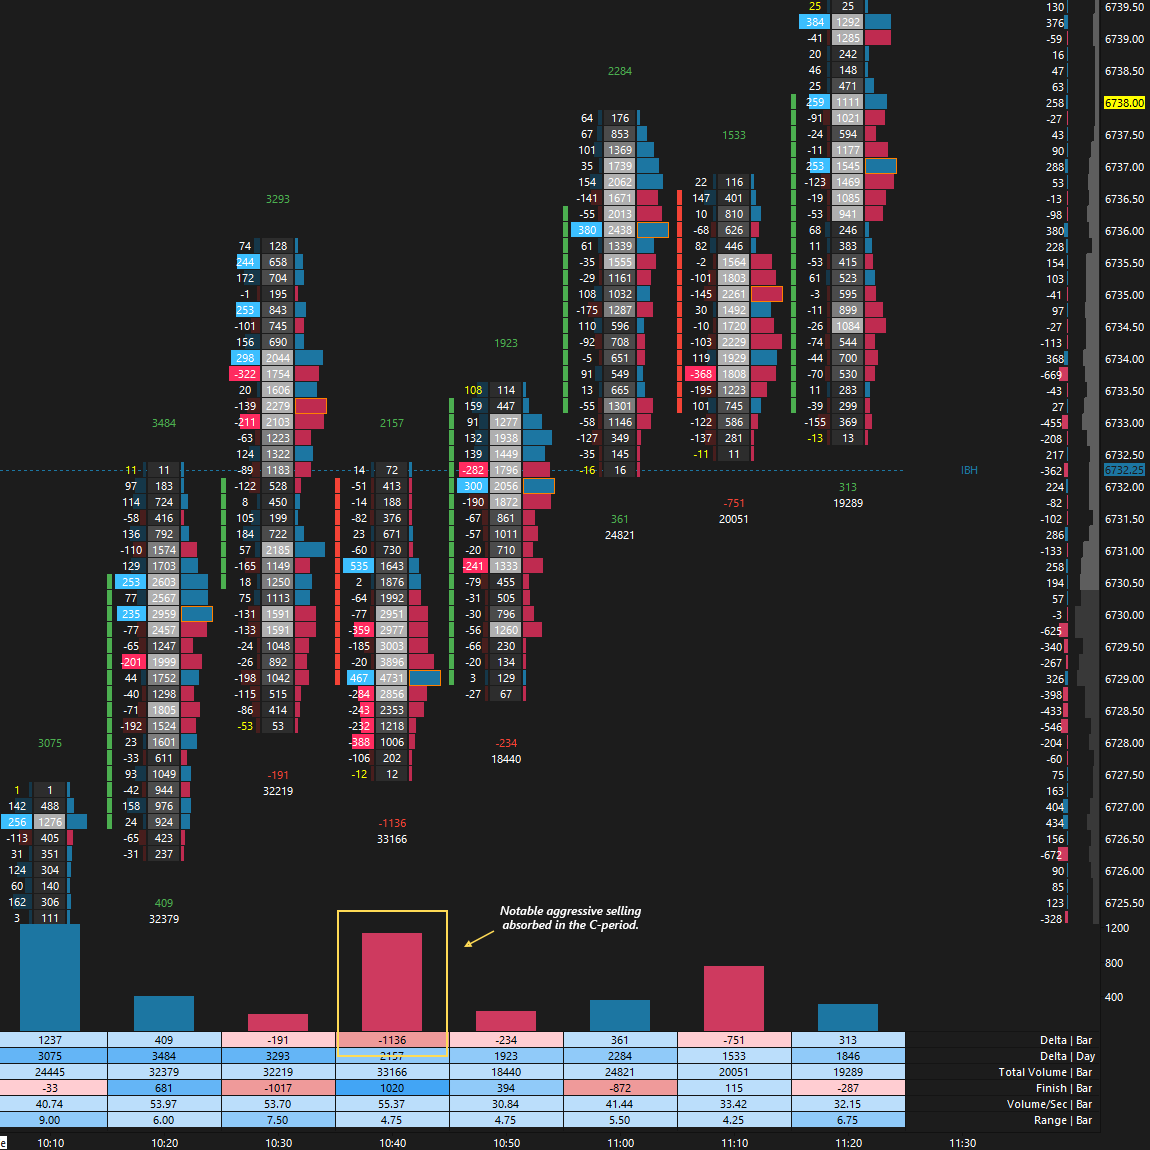
The RTH session opened within Tuesday’s value area, suggesting that all inventory above Tuesday’s value was in a tough spot if sellers could maintain below 6714. However, that thesis was thrown out the window almost immediately, as the market showed zero interest in trading within Tuesday’s value. The Smashlevel at 6732 capped the upside during the initial balance, but once buyers extended the range in the C-period, absorbed the subsequent pullback, and defended the retest in the D-period, the auction shifted firmly into buyers’ control (see Figure 2). Reclaiming 6732—signaling acceptance within last Tuesday’s upper distribution—opened the door to cleaning up the all-time highs, marked by a poor/weak high. That scenario ultimately played out, with a new all-time high printing and tagging UT1 at 6767 in the process.
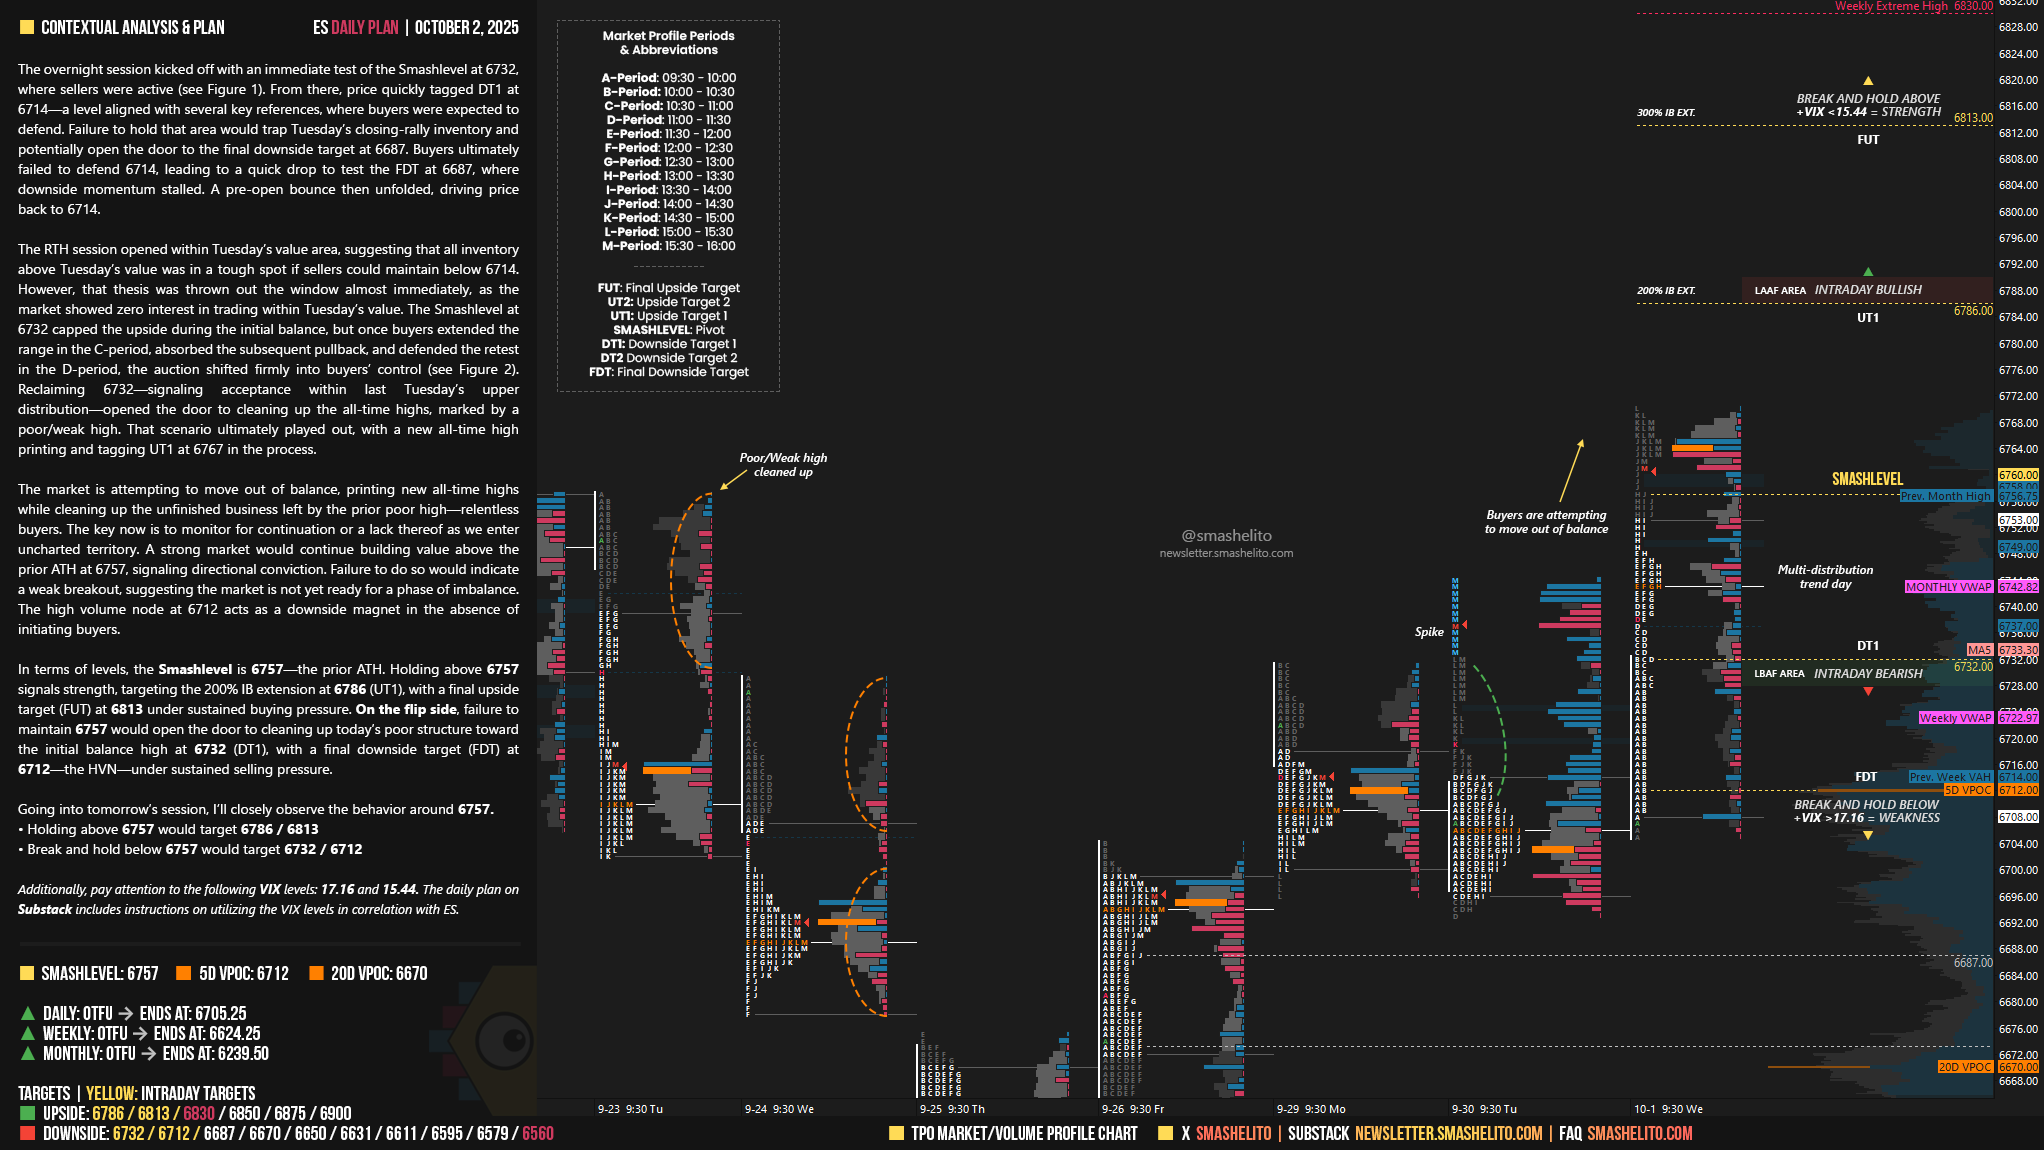
The market is attempting to move out of balance, printing new all-time highs while cleaning up the unfinished business left by the prior poor high—relentless buyers. The key now is to monitor for continuation or a lack thereof as we enter uncharted territory. A strong market would continue building value above the prior ATH at 6757, signaling directional conviction. Failure to do so would indicate a weak breakout, suggesting the market is not yet ready for a phase of imbalance. The high volume node at 6712 acts as a downside magnet in the absence of initiating buyers.
In terms of levels, the Smashlevel is 6757—the prior ATH. Holding above 6757 signals strength, targeting the 200% IB extension at 6786 (UT1), with a final upside target (FUT) at 6813 under sustained buying pressure.
On the flip side, failure to maintain 6757 would open the door to cleaning up today’s poor structure toward the initial balance high at 6732 (DT1), with a final downside target (FDT) at 6712—the HVN—under sustained selling pressure.
Levels of Interest
Going into tomorrow’s session, I’ll closely observe the behavior around 6757.
Holding above 6757 would target 6786 / 6813
Break and hold below 6757 would target 6732 / 6712
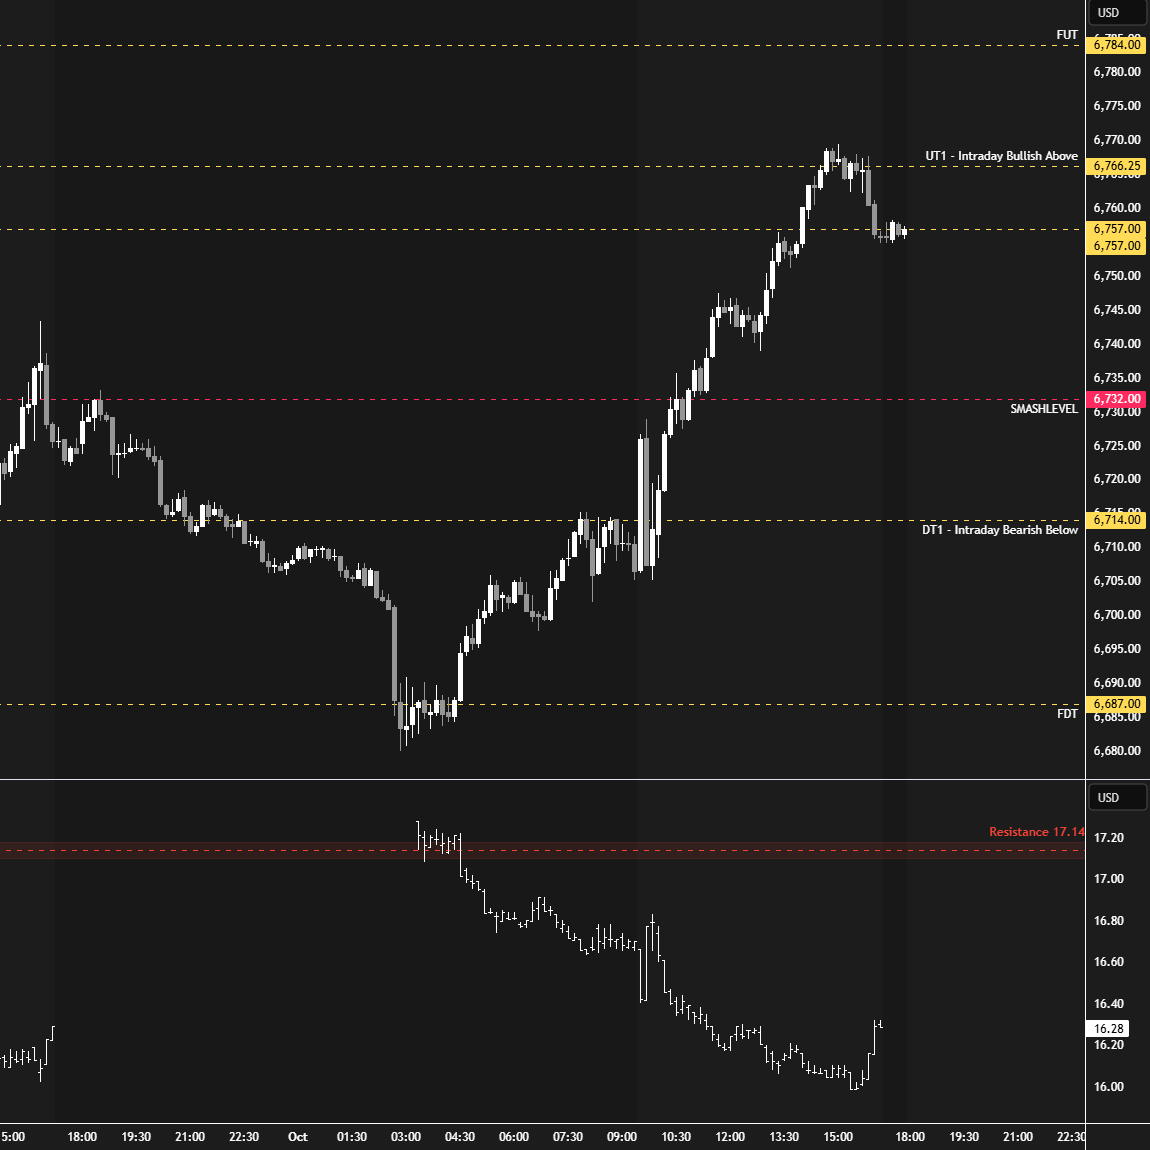
Additionally, pay attention to the following VIX levels: 17.16 and 15.44. These levels can provide confirmation of strength or weakness.
Break and hold above 6813 with VIX below 15.44 would confirm strength.
Break and hold below 6712 with VIX above 17.16 would confirm weakness.
Overall, it's important to exercise caution when trading outside of the highlighted yellow levels. A non-cooperative VIX may suggest possible reversals i.e trade setups.
Guys have a closer look at 6732 finish bar delta 1020 positive showing strength
Hell yeah 🍻