
ES Daily Plan | October 16, 2025
Market Context & Key Levels for the Day Ahead

— For new subscribers
The yellow levels highlighted at the bottom left of the chart are the primary intraday levels I focus on. To avoid impulsive decisions at poor trade locations, I follow a simple but effective rule: exercise caution when initiating trades outside of these yellow levels.
This means I’m cautious about chasing longs above the Final Upside Target (FUT) and shorts below the Final Downside Target (FDT). It’s important to understand that not chasing does not imply initiating a trade in the opposite direction — discipline over impulse.
Be sure to review the ES Weekly Plan | October 13-17, 2025 for a broader perspective, key levels, and market expectations for the week ahead.
Contextual Analysis & Plan
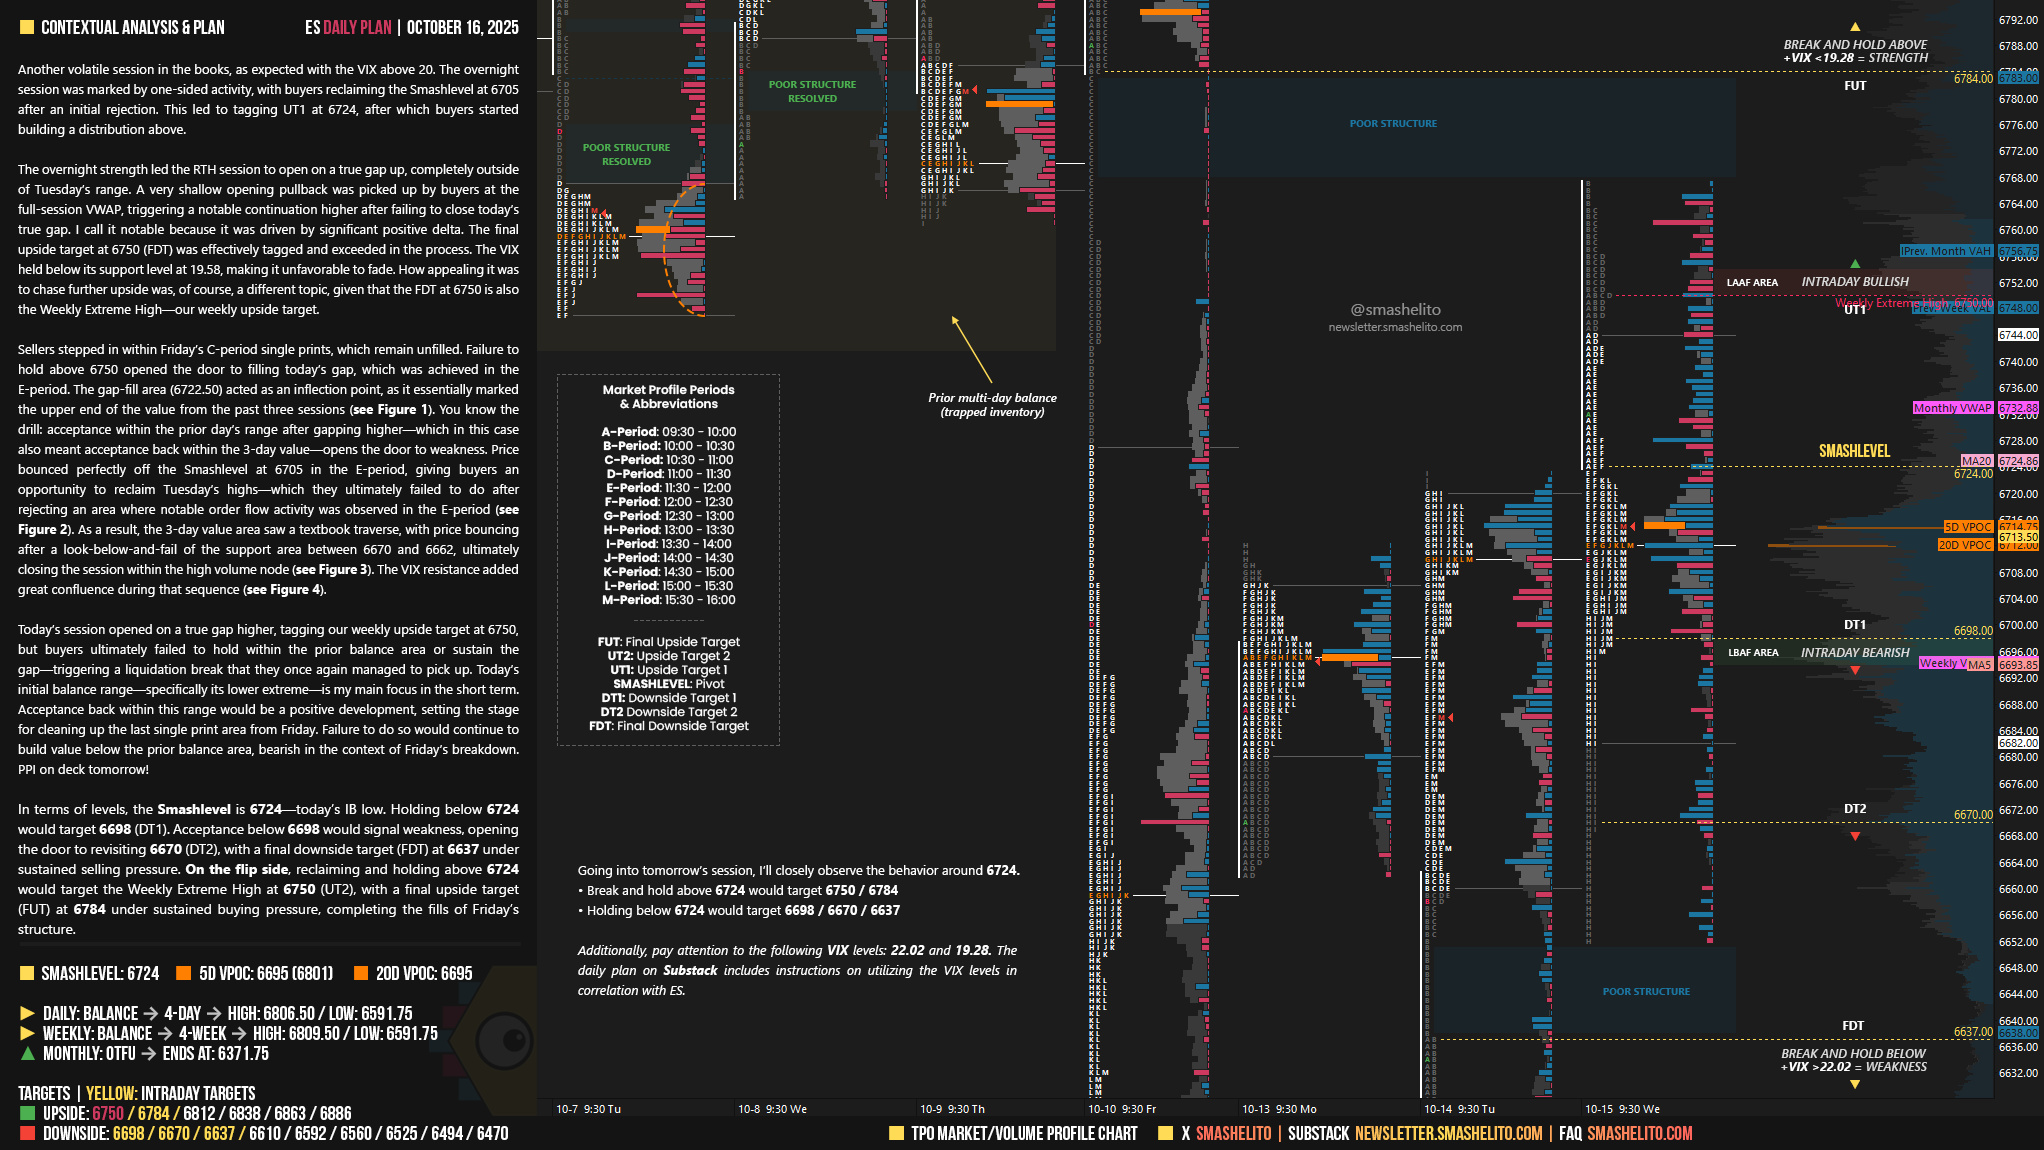
Another volatile session in the books, as expected with the VIX above 20. The overnight session was marked by one-sided activity, with buyers reclaiming the Smashlevel at 6705 after an initial rejection. This led to tagging UT1 at 6724, after which buyers started building a distribution above.
The overnight strength led the RTH session to open on a true gap up, completely outside of Tuesday’s range. A very shallow opening pullback was picked up by buyers at the full-session VWAP, triggering a notable continuation higher after failing to close today’s true gap. I call it notable because it was driven by significant positive delta. The final upside target at 6750 (FDT) was effectively tagged and exceeded in the process. The VIX held below its support level at 19.58, making it unfavorable to fade. How appealing it was to chase further upside was, of course, a different topic, given that the FDT at 6750 is also the Weekly Extreme High—our weekly upside target.
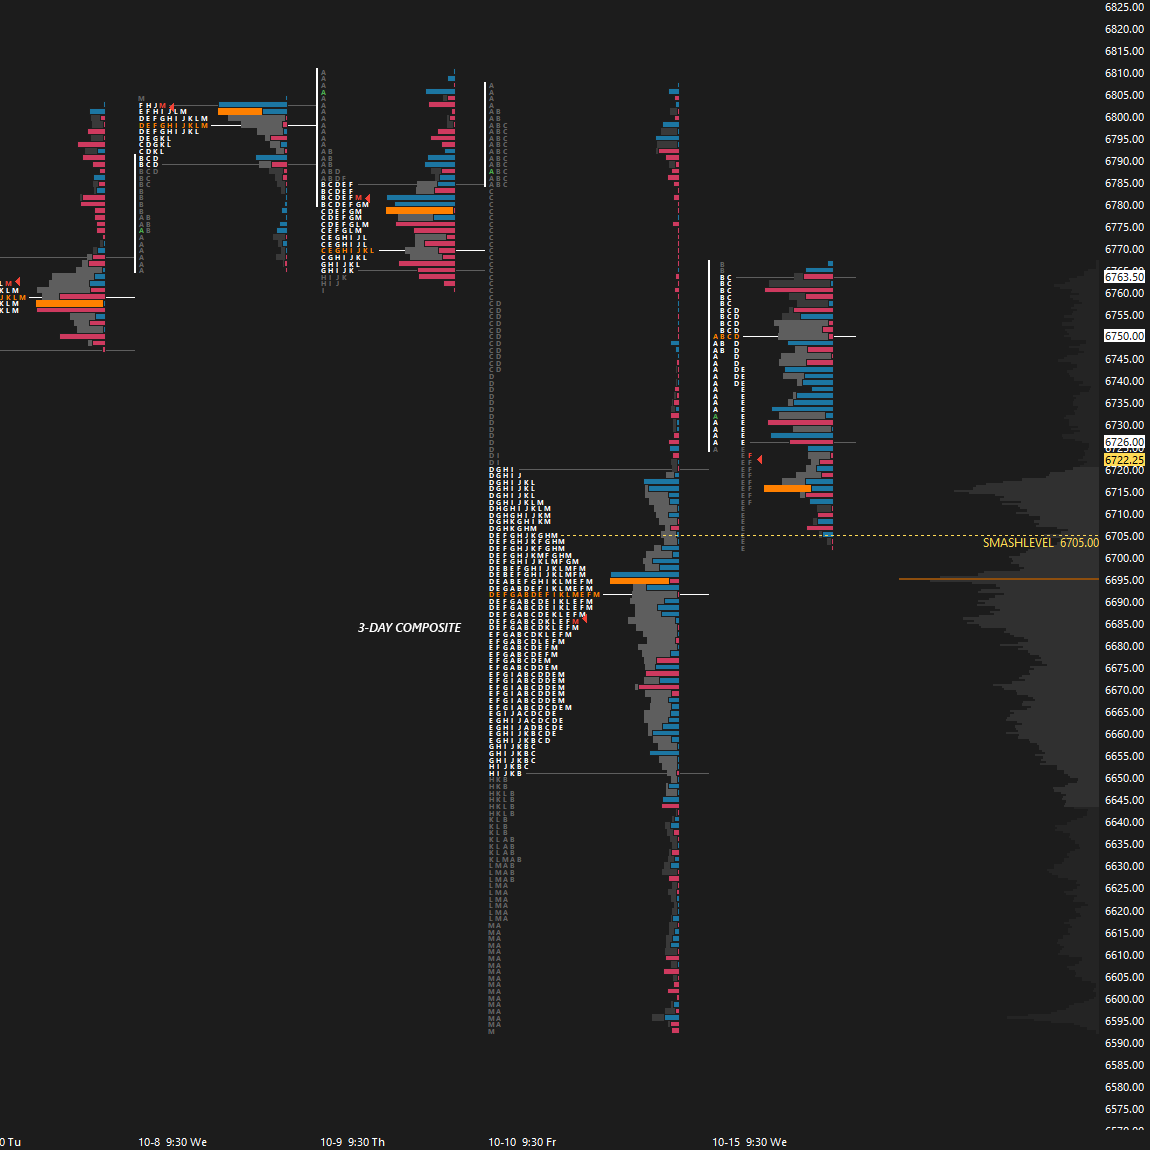
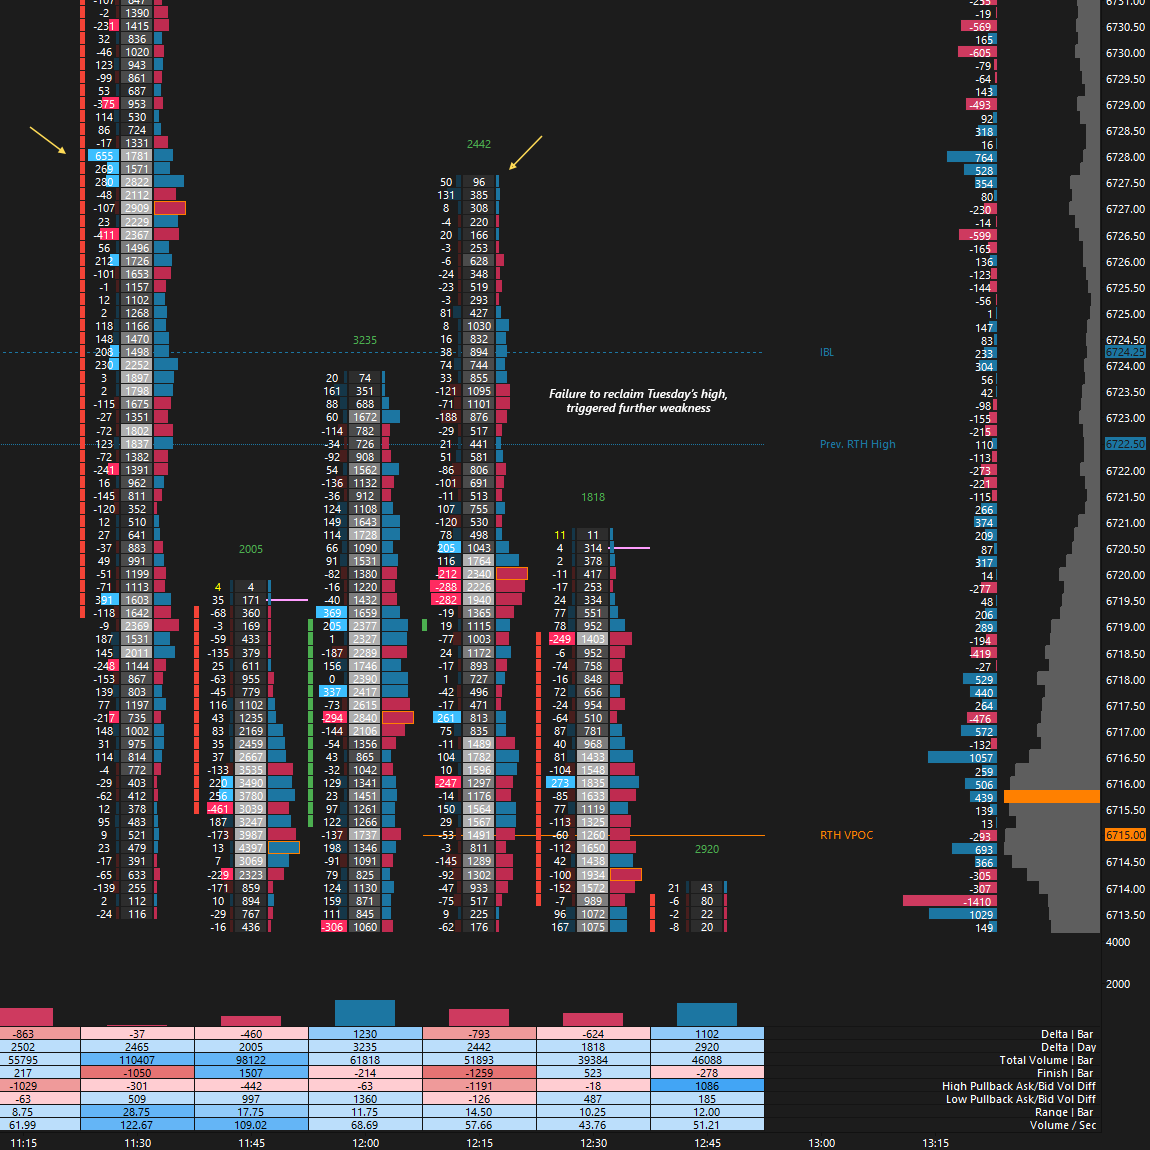
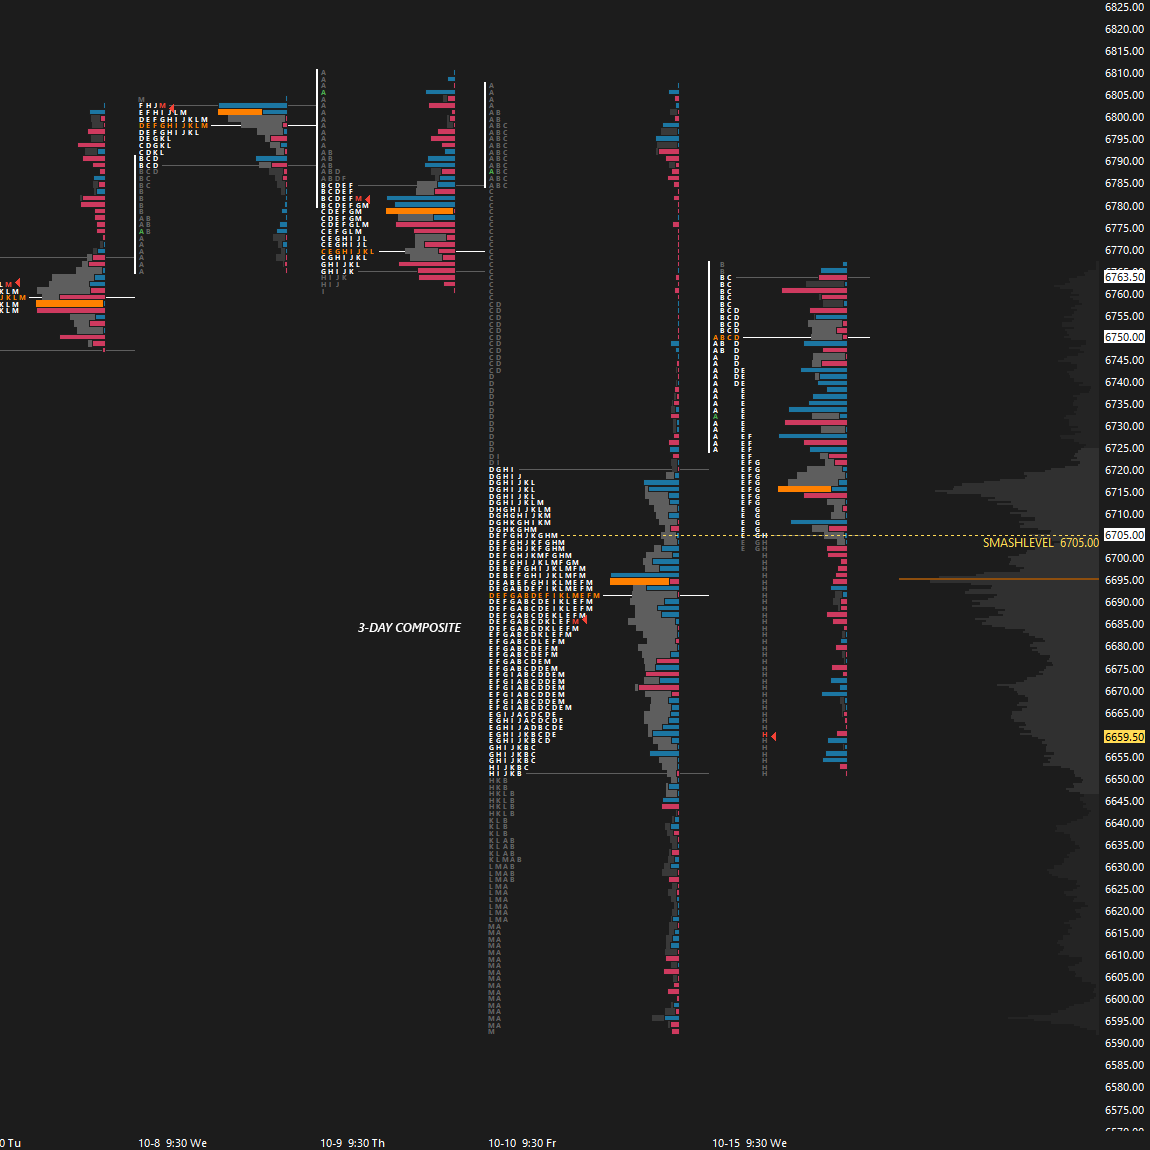
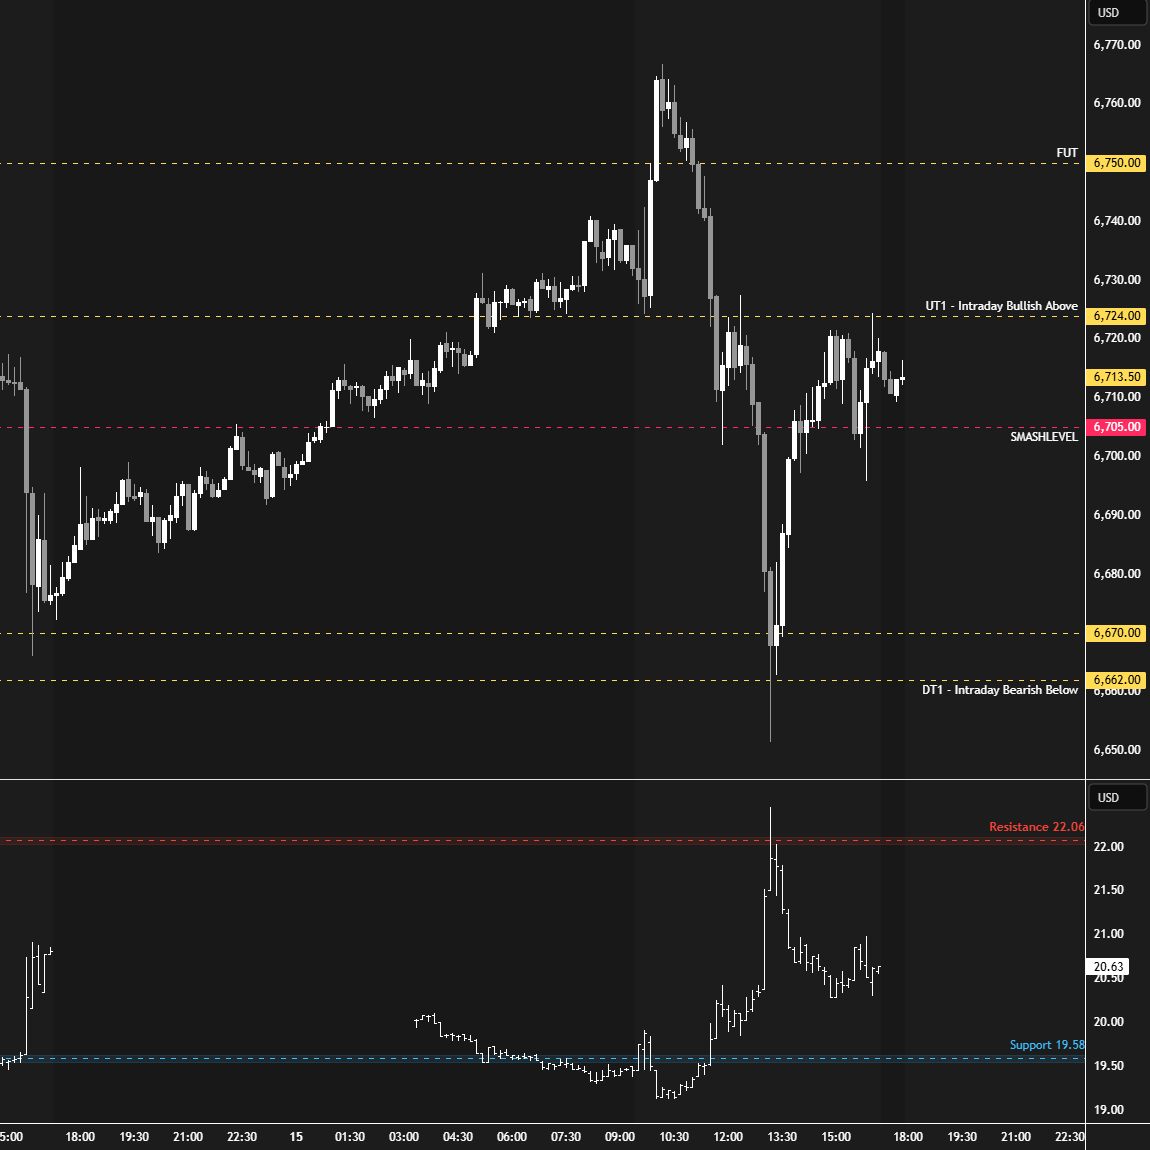
Sellers stepped in within Friday’s C-period single prints, which remain unfilled. Failure to hold above 6750 opened the door to filling today’s gap, which was achieved in the E-period. The gap-fill area (6722.50) acted as an inflection point, as it essentially marked the upper end of the value from the past three sessions (see Figure 1). You know the drill: acceptance within the prior day’s range after gapping higher—which in this case also meant acceptance back within the 3-day value—opens the door to weakness. Price bounced perfectly off the Smashlevel at 6705 in the E-period, giving buyers an opportunity to reclaim Tuesday’s highs—which they ultimately failed to do after rejecting an area where notable order flow activity was observed in the E-period (see Figure 2). As a result, the 3-day value area saw a textbook traverse, with price bouncing after a look-below-and-fail of the support area between 6670 and 6662, ultimately closing the session within the high volume node (see Figure 3). The VIX resistance added great confluence during that sequence (see Figure 4).
Today’s session opened on a true gap higher, tagging our weekly upside target at 6750, but buyers ultimately failed to hold within the prior balance area or sustain the gap—triggering a liquidation break that they once again managed to pick up. Today’s initial balance range—specifically its lower extreme—is my main focus in the short term. Acceptance back within this range would be a positive development, setting the stage for cleaning up the last single print area from Friday. Failure to do so would continue to build value below the prior balance area, bearish in the context of Friday’s breakdown. PPI on deck tomorrow!
In terms of levels, the Smashlevel is 6724—today’s IB low. Holding below 6724 would target 6698 (DT1). Acceptance below 6698 would signal weakness, opening the door to revisiting 6670 (DT2), with a final downside target (FDT) at 6637 under sustained selling pressure.
On the flip side, reclaiming and holding above 6724 would target the Weekly Extreme High at 6750 (UT2), with a final upside target (FUT) at 6784 under sustained buying pressure, completing the fills of Friday’s structure.
Levels of Interest
Going into tomorrow’s session, I’ll closely observe the behavior around 6724.
Break and hold above 6724 would target 6750 / 6784
Holding below 6724 would target 6698 / 6670 / 6637
Additionally, pay attention to the following VIX levels: 22.02 and 19.28. These levels can provide confirmation of strength or weakness.
Break and hold above 6784 with VIX below 19.28 would confirm strength.
Break and hold below 6637 with VIX above 22.02 would confirm weakness.
Overall, it's important to exercise caution when trading outside of the highlighted yellow levels. A non-cooperative VIX may suggest possible reversals i.e trade setups.
The amount of work you put into this is very appreciated! Thank you.
Hi Smash. Since Spring of 2023 I read your newsletter. At the beginning I didn't know anything about the Market profile and Auction Theory. Your charts and your terminology were incomprehensible, also because English is not my mother and I was studying macro analyses only. Until you posted the link for Peter Steidlmaye's Market profile free PDF. After that I started to understand your newsletter but again not perfectly well.
James Dalton admitted in his interviews that the terminology is completely different to the traditional trading world.
I noticed that , lately, you started expressing your knowledge and thoughts in a more accessible way for those who don't know completely well the Market Profile's and Auction Theory's terminology and don't have access to tge Sierra charts, footprint and DOM. You help a lot when you indicate levels/prices in numbers.
Since I understood how Market Profile works I don't read any other way of trading method.
Thank you very much for your valuable work which is unparalleled to any other in the Internet. To me you're Peter Steidlmaye's and James Dalton's successor.