
ES Daily Plan | October 15, 2025
Market Context & Key Levels for the Day Ahead

— For new subscribers
The yellow levels highlighted at the bottom left of the chart are the primary intraday levels I focus on. To avoid impulsive decisions at poor trade locations, I follow a simple but effective rule: exercise caution when initiating trades outside of these yellow levels.
This means I’m cautious about chasing longs above the Final Upside Target (FUT) and shorts below the Final Downside Target (FDT). It’s important to understand that not chasing does not imply initiating a trade in the opposite direction — discipline over impulse.
Be sure to review the ES Weekly Plan | October 13-17, 2025 for a broader perspective, key levels, and market expectations for the week ahead.
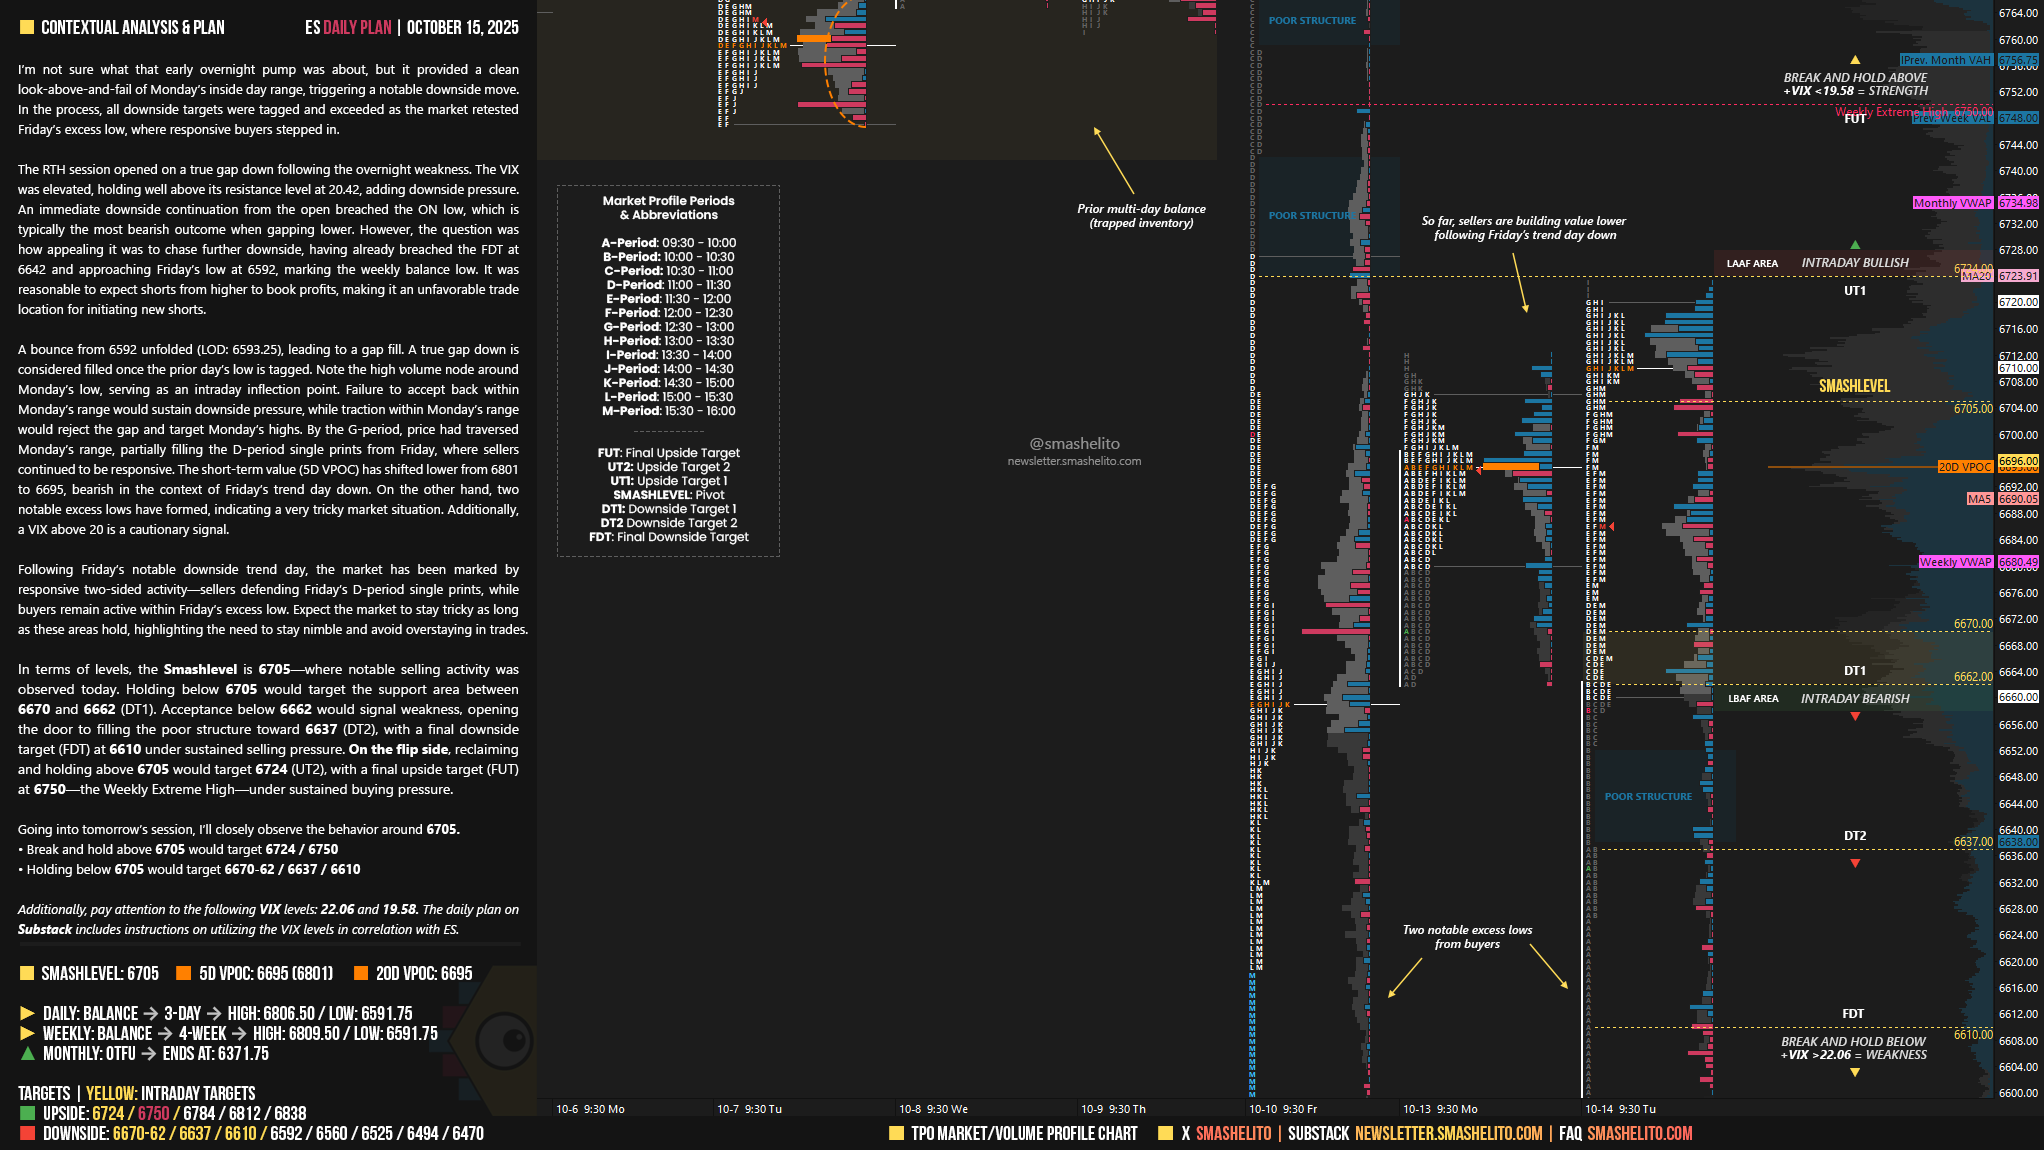
Contextual Analysis & Plan
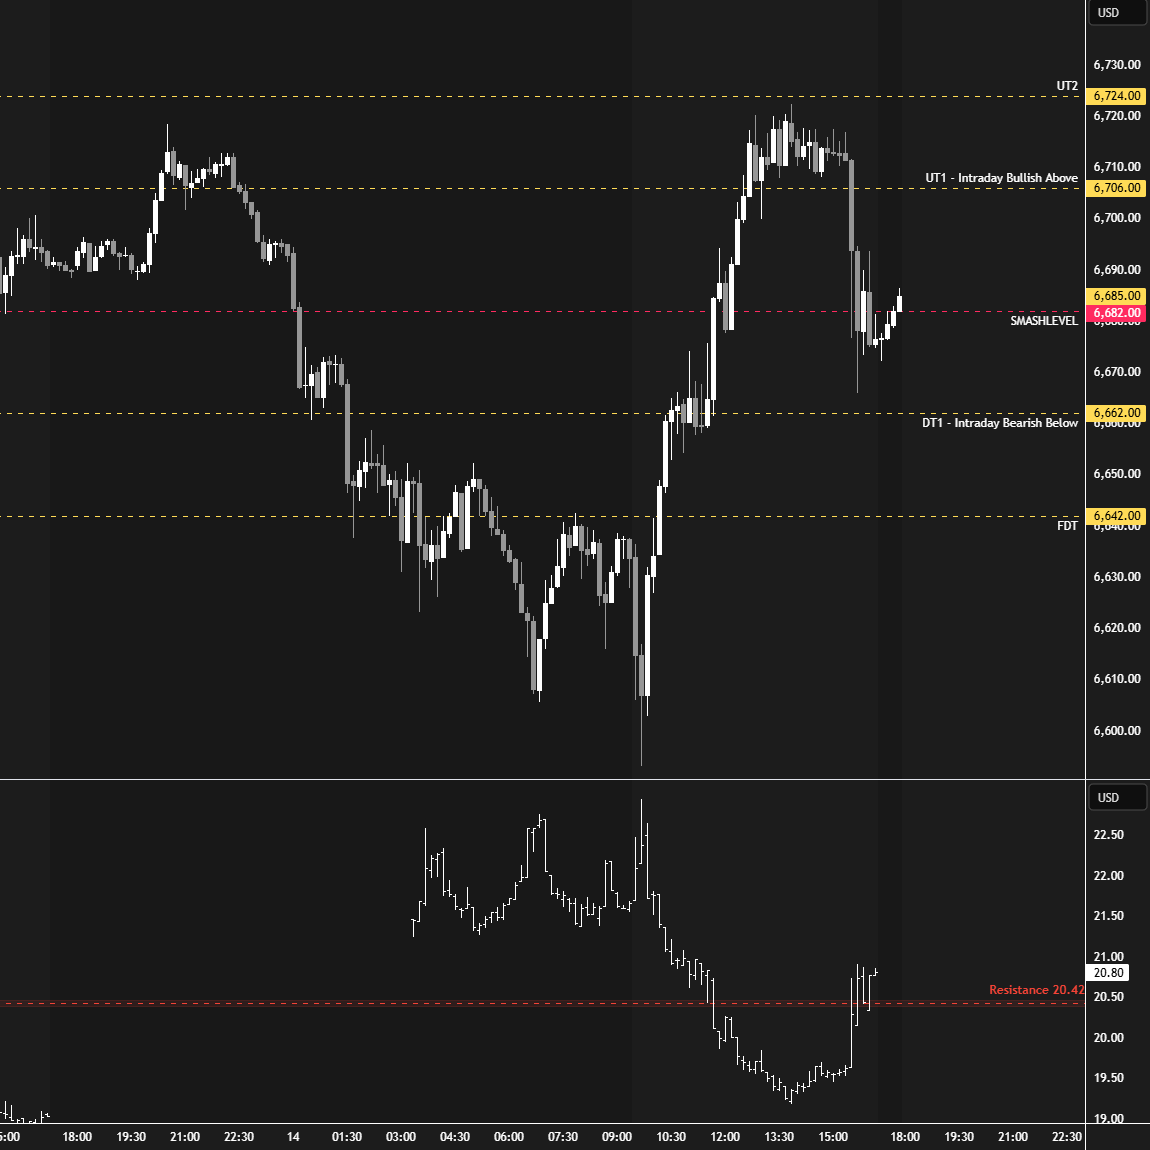
I’m not sure what that early overnight pump was about, but it provided a clean look-above-and-fail of Monday’s inside day range, triggering a notable downside move. In the process, all downside targets were tagged and exceeded as the market retested Friday’s excess low, where responsive buyers stepped in.
The RTH session opened on a true gap down following the overnight weakness. The VIX was elevated, holding well above its resistance level at 20.42, adding downside pressure. An immediate downside continuation from the open breached the ON low, which is typically the most bearish outcome when gapping lower. However, the question was how appealing it was to chase further downside, having already breached the FDT at 6642 and approaching Friday’s low at 6592, marking the weekly balance low. It was reasonable to expect shorts from higher to book profits, making it an unfavorable trade location for initiating new shorts.
A bounce from 6592 unfolded (LOD: 6593.25), leading to a gap fill. A true gap down is considered filled once the prior day’s low is tagged. Note the high volume node around Monday’s low, serving as an intraday inflection point. Failure to accept back within Monday’s range would sustain downside pressure, while traction within Monday’s range would reject the gap and target Monday’s highs. By the G-period, price had traversed Monday’s range, partially filling the D-period single prints from Friday, where sellers continued to be responsive. The short-term value (5D VPOC) has shifted lower from 6801 to 6695, bearish in the context of Friday’s trend day down. On the other hand, two notable excess lows have formed, indicating a very tricky market situation. Additionally, a VIX above 20 is a cautionary signal.
Following Friday’s notable downside trend day, the market has been marked by responsive two-sided activity—sellers defending Friday’s D-period single prints, while buyers remain active within Friday’s excess low. Expect the market to stay tricky as long as these areas hold, highlighting the need to stay nimble and avoid overstaying in trades.
In terms of levels, the Smashlevel is 6705—where notable selling activity was observed today. Holding below 6705 would target the support area between 6670 and 6662 (DT1). Acceptance below 6662 would signal weakness, opening the door to filling the poor structure toward 6637 (DT2), with a final downside target (FDT) at 6610 under sustained selling pressure.
On the flip side, reclaiming and holding above 6705 would target 6724 (UT2), with a final upside target (FUT) at 6750—the Weekly Extreme High—under sustained buying pressure.
Levels of Interest
Going into tomorrow’s session, I’ll closely observe the behavior around 6705.
Break and hold above 6705 would target 6724 / 6750
Holding below 6705 would target 6670-62 / 6637 / 6610
Additionally, pay attention to the following VIX levels: 22.06 and 19.58. These levels can provide confirmation of strength or weakness.
Break and hold above 6750 with VIX below 19.58 would confirm strength.
Break and hold below 6610 with VIX above 22.06 would confirm weakness.
Overall, it's important to exercise caution when trading outside of the highlighted yellow levels. A non-cooperative VIX may suggest possible reversals i.e trade setups.
Weekly balance almost identical to daily balance. Hm...
always great info/
We also almost tapped the rollover gap at 6588.25 you provided!!