
ES Daily Plan | October 10, 2025
Market Context & Key Levels for the Day Ahead

— For new subscribers
The yellow levels highlighted at the bottom left of the chart are the primary intraday levels I focus on. To avoid impulsive decisions at poor trade locations, I follow a simple but effective rule: exercise caution when initiating trades outside of these yellow levels.
This means I’m cautious about chasing longs above the Final Upside Target (FUT) and shorts below the Final Downside Target (FDT). It’s important to understand that not chasing does not imply initiating a trade in the opposite direction — discipline over impulse.
Be sure to review the ES Weekly Plan | October 6-10, 2025 for a broader perspective, key levels, and market expectations for the week ahead.
Contextual Analysis & Plan
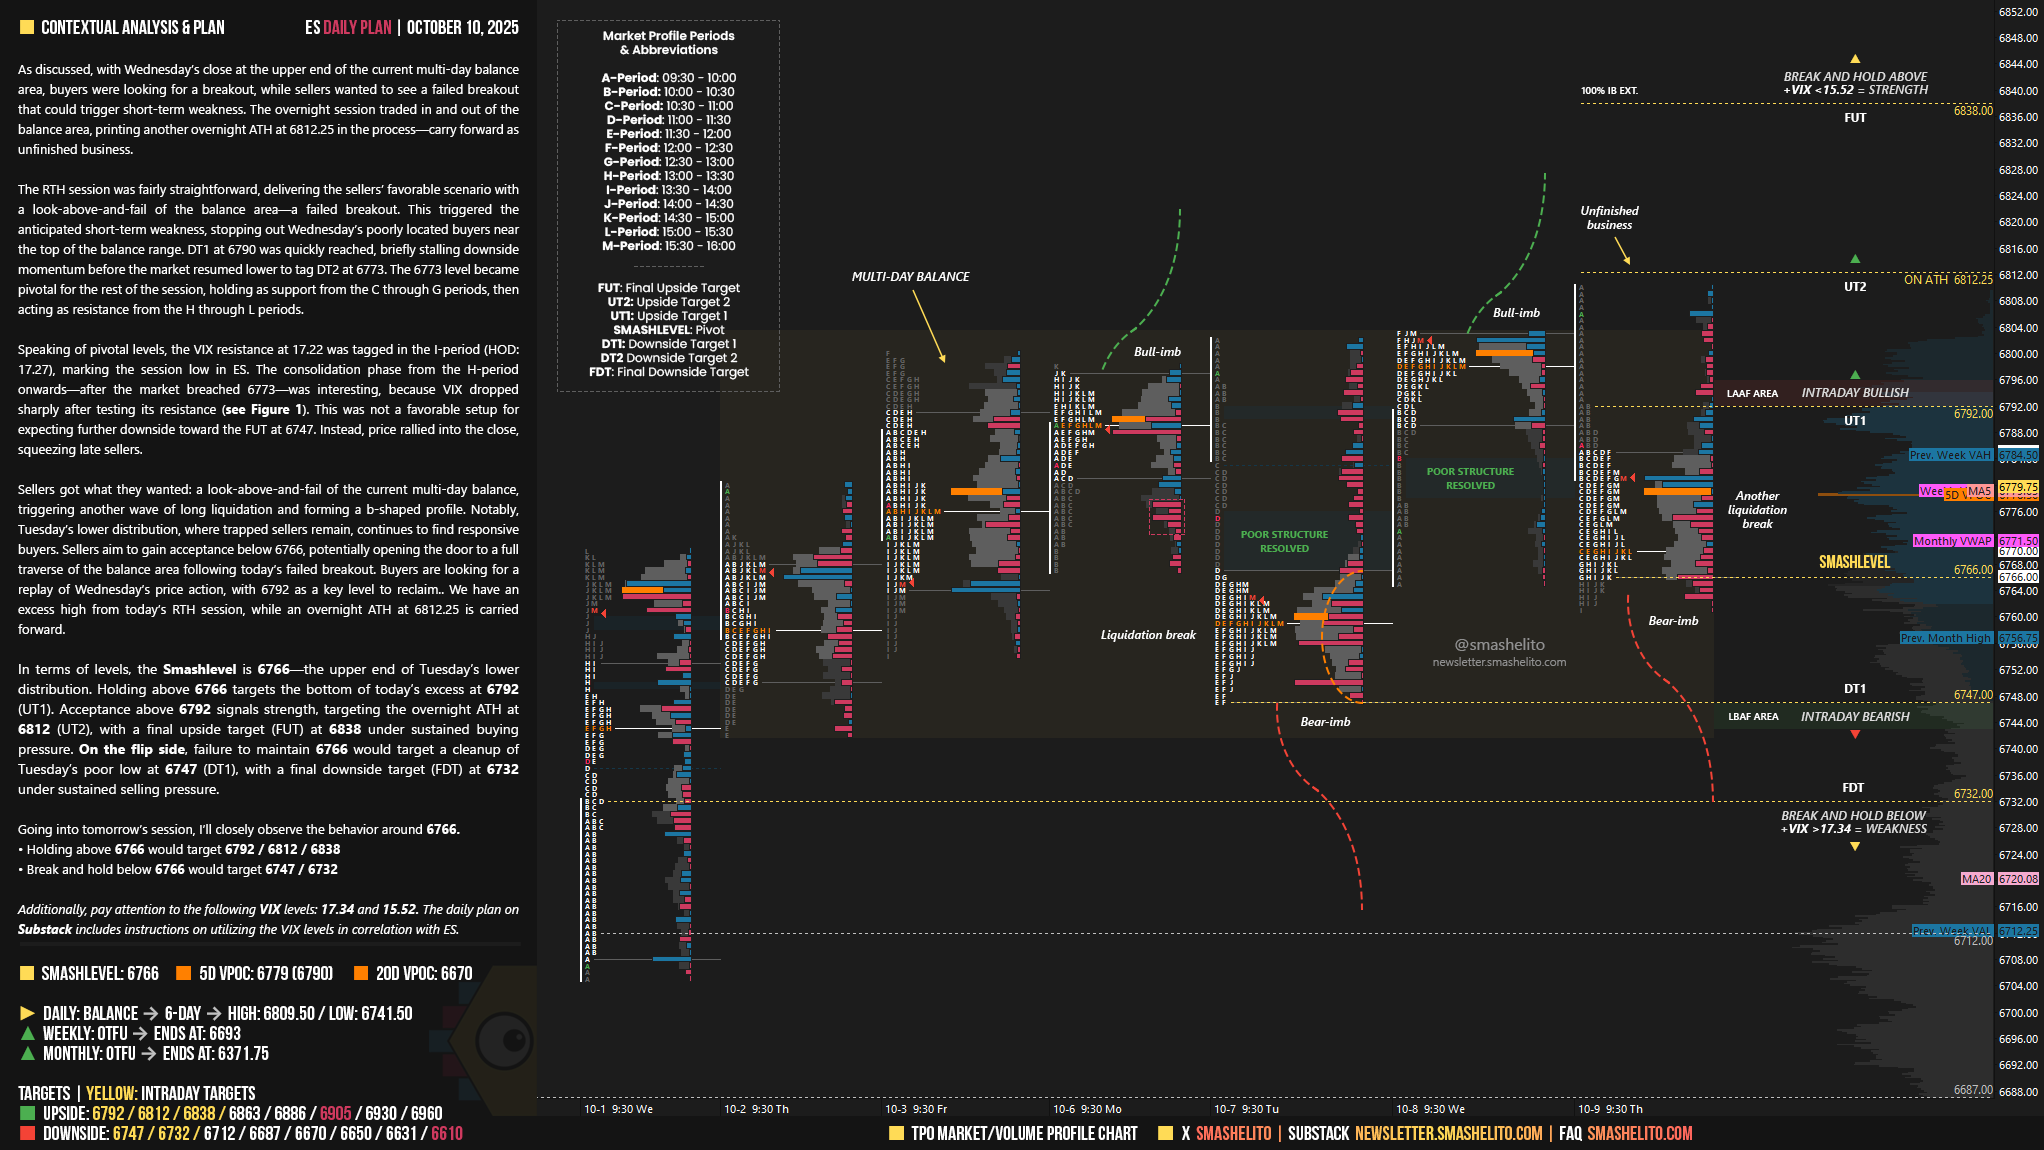
As discussed, with Wednesday’s close at the upper end of the current multi-day balance area, buyers were looking for a breakout, while sellers wanted to see a failed breakout that could trigger short-term weakness. The overnight session traded in and out of the balance area, printing another overnight ATH at 6812.25 in the process—carry forward as unfinished business.
The RTH session was fairly straightforward, delivering the sellers’ favorable scenario with a look-above-and-fail of the balance area—a failed breakout. This triggered the anticipated short-term weakness, stopping out Wednesday’s poorly located buyers near the top of the balance range. DT1 at 6790 was quickly reached, briefly stalling downside momentum before the market resumed lower to tag DT2 at 6773. The 6773 level became pivotal for the rest of the session, holding as support from the C through G periods, then acting as resistance from the H through L periods.
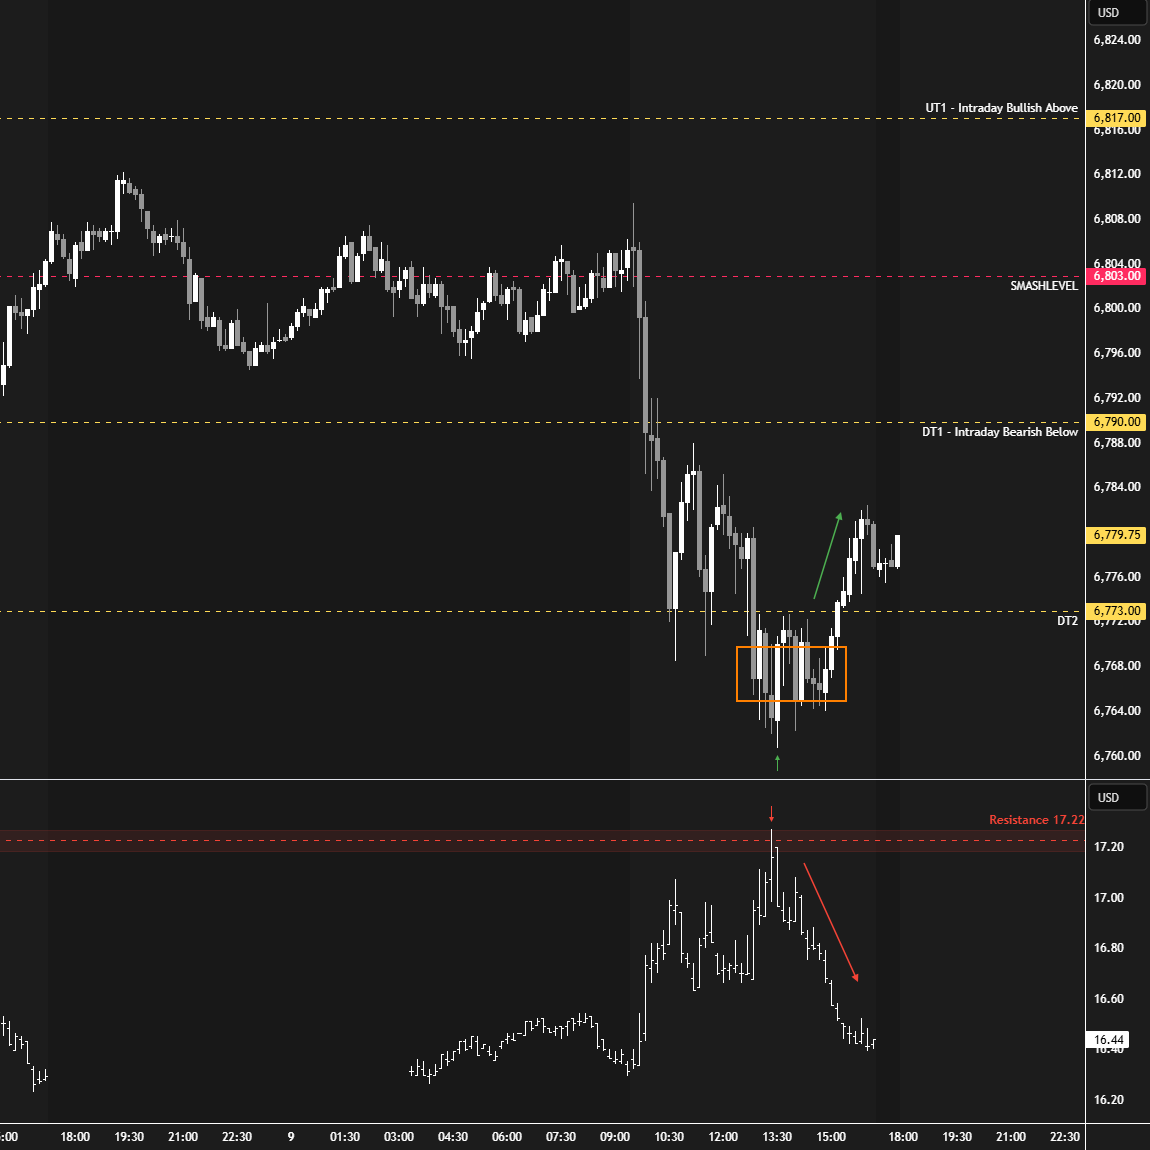
Speaking of pivotal levels, the VIX resistance at 17.22 was tagged in the I-period (HOD: 17.27), marking the session low in ES. The consolidation phase from the H-period onwards—after the market breached 6773—was interesting, because VIX dropped sharply after testing its resistance (see Figure 1). This was not a favorable setup for expecting further downside toward the FUT at 6747. Instead, price rallied into the close, squeezing late sellers.
Sellers got what they wanted: a look-above-and-fail of the current multi-day balance, triggering another wave of long liquidation and forming a b-shaped profile. Notably, Tuesday’s lower distribution, where trapped sellers remain, continues to find responsive buyers. Sellers aim to gain acceptance below 6766, potentially opening the door to a full traverse of the balance area following today’s failed breakout. Buyers are looking for a replay of Wednesday’s price action, with 6792 as a key level to reclaim.. We have an excess high from today’s RTH session, while an overnight ATH at 6812.25 is carried forward.
In terms of levels, the Smashlevel is 6766—the upper end of Tuesday’s lower distribution. Holding above 6766 targets the bottom of today’s excess at 6792 (UT1). Acceptance above 6792 signals strength, targeting the overnight ATH at 6812 (UT2), with a final upside target (FUT) at 6838 under sustained buying pressure.
On the flip side, failure to maintain 6766 would target a cleanup of Tuesday’s poor low at 6747 (DT1), with a final downside target (FDT) at 6732 under sustained selling pressure.
Levels of Interest
Going into tomorrow’s session, I’ll closely observe the behavior around 6766.
Holding above 6766 would target 6792 / 6812 / 6838
Break and hold below 6766 would target 6747 / 6732
Additionally, pay attention to the following VIX levels: 17.34 and 15.52. These levels can provide confirmation of strength or weakness.
Break and hold above 6838 with VIX below 15.52 would confirm strength.
Break and hold below 6732 with VIX above 17.34 would confirm weakness.
Overall, it's important to exercise caution when trading outside of the highlighted yellow levels. A non-cooperative VIX may suggest possible reversals i.e trade setups.
Thanks Smash! Closed all shorts at VIX resistance.
Smash you forgot to set today's unresolved poor structure