
ES Daily Plan | October 1, 2025
Market Context & Key Levels for the Day Ahead

— For new subscribers
The yellow levels highlighted at the bottom left of the chart are the primary intraday levels I focus on. To avoid impulsive decisions at poor trade locations, I follow a simple but effective rule: exercise caution when initiating trades outside of these yellow levels.
This means I’m cautious about chasing longs above the Final Upside Target (FUT) and shorts below the Final Downside Target (FDT). It’s important to understand that not chasing does not imply initiating a trade in the opposite direction — discipline over impulse.
Be sure to review the ES Weekly Plan | Sep 29 - Oct 3, 2025 for a broader perspective, key levels, and market expectations for the week ahead.
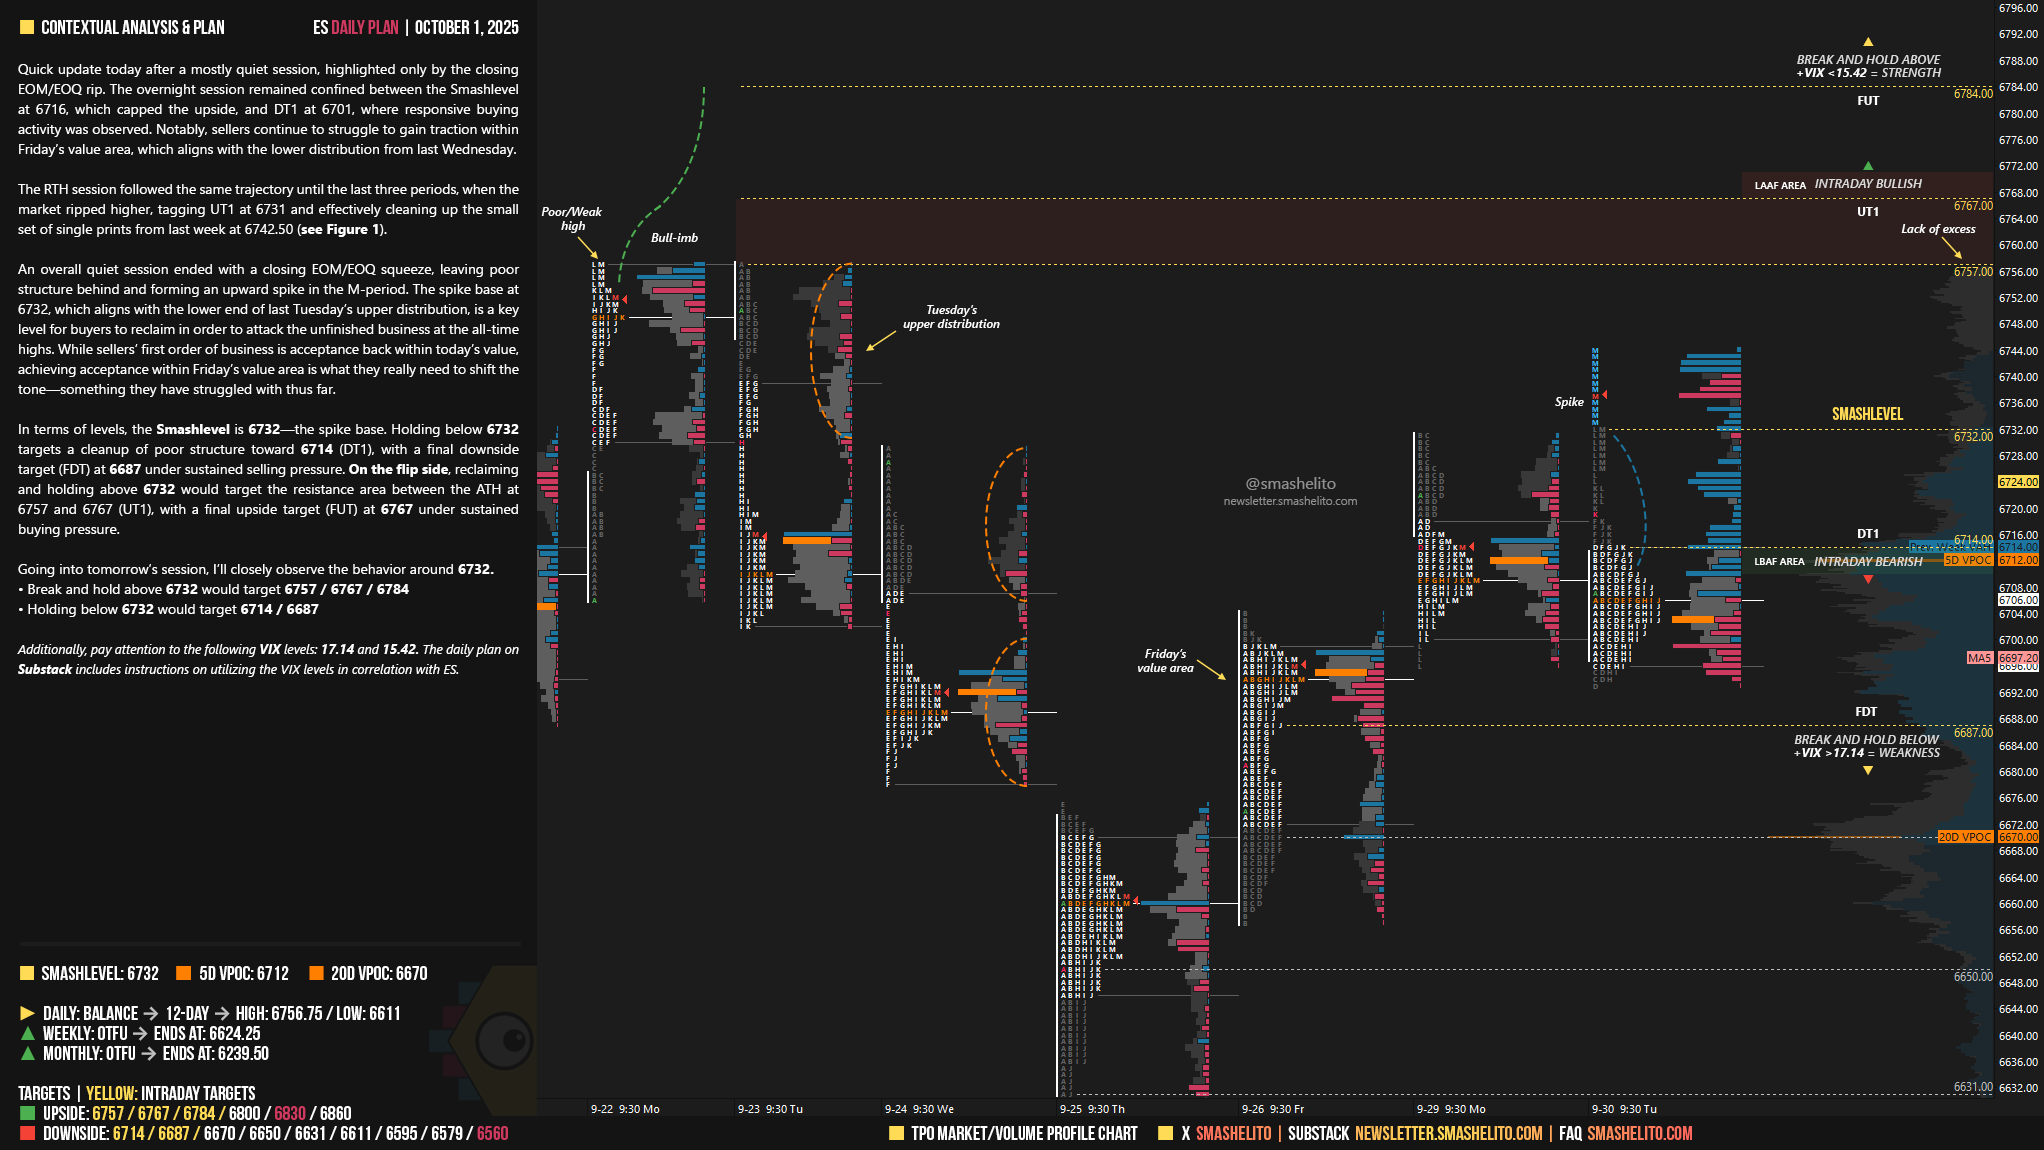
Contextual Analysis & Plan
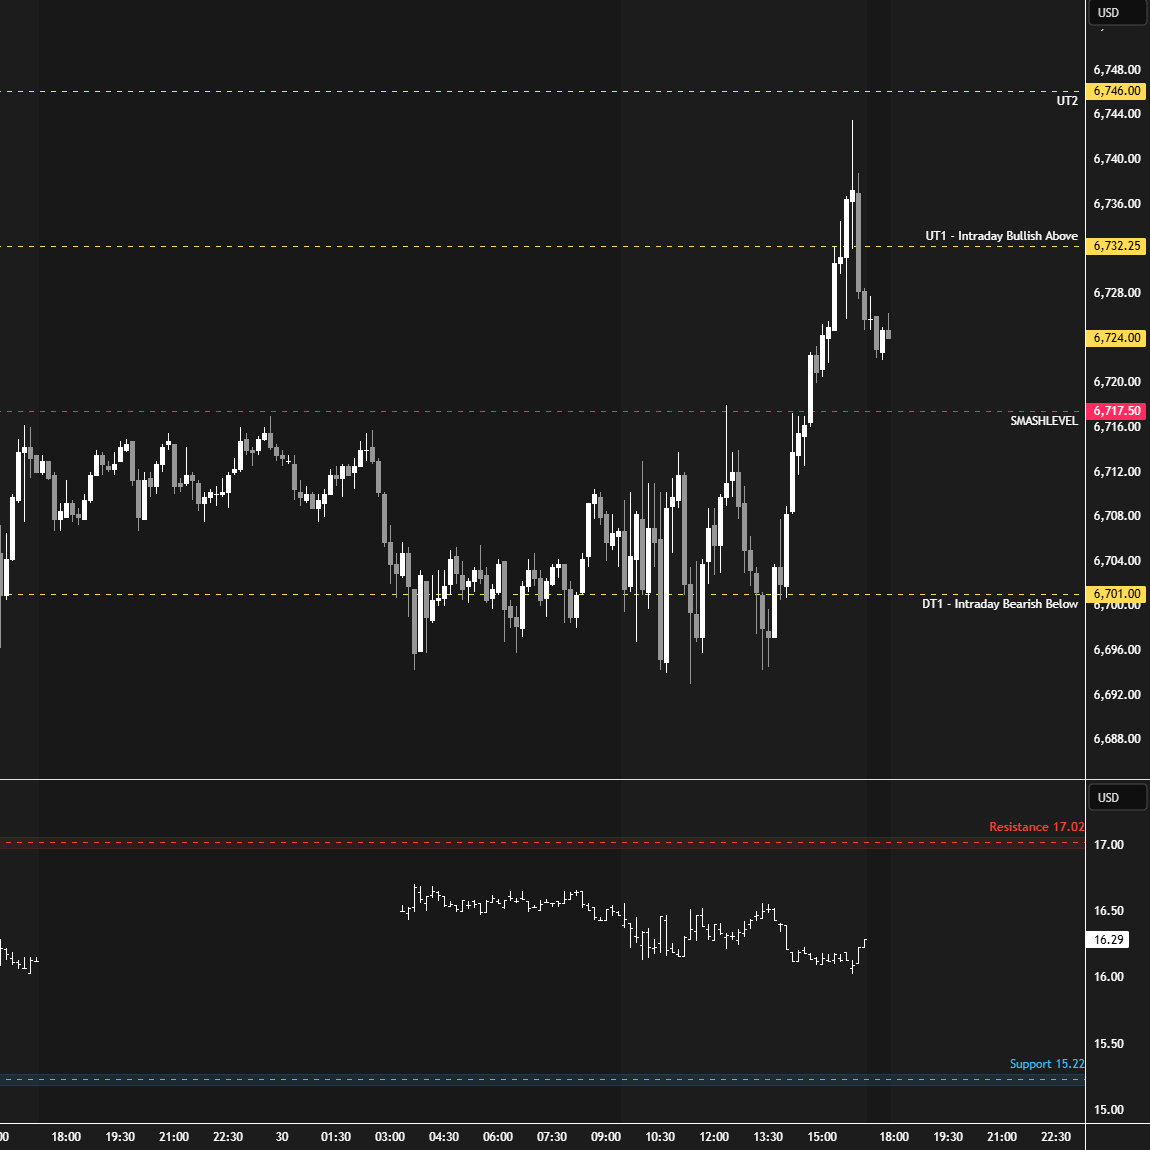
Quick update today after a mostly quiet session, highlighted only by the closing EOM/EOQ rip. The overnight session remained confined between the Smashlevel at 6716, which capped the upside, and DT1 at 6701, where responsive buying activity was observed. Notably, sellers continue to struggle to gain traction within Friday’s value area, which aligns with the lower distribution from last Wednesday.
The RTH session followed the same trajectory until the last three periods, when the market ripped higher, tagging UT1 at 6731 and effectively cleaning up the small set of single prints from last week at 6742.50 (see Figure 1).
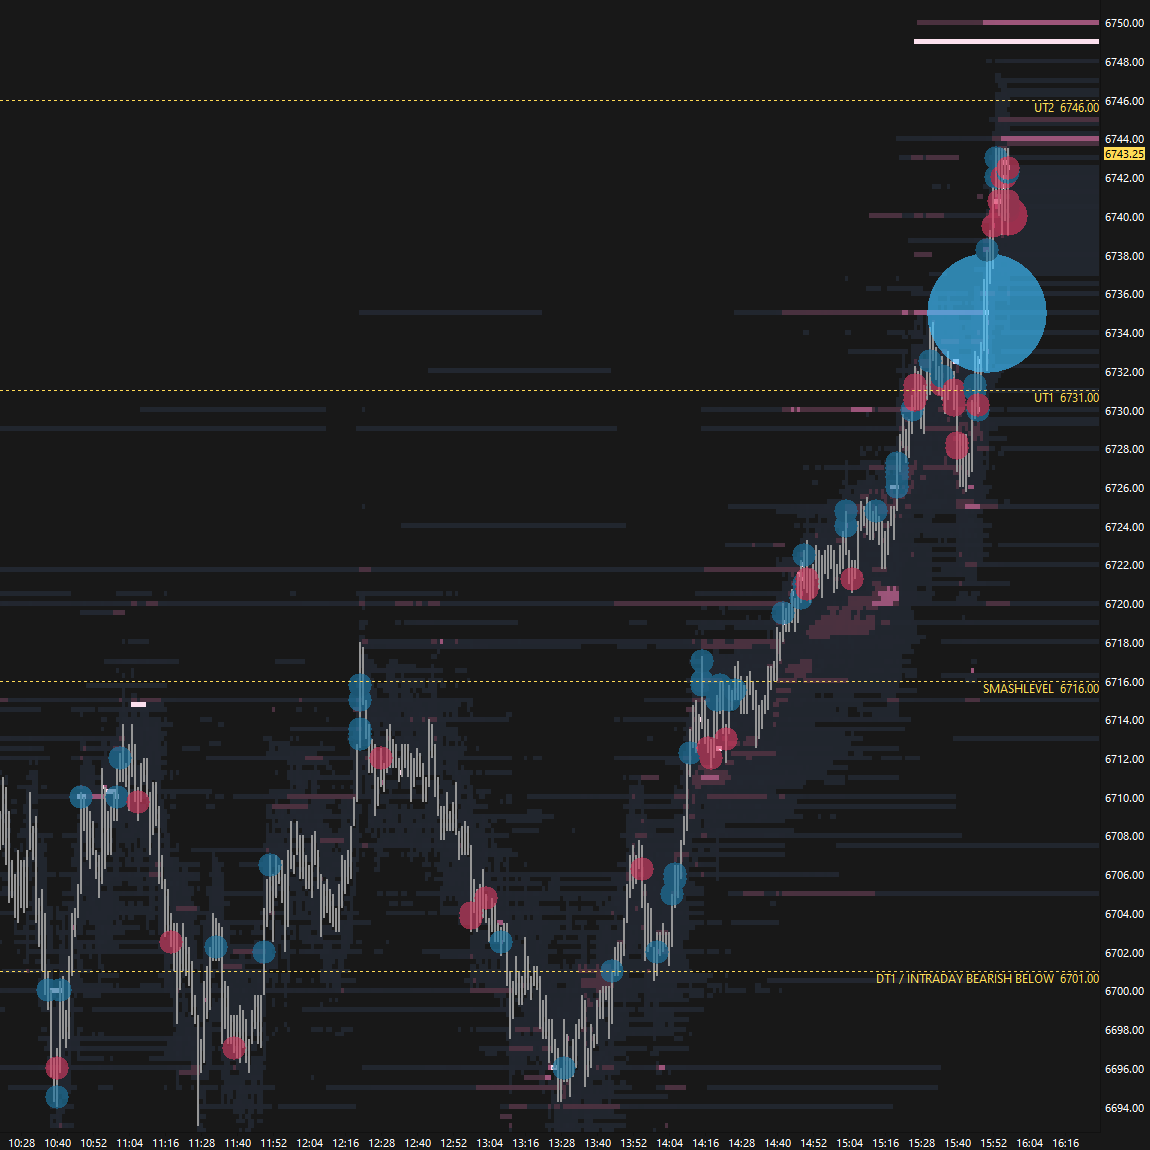
An overall quiet session ended with a closing EOM/EOQ squeeze, leaving poor structure behind and forming an upward spike in the M-period. The spike base at 6732, which aligns with the lower end of last Tuesday’s upper distribution, is a key level for buyers to reclaim in order to attack the unfinished business at the all-time highs. While sellers’ first order of business is acceptance back within today’s value, achieving acceptance within Friday’s value area is what they really need to shift the tone—something they have struggled with thus far.
In terms of levels, the Smashlevel is 6732—the spike base. Holding below 6732 targets a cleanup of poor structure toward 6714 (DT1), with a final downside target (FDT) at 6687 under sustained selling pressure.
On the flip side, reclaiming and holding above 6732 would target the resistance area between the ATH at 6757 and 6767 (UT1), with a final upside target (FUT) at 6767 under sustained buying pressure.
Levels of Interest
Going into tomorrow’s session, I’ll closely observe the behavior around 6732.
Break and hold above 6732 would target 6757 / 6767 / 6784
Holding below 6732 would target 6714 / 6687
Additionally, pay attention to the following VIX levels: 17.14 and 15.42. These levels can provide confirmation of strength or weakness.
Break and hold above 6784 with VIX below 15.42 would confirm strength.
Break and hold below 6687 with VIX above 17.14 would confirm weakness.
Overall, it's important to exercise caution when trading outside of the highlighted yellow levels. A non-cooperative VIX may suggest possible reversals i.e trade setups.
What a day
Thank you so much Smash.