
ES Daily Plan | November 4, 2025
Market Context & Key Levels for the Day Ahead

— For new subscribers
The yellow levels highlighted at the bottom left of the chart are the primary intraday levels I focus on. To avoid impulsive decisions at poor trade locations, I follow a simple but effective rule: exercise caution when initiating trades outside of these yellow levels.
This means I’m cautious about chasing longs above the Final Upside Target (FUT) and shorts below the Final Downside Target (FDT). It’s important to understand that not chasing does not imply initiating a trade in the opposite direction — discipline over impulse.
Be sure to review the Weekly Plan for a broader perspective, key levels, and market expectations for the week ahead.

Contextual Analysis & Plan
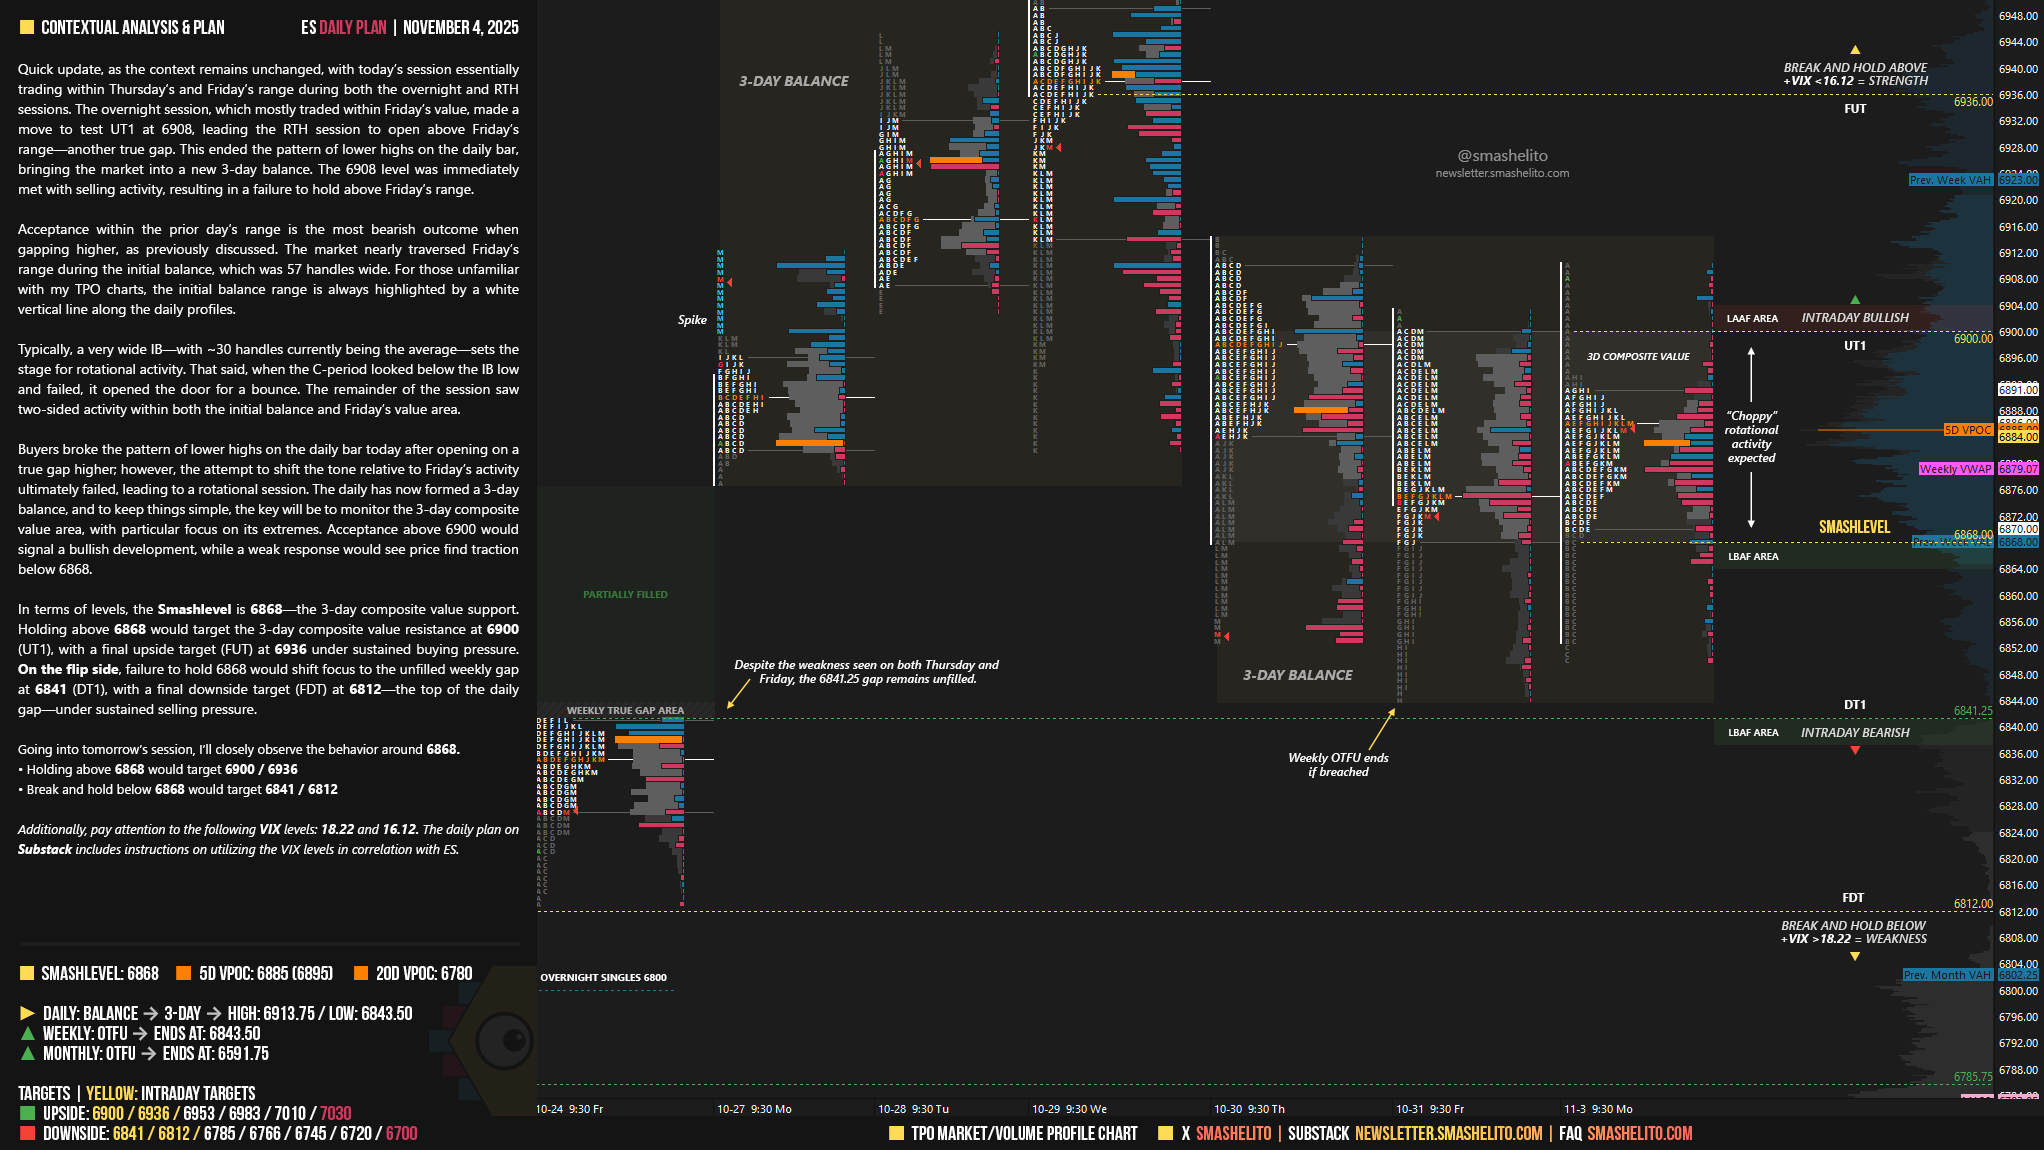
Quick update, as the context remains unchanged, with today’s session essentially trading within Thursday’s and Friday’s range during both the overnight and RTH sessions. The overnight session, which mostly traded within Friday’s value, made a move to test UT1 at 6908, leading the RTH session to open above Friday’s range—another true gap. This ended the pattern of lower highs on the daily bar, bringing the market into a new 3-day balance. The 6908 level was immediately met with selling activity, resulting in a failure to hold above Friday’s range.
Acceptance within the prior day’s range is the most bearish outcome when gapping higher, as previously discussed. The market nearly traversed Friday’s range during the initial balance, which was 57 handles wide. For those unfamiliar with my TPO charts, the initial balance range is always highlighted by a white vertical line along the daily profiles.
Typically, a very wide IB—with ~30 handles currently being the average—sets the stage for rotational activity. That said, when the C-period looked below the IB low and failed, it opened the door for a bounce. The remainder of the session saw two-sided activity within both the initial balance and Friday’s value area.
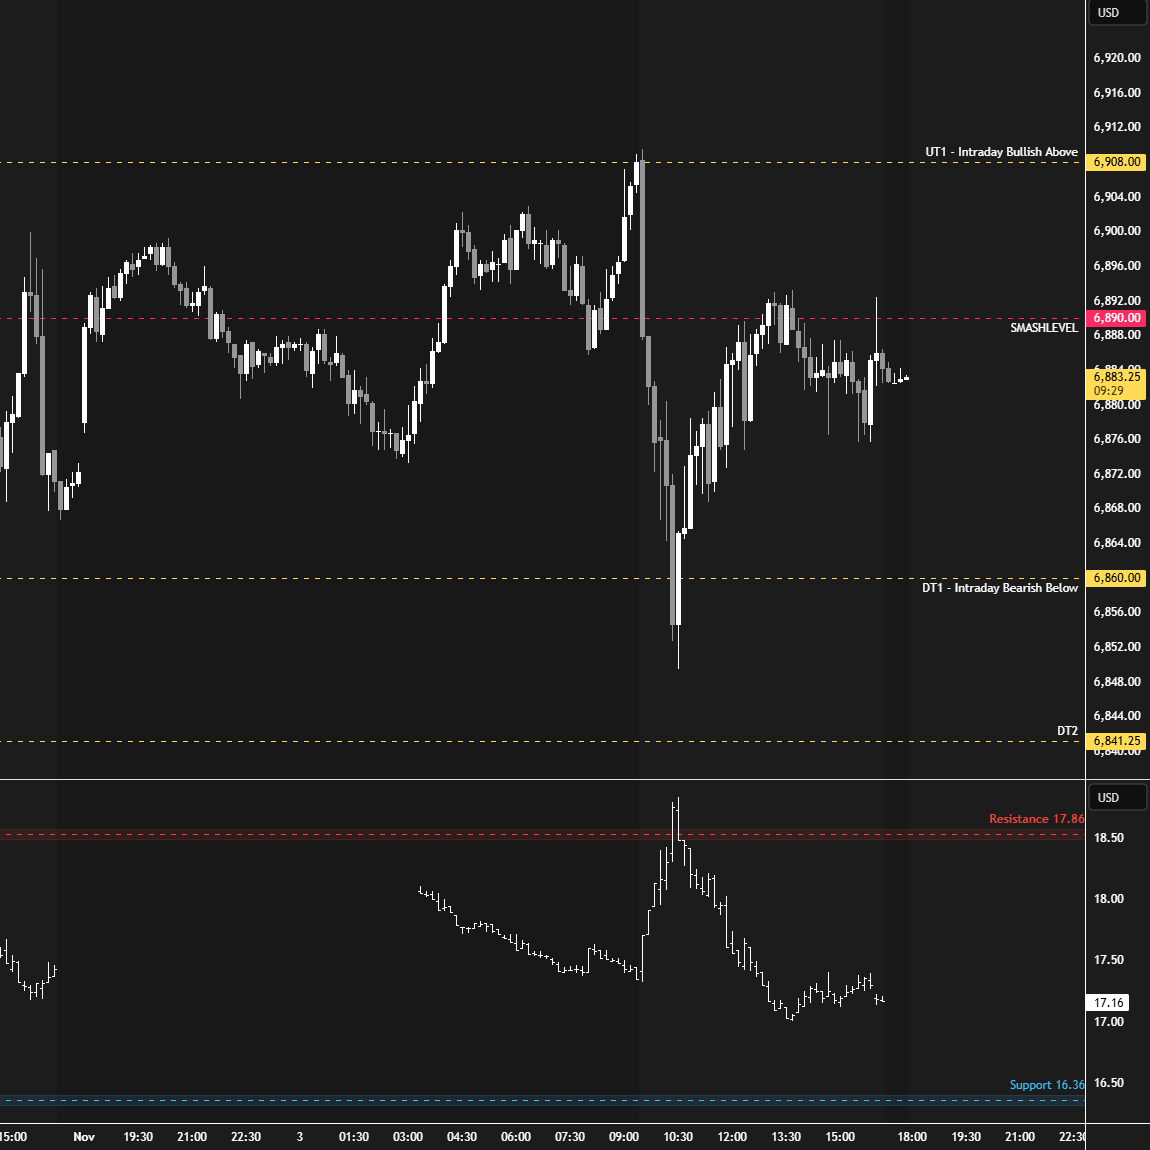
Buyers broke the pattern of lower highs on the daily bar today after opening on a true gap higher; however, the attempt to shift the tone relative to Friday’s activity ultimately failed, leading to a rotational session. The daily has now formed a 3-day balance, and to keep things simple, the key will be to monitor the 3-day composite value area, with particular focus on its extremes. Acceptance above 6900 would signal a bullish development, while a weak response would see price find traction below 6868.
In terms of levels, the Smashlevel is 6868—the 3-day composite value support. Holding above 6868 would target the 3-day composite value resistance at 6900 (UT1), with a final upside target (FUT) at 6936 under sustained buying pressure.
On the flip side, failure to hold 6868 would shift focus to the unfilled weekly gap at 6841 (DT1), with a final downside target (FDT) at 6812—the top of the daily gap—under sustained selling pressure.
Levels of Interest
Going into tomorrow’s session, I’ll closely observe the behavior around 6868.
Holding above 6868 would target 6900 / 6936
Break and hold below 6868 would target 6841 / 6812
Additionally, pay attention to the following VIX levels: 18.22 and 16.12. These levels can provide confirmation of strength or weakness.
Break and hold above 6936 with VIX below 16.12 would confirm strength.
Break and hold below 6812 with VIX above 18.22 would confirm weakness.
Overall, it's important to exercise caution when trading outside of the highlighted yellow levels. A non-cooperative VIX may suggest possible reversals i.e trade setups.
Thank you Smash! LAAF at 6908 was clean.
Literally the goat 🐐