
ES Daily Plan | November 25, 2025
Market Context & Key Levels for the Day Ahead

— For new subscribers
The yellow levels highlighted at the bottom left of the chart are the primary intraday levels I focus on. To avoid impulsive decisions at poor trade locations, I follow a simple but effective rule: exercise caution when initiating trades outside of these yellow levels.
This means I’m cautious about chasing longs above the Final Upside Target (FUT) and shorts below the Final Downside Target (FDT). It’s important to understand that not chasing does not imply initiating a trade in the opposite direction — discipline over impulse.
Be sure to review the Weekly Plan for a broader perspective, key levels, and market expectations for the week ahead.

Contextual Analysis & Plan
Trading activity during the overnight session remained contained within Friday’s upper distribution—not necessarily a straightforward bullish signal, but a constructive response given the absence of a weak reaction, which would have involved returning into Friday’s lower distribution. A great reversal unfolded during the European session from UT1 at 6670 after sweeping the opening high. Aggressive buyers were absorbed by passive sellers, followed by strong seller aggression stepping in—a textbook order flow reversal (see Figure 1). This resulted in a break of the Smashlevel at 6644, which was then reclaimed heading into the RTH session.
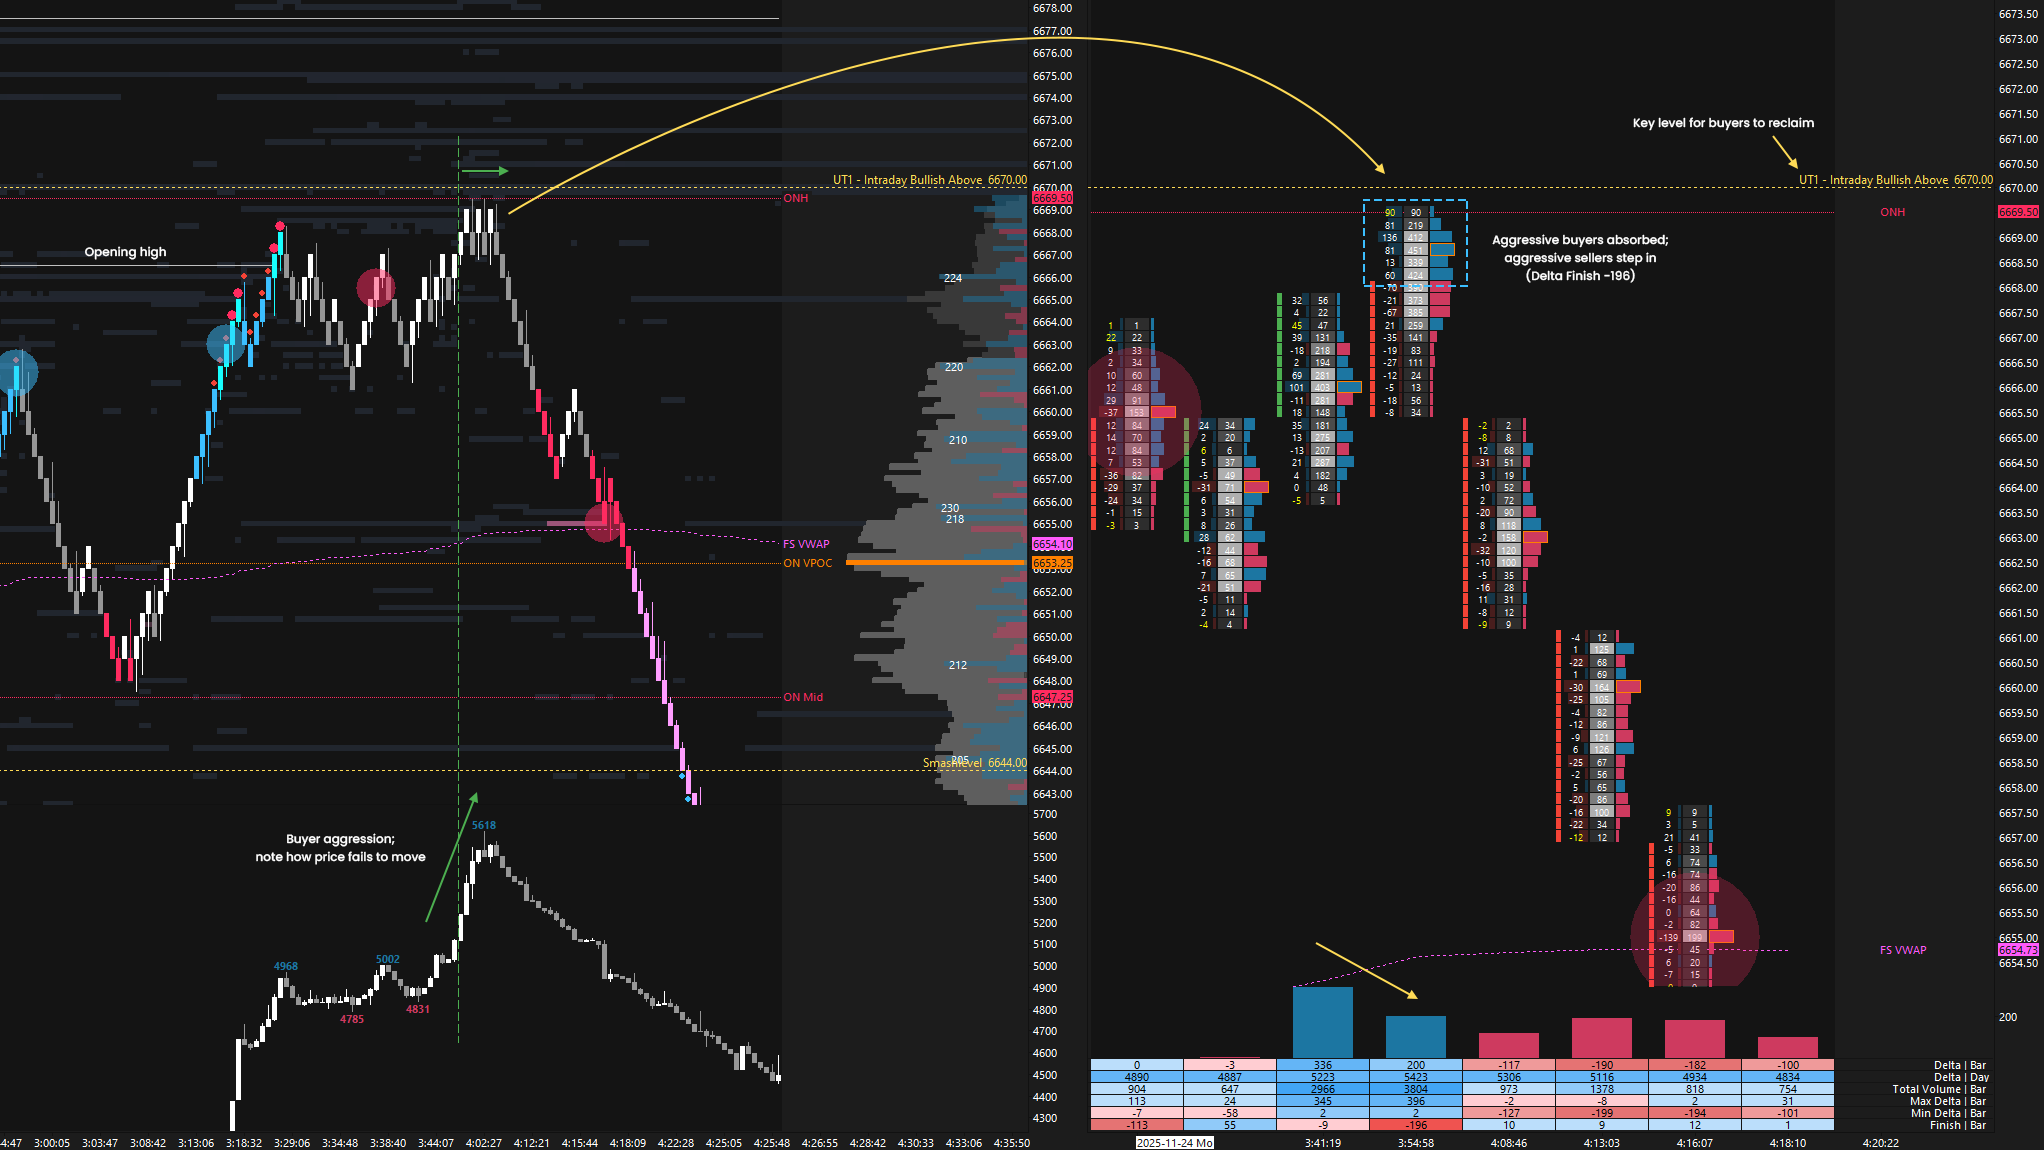
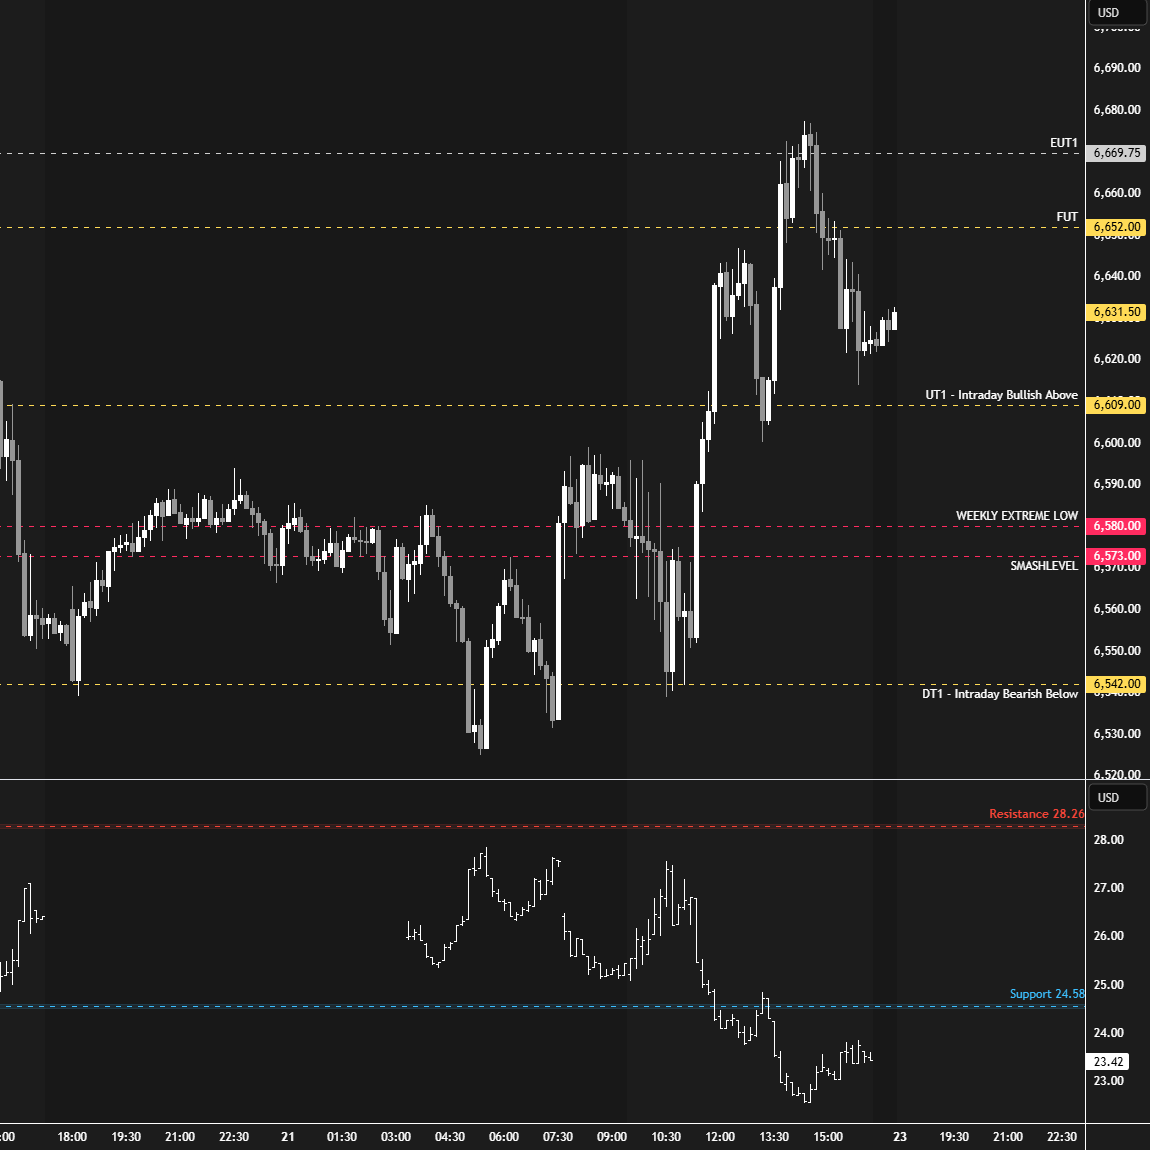
The opening sequence in the RTH session was interesting, as an immediate push higher broke through the 6670 level. The upside momentum stalled around 6685, with VIX testing its support level at 21.72 (21.70), after which a quick reversal unfolded. Always pay attention to how the market behaves when VIX approaches its support or resistance levels—they often provide excellent trade opportunities, as regular readers of this newsletter know. The A-period came within a few handles of testing the Smashlevel at 6644, with 6646.75 marking the low of the session. Buyers took control of the auction in the B-period after reclaiming, and then consolidating above, the 6670 level.
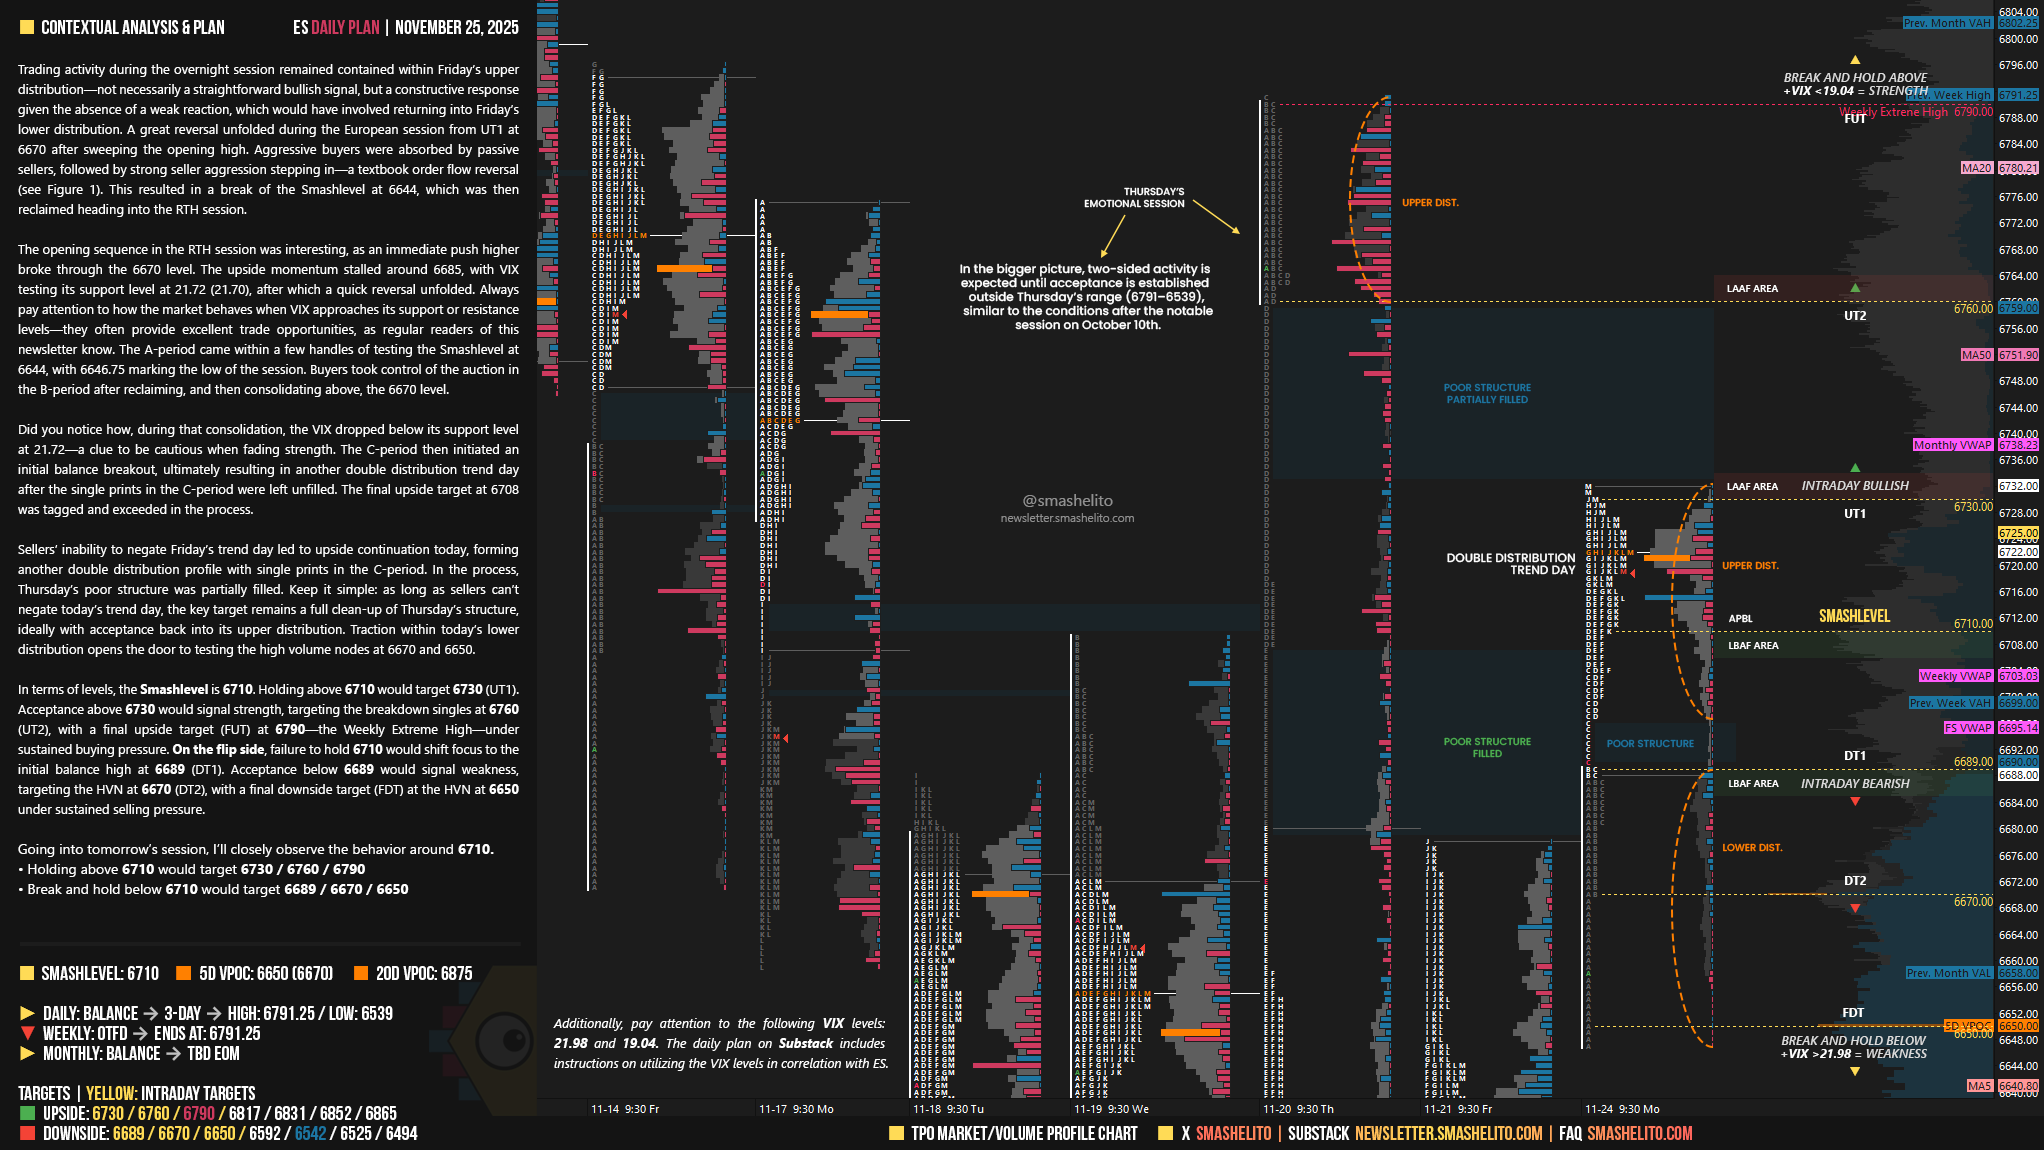
Did you notice how, during that consolidation, the VIX dropped below its support level at 21.72—a clue to be cautious when fading strength. The C-period then initiated an initial balance breakout, ultimately resulting in another double distribution trend day after the single prints in the C-period were left unfilled. The final upside target at 6708 was tagged and exceeded in the process.
Sellers’ inability to negate Friday’s trend day led to upside continuation today, forming another double distribution profile with single prints in the C-period. In the process, Thursday’s poor structure was partially filled. Keep it simple: as long as sellers can’t negate today’s trend day, the key target remains a full clean-up of Thursday’s structure, ideally with acceptance back into its upper distribution. Traction within today’s lower distribution opens the door to testing the high volume nodes at 6670 and 6650.
In terms of levels, the Smashlevel is 6710. Holding above 6710 would target 6730 (UT1). Acceptance above 6730 would signal strength, targeting the breakdown singles at 6760 (UT2), with a final upside target (FUT) at 6790—the Weekly Extreme High—under sustained buying pressure.
On the flip side, failure to hold 6710 would shift focus to the initial balance high at 6689 (DT1). Acceptance below 6689 would signal weakness, targeting the HVN at 6670 (DT2), with a final downside target (FDT) at the HVN at 6650 under sustained selling pressure.
Levels of Interest
Going into tomorrow’s session, I’ll closely observe the behavior around 6710.
Holding above 6710 would target 6730 / 6760 / 6790
Break and hold below 6710 would target 6689 / 6670 / 6650
Additionally, pay attention to the following VIX levels: 21.98 and 19.04. These levels can provide confirmation of strength or weakness.
Break and hold above 6790 with VIX below 19.04 would confirm strength.
Break and hold below 6650 with VIX above 21.98 would confirm weakness.
Overall, it's important to exercise caution when trading outside of the highlighted yellow levels. A non-cooperative VIX may suggest possible reversals i.e trade setups.
Thank you as always!
There's been quite interesting price action in high beta tech stocks today.