
ES Daily Plan | November 20, 2025
Market Context & Key Levels for the Day Ahead

— For new subscribers
The yellow levels highlighted at the bottom left of the chart are the primary intraday levels I focus on. To avoid impulsive decisions at poor trade locations, I follow a simple but effective rule: exercise caution when initiating trades outside of these yellow levels.
This means I’m cautious about chasing longs above the Final Upside Target (FUT) and shorts below the Final Downside Target (FDT). It’s important to understand that not chasing does not imply initiating a trade in the opposite direction — discipline over impulse.
Be sure to review the Weekly Plan for a broader perspective, key levels, and market expectations for the week ahead.

Contextual Analysis & Plan
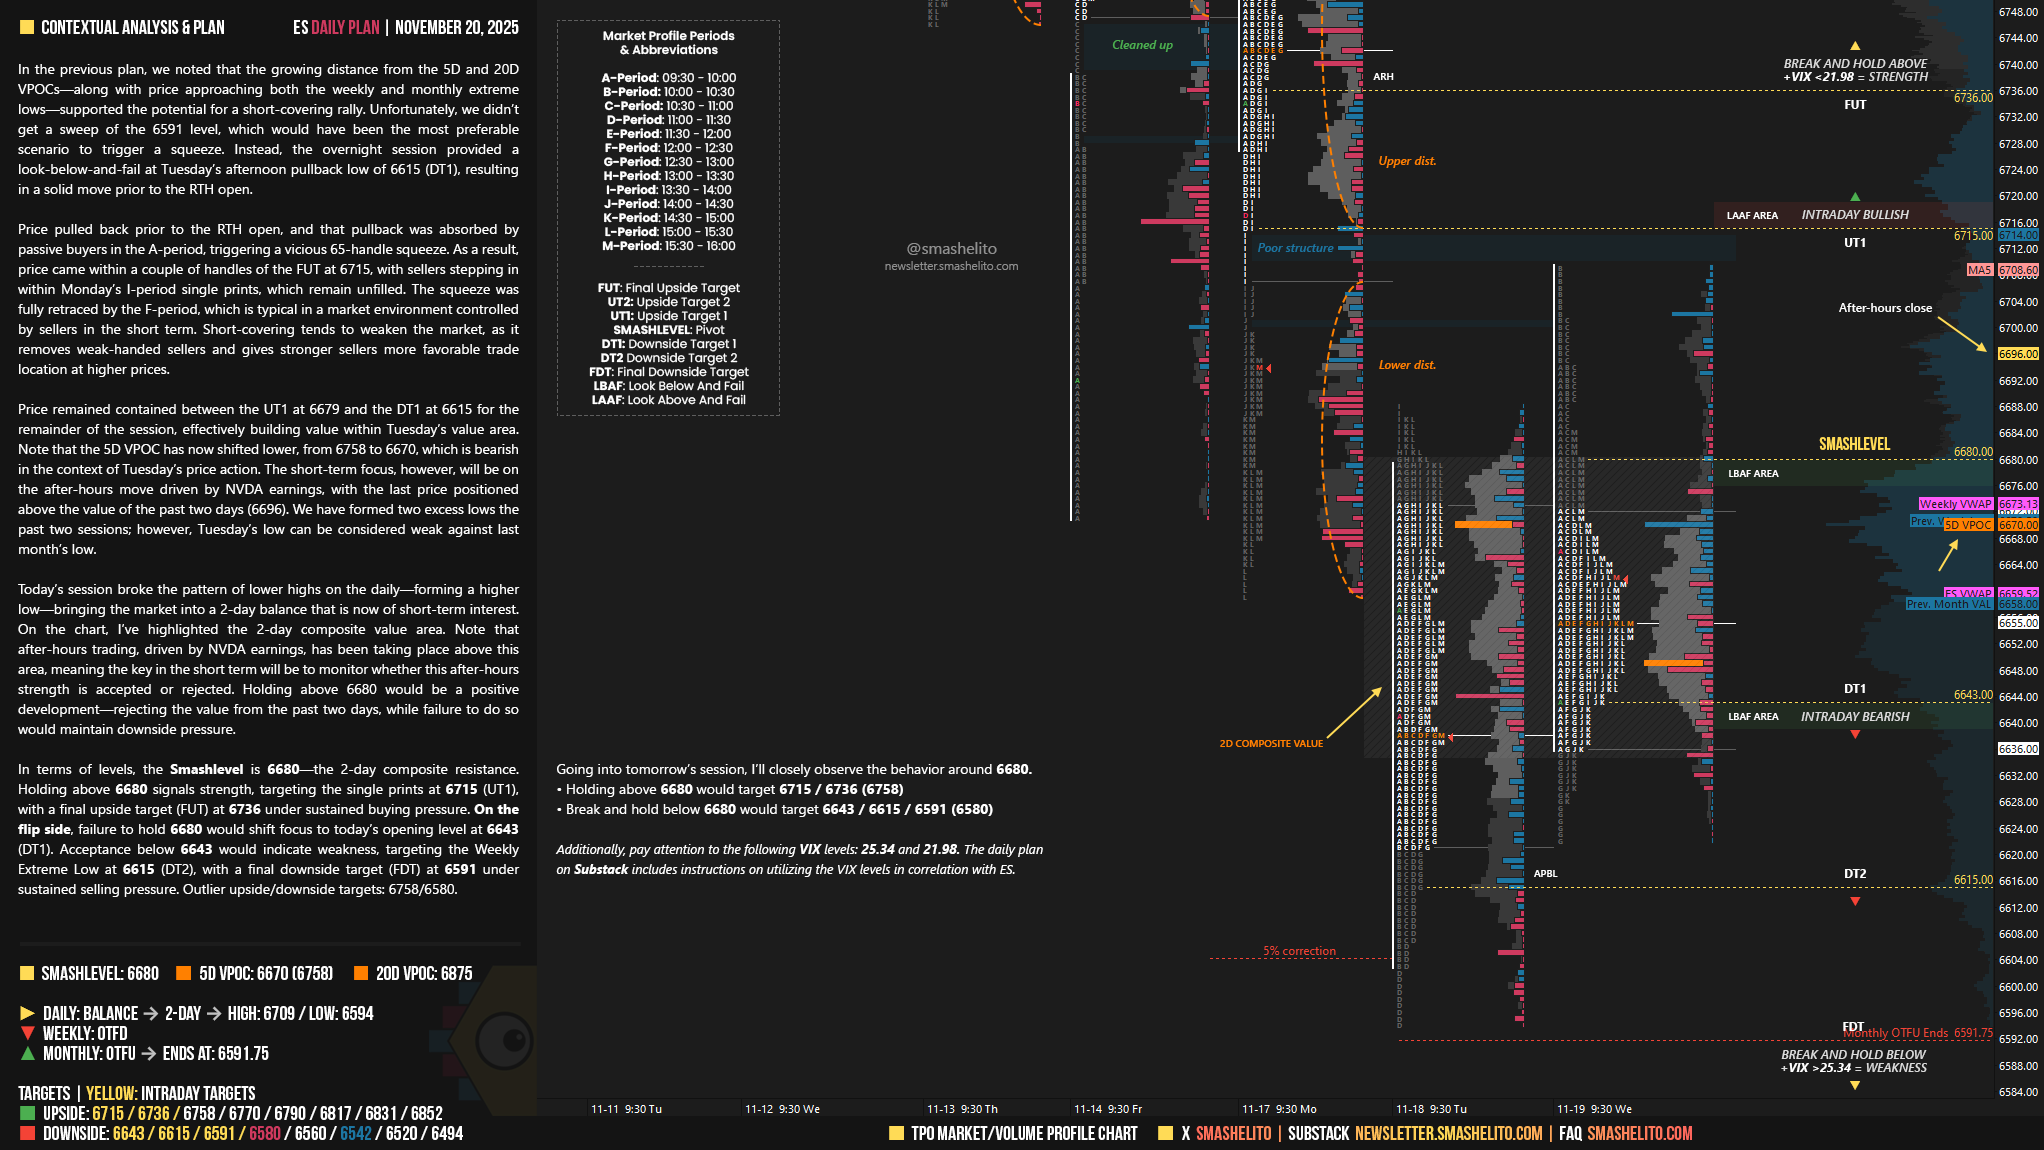
In the previous plan, we noted that the growing distance from the 5D and 20D VPOCs—along with price approaching both the weekly and monthly extreme lows—supported the potential for a short-covering rally. Unfortunately, we didn’t get a sweep of the 6591 level, which would have been the most preferable scenario to trigger a squeeze. Instead, the overnight session provided a look-below-and-fail at Tuesday’s afternoon pullback low of 6615 (DT1), resulting in a solid move prior to the RTH open.
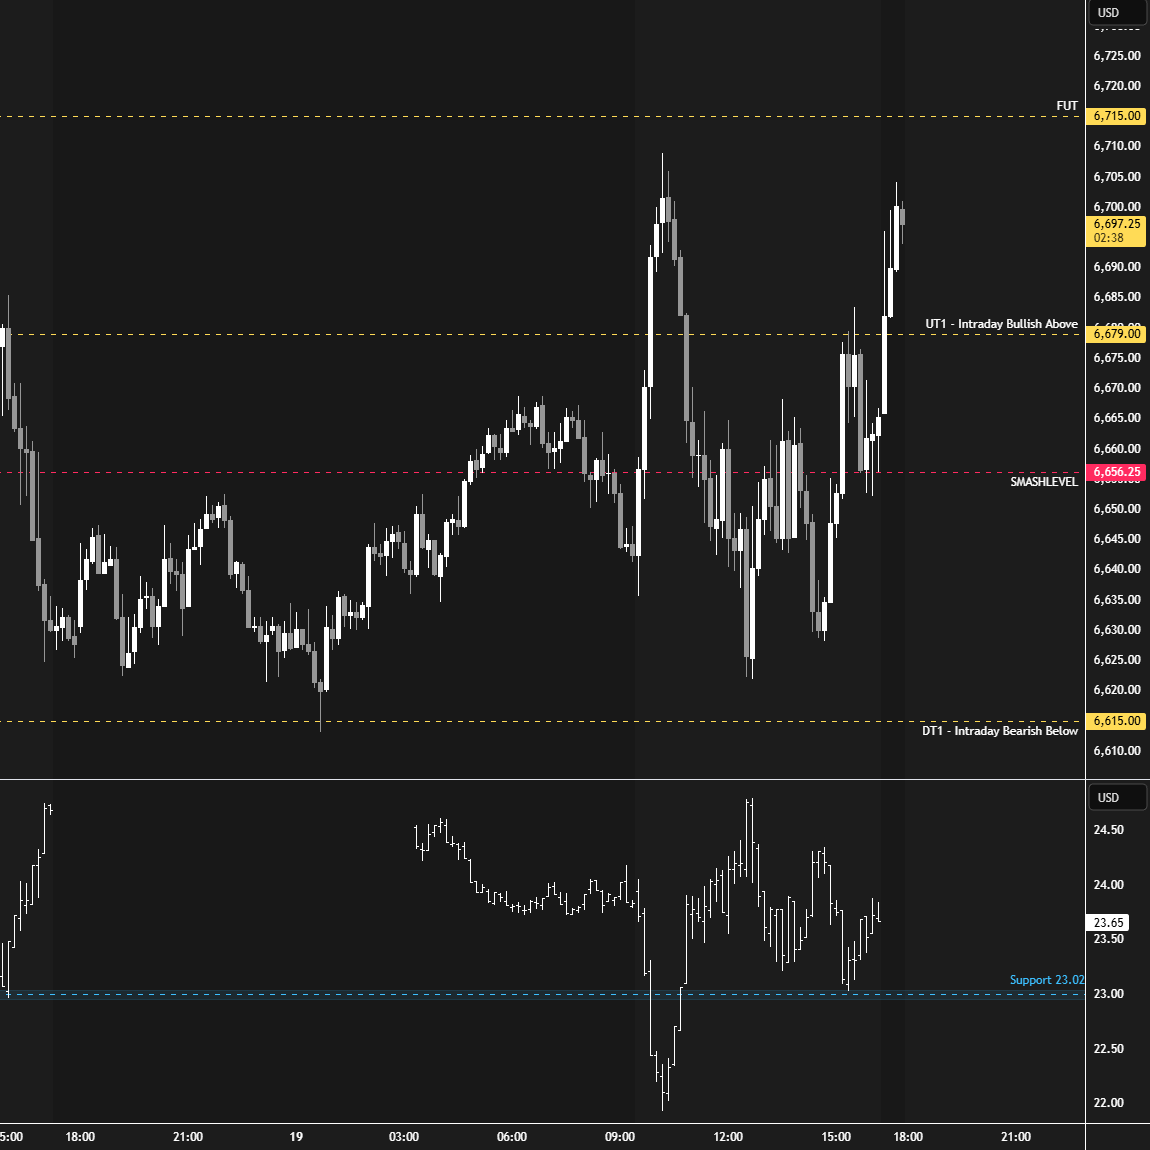
Price pulled back prior to the RTH open, and that pullback was absorbed by passive buyers in the A-period, triggering a vicious 65-handle squeeze. As a result, price came within a couple of handles of the FUT at 6715, with sellers stepping in within Monday’s I-period single prints, which remain unfilled. The squeeze was fully retraced by the F-period, which is typical in a market environment controlled by sellers in the short term. Short-covering tends to weaken the market, as it removes weak-handed sellers and gives stronger sellers more favorable trade location at higher prices.
Price remained contained between the UT1 at 6679 and the DT1 at 6615 for the remainder of the session, effectively building value within Tuesday’s value area. Note that the 5D VPOC has now shifted lower, from 6758 to 6670, which is bearish in the context of Tuesday’s price action. The short-term focus, however, will be on the after-hours move driven by NVDA earnings, with the last price positioned above the value of the past two days (6696). We have formed two excess lows the past two sessions; however, Tuesday’s low can be considered weak against last month’s low.
Today’s session broke the pattern of lower highs on the daily—forming a higher low—bringing the market into a 2-day balance that is now of short-term interest.
On the chart, I’ve highlighted the 2-day composite value area. Note that after-hours trading, driven by NVDA earnings, has been taking place above this area, meaning the key in the short term will be to monitor whether this after-hours strength is accepted or rejected.
Holding above 6680 would be a positive development—rejecting the value from the past two days, while failure to do so would maintain downside pressure.
In terms of levels, the Smashlevel is 6680—the 2-day composite resistance. Holding above 6680 signals strength, targeting the single prints at 6715 (UT1), with a final upside target (FUT) at 6736 under sustained buying pressure.
On the flip side, failure to hold 6680 would shift focus to today’s opening level at 6643 (DT1). Acceptance below 6643 would indicate weakness, targeting the Weekly Extreme Low at 6615 (DT2), with a final downside target (FDT) at 6591 under sustained selling pressure. Outlier upside/downside targets: 6758/6580.
Levels of Interest
Going into tomorrow’s session, I’ll closely observe the behavior around 6680.
Holding above 6680 would target 6715 / 6736 (6758)
Break and hold below 6680 would target 6643 / 6615 / 6591 (6580)
Additionally, pay attention to the following VIX levels: 25.34 and 21.98. These levels can provide confirmation of strength or weakness.
Break and hold above 6736 with VIX below 21.98 would confirm strength.
Break and hold below 6591 with VIX above 25.34 would confirm weakness.
Overall, it's important to exercise caution when trading outside of the highlighted yellow levels. A non-cooperative VIX may suggest possible reversals i.e trade setups.
Thank you!
Thanks Smash!