
ES Daily Plan | November 19, 2025
Market Context & Key Levels for the Day Ahead

— For new subscribers
The yellow levels highlighted at the bottom left of the chart are the primary intraday levels I focus on. To avoid impulsive decisions at poor trade locations, I follow a simple but effective rule: exercise caution when initiating trades outside of these yellow levels.
This means I’m cautious about chasing longs above the Final Upside Target (FUT) and shorts below the Final Downside Target (FDT). It’s important to understand that not chasing does not imply initiating a trade in the opposite direction — discipline over impulse.
Be sure to review the Weekly Plan for a broader perspective, key levels, and market expectations for the week ahead.

Contextual Analysis & Plan
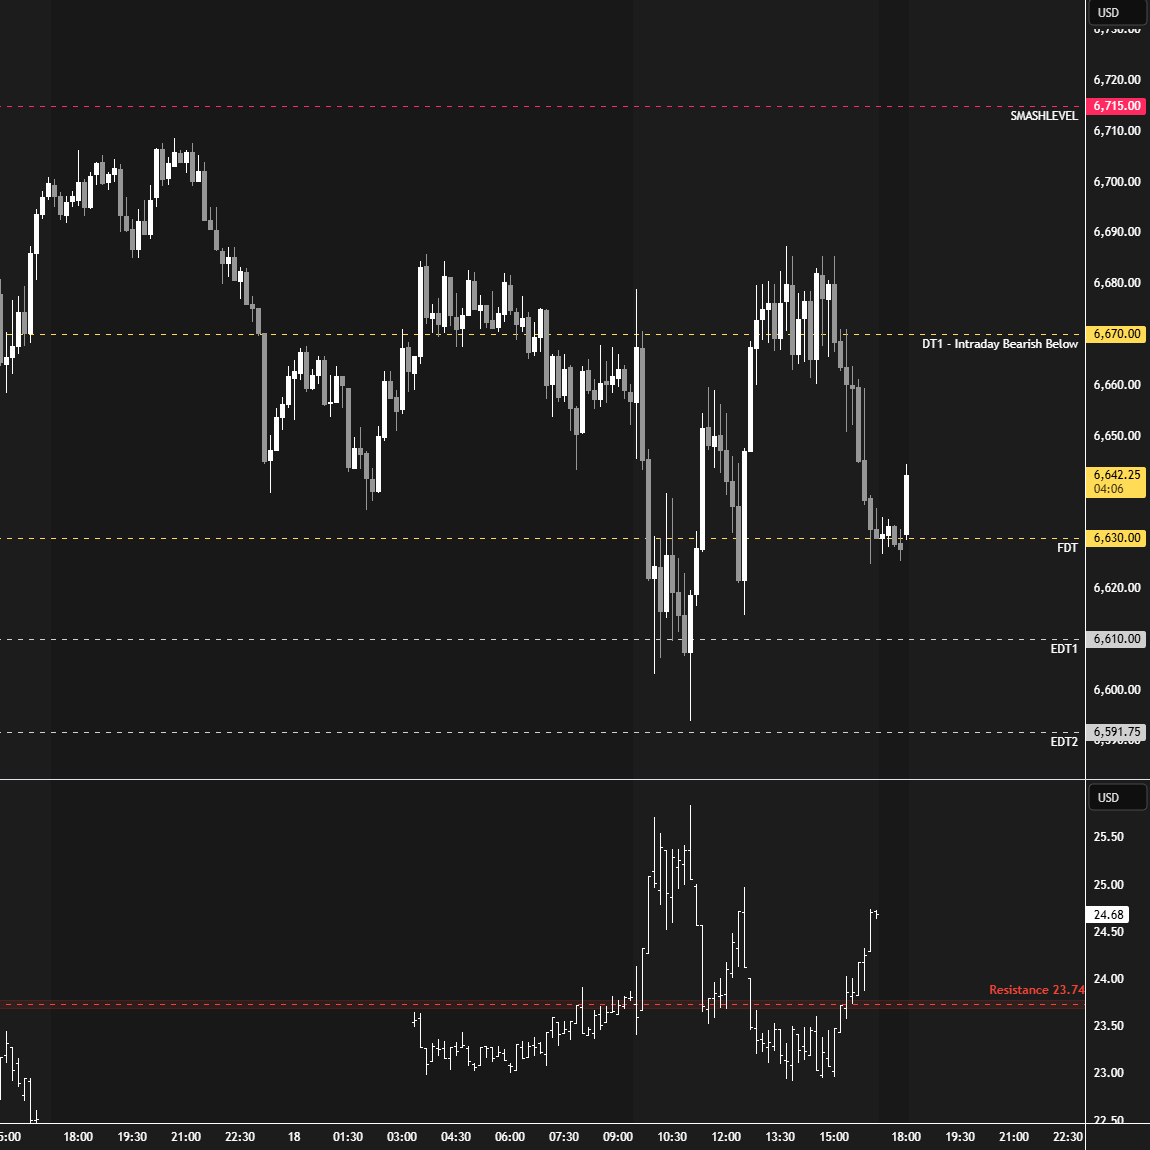
The short-term focus today was on Monday’s I-period single prints, which divided the double distribution trend day that kicked off the week. This area was tested early overnight and met with selling activity, triggering continued weakness and downside pressure. The market came within 5 handles of tagging the final downside target at 6630 (low: 6635.50) before Europe even opened, from which a reversal unfolded. This bounce was sold heading into the RTH session.
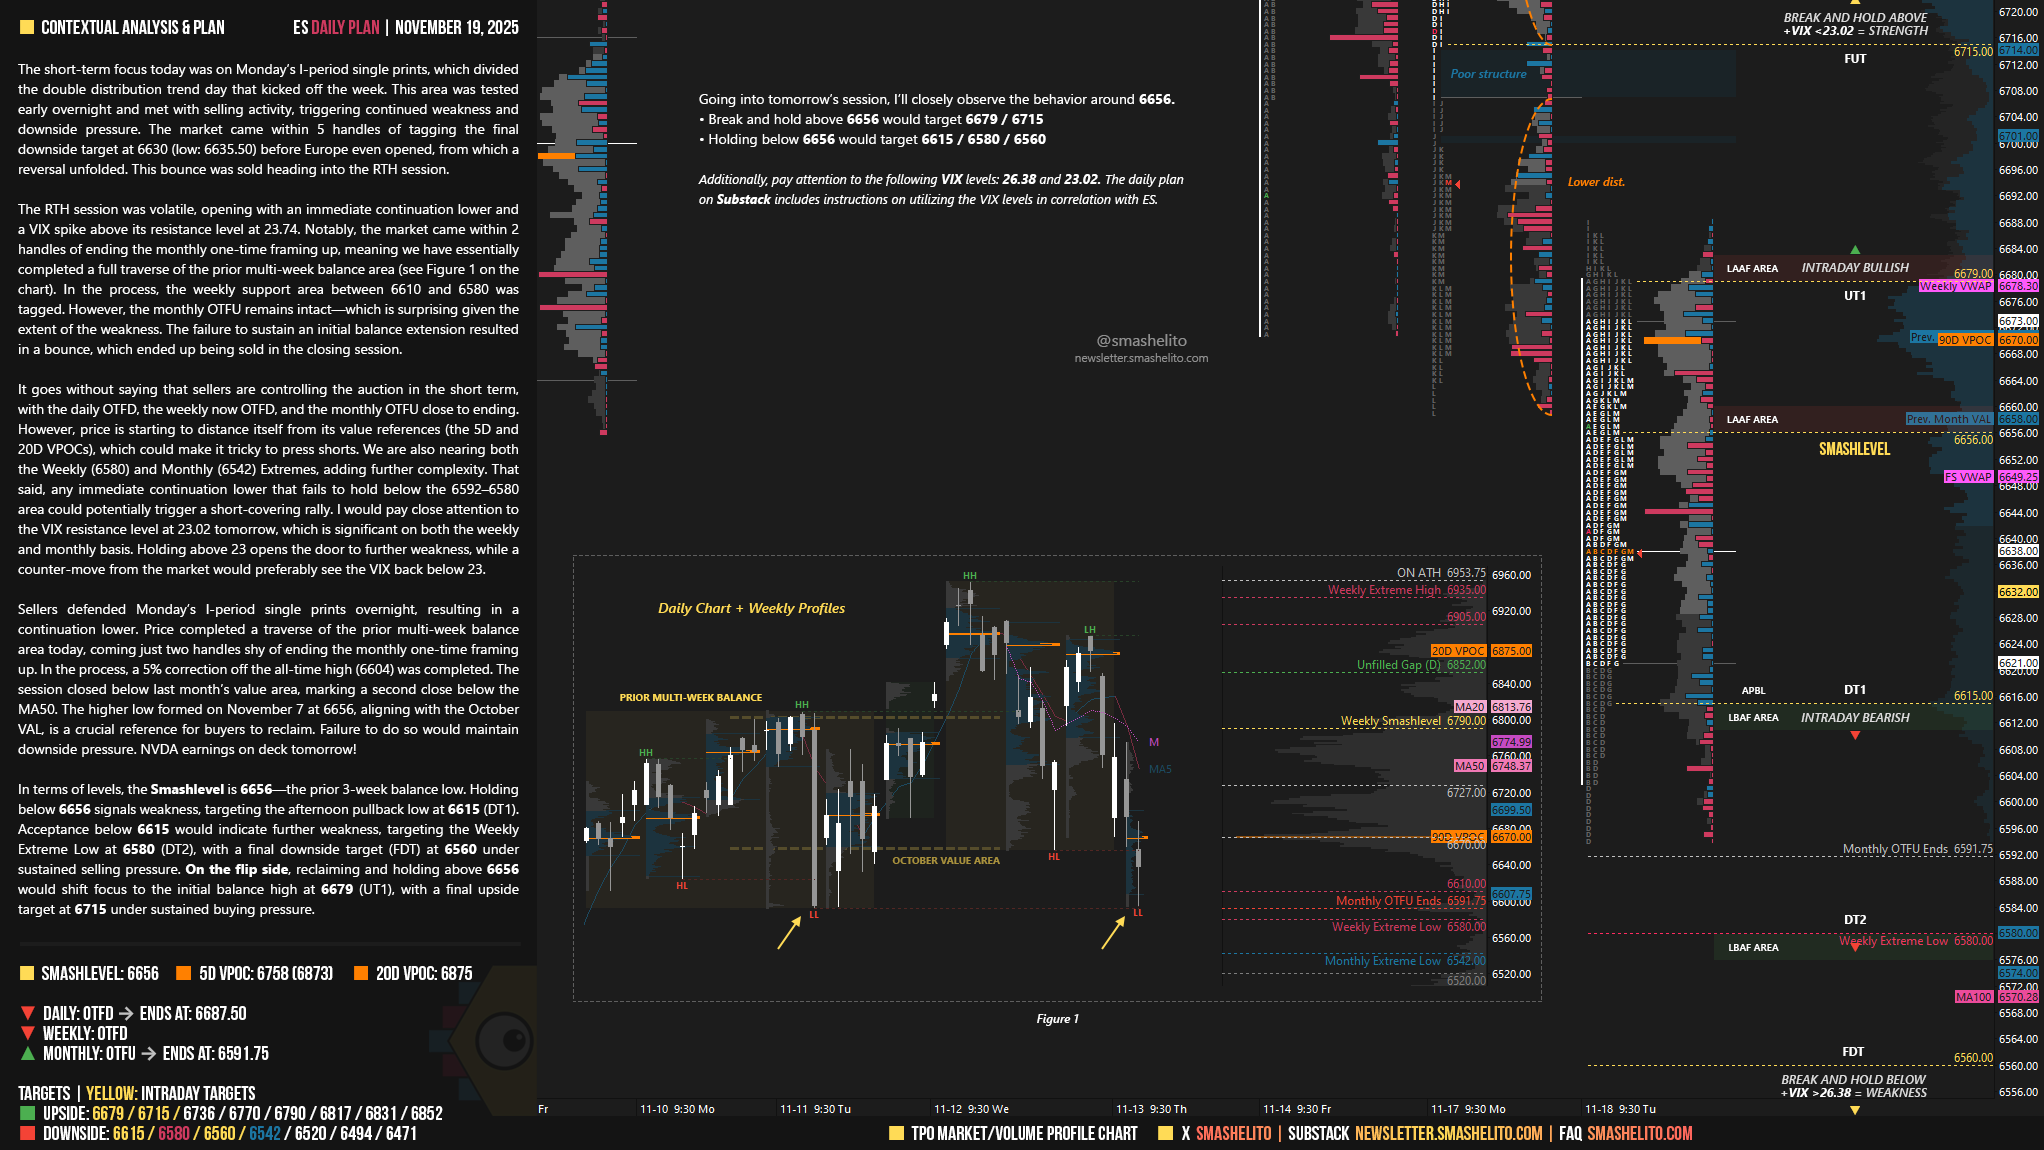
The RTH session was volatile, opening with an immediate continuation lower and a VIX spike above its resistance level at 23.74. Notably, the market came within 2 handles of ending the monthly one-time framing up, meaning we have essentially completed a full traverse of the prior multi-week balance area (see Figure 1 on the chart). In the process, the weekly support area between 6610 and 6580 was tagged. However, the monthly OTFU remains intact—which is surprising given the extent of the weakness. The failure to sustain an initial balance extension resulted in a bounce, which ended up being sold in the closing session.
It goes without saying that sellers are controlling the auction in the short term, with the daily OTFD, the weekly now OTFD, and the monthly OTFU close to ending. However, price is starting to distance itself from its value references (the 5D and 20D VPOCs), which could make it tricky to press shorts. We are also nearing both the Weekly (6580) and Monthly (6542) Extremes, adding further complexity.
That said, any immediate continuation lower that fails to hold below the 6592–6580 area could potentially trigger a short-covering rally. I would pay close attention to the VIX resistance level at 23.02 tomorrow, which is significant on both the weekly and monthly basis. Holding above 23 opens the door to further weakness, while a counter-move from the market would preferably see the VIX back below 23.
Sellers defended Monday’s I-period single prints overnight, resulting in a continuation lower. Price completed a traverse of the prior multi-week balance area today, coming just two handles shy of ending the monthly one-time framing up. In the process, a 5% correction off the all-time high (6604) was completed.
The session closed below last month’s value area, marking a second close below the MA50. The higher low formed on November 7 at 6656, aligning with the October VAL, is a crucial reference for buyers to reclaim. Failure to do so would maintain downside pressure. NVDA earnings on deck tomorrow!
In terms of levels, the Smashlevel is 6656—the prior 3-week balance low. Holding below 6656 signals weakness, targeting the afternoon pullback low at 6615 (DT1). Acceptance below 6615 would indicate further weakness, targeting the Weekly Extreme Low at 6580 (DT2), with a final downside target (FDT) at 6560 under sustained selling pressure.
On the flip side, reclaiming and holding above 6656 would shift focus to the initial balance high at 6679 (UT1), with a final upside target at 6715 under sustained buying pressure.
Levels of Interest
Going into tomorrow’s session, I’ll closely observe the behavior around 6656.
Break and hold above 6656 would target 6679 / 6715
Holding below 6656 would target 6615 / 6580 / 6560
Additionally, pay attention to the following VIX levels: 26.38 and 23.02. These levels can provide confirmation of strength or weakness.
Break and hold above 6715 with VIX below 23.02 would confirm strength.
Break and hold below 6560 with VIX above 26.38 would confirm weakness.
Overall, it's important to exercise caution when trading outside of the highlighted yellow levels. A non-cooperative VIX may suggest possible reversals i.e trade setups.
Thank you because there are so many things to consider, and you simplify it and remind me of things I forget. I appreciate your daily analysis. By the way, great chart with the daily details
Thank you Smash! 🐐