
ES Daily Plan | November 18, 2025
Market Context & Key Levels for the Day Ahead

— For new subscribers
The yellow levels highlighted at the bottom left of the chart are the primary intraday levels I focus on. To avoid impulsive decisions at poor trade locations, I follow a simple but effective rule: exercise caution when initiating trades outside of these yellow levels.
This means I’m cautious about chasing longs above the Final Upside Target (FUT) and shorts below the Final Downside Target (FDT). It’s important to understand that not chasing does not imply initiating a trade in the opposite direction — discipline over impulse.
Be sure to review the Weekly Plan for a broader perspective, key levels, and market expectations for the week ahead.

Contextual Analysis & Plan
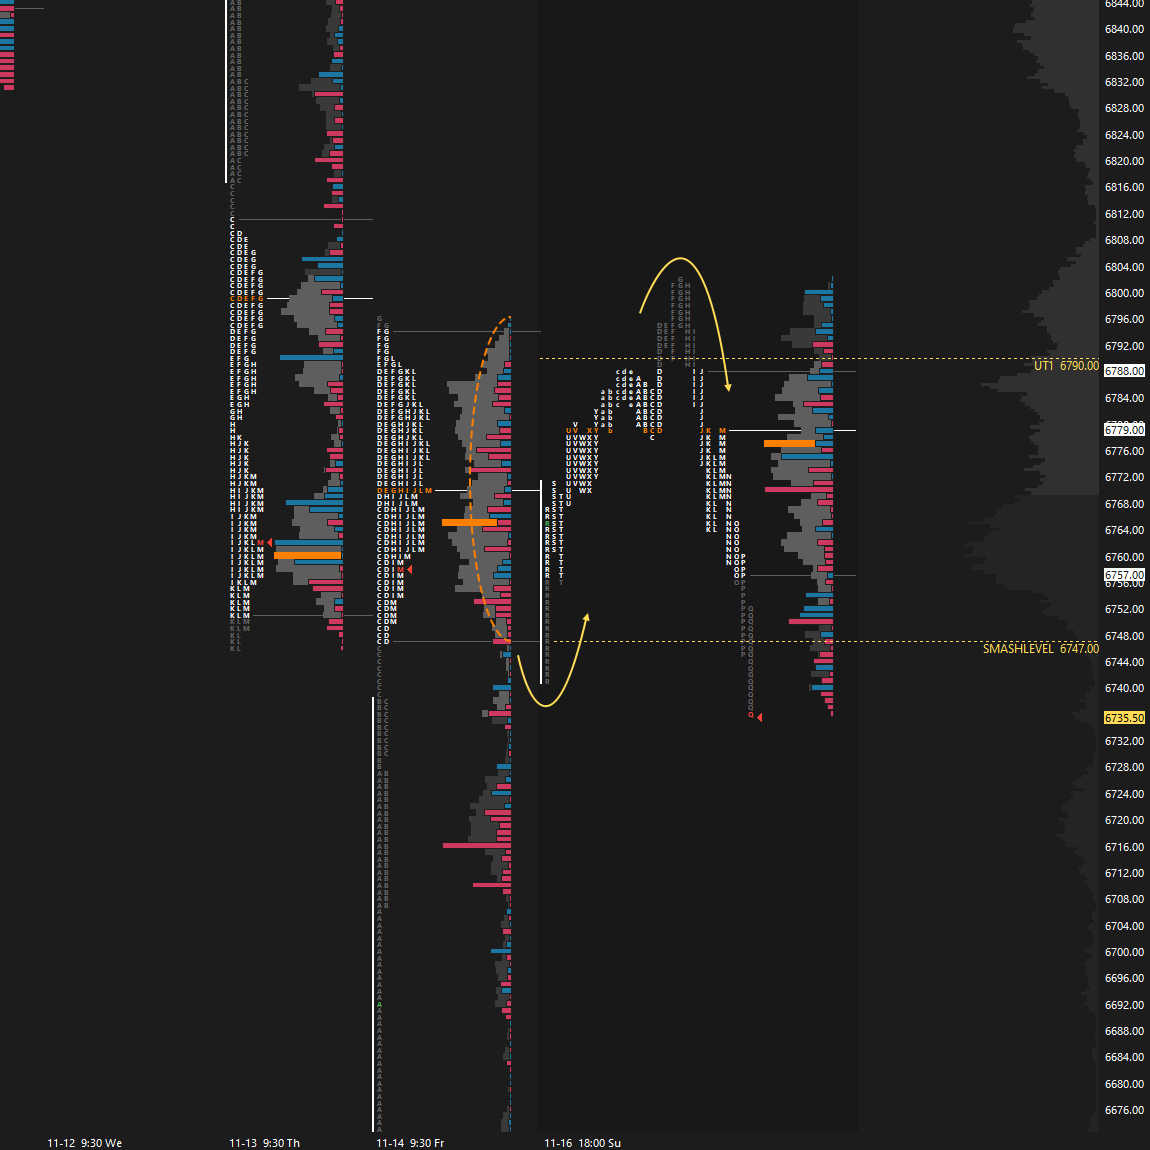
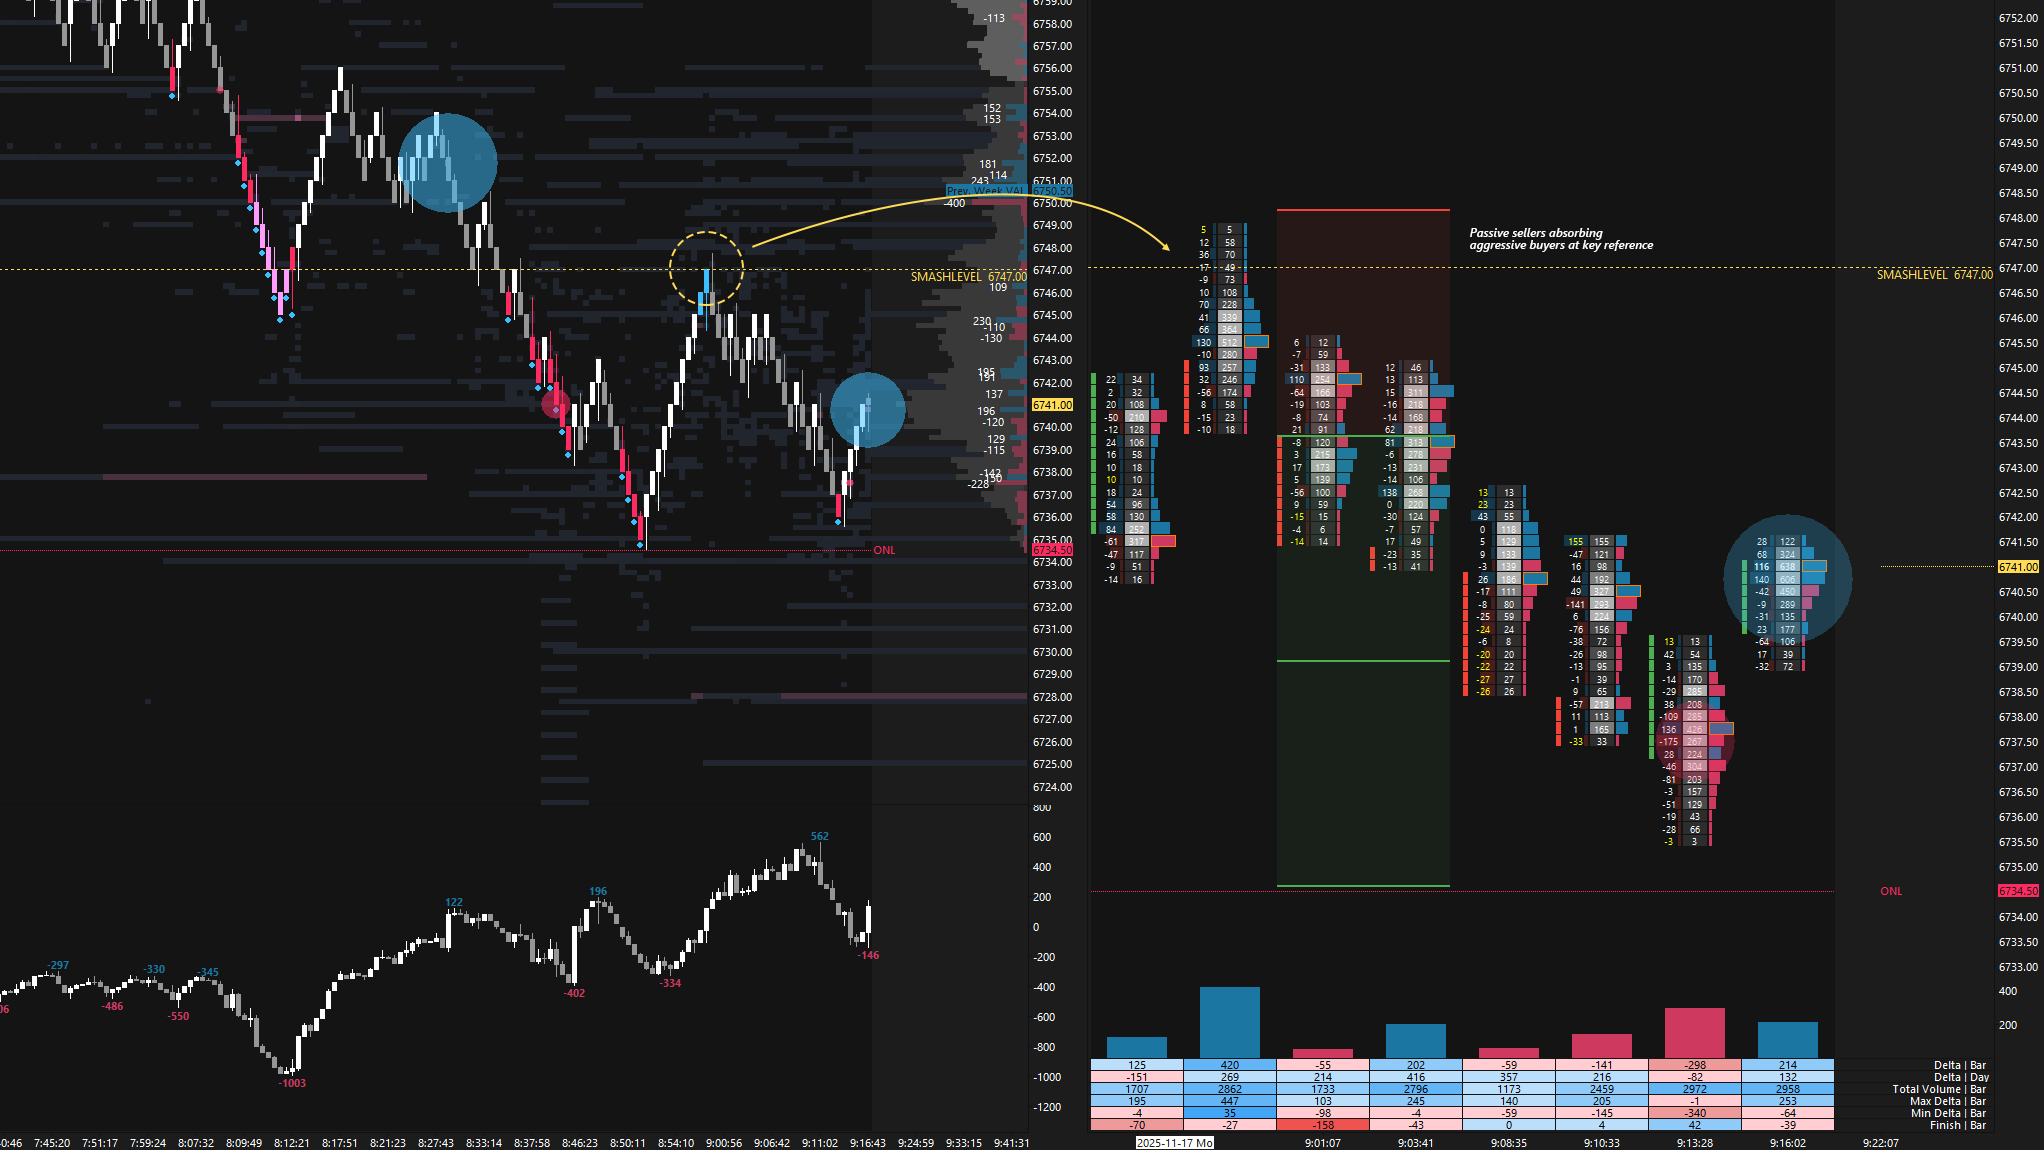
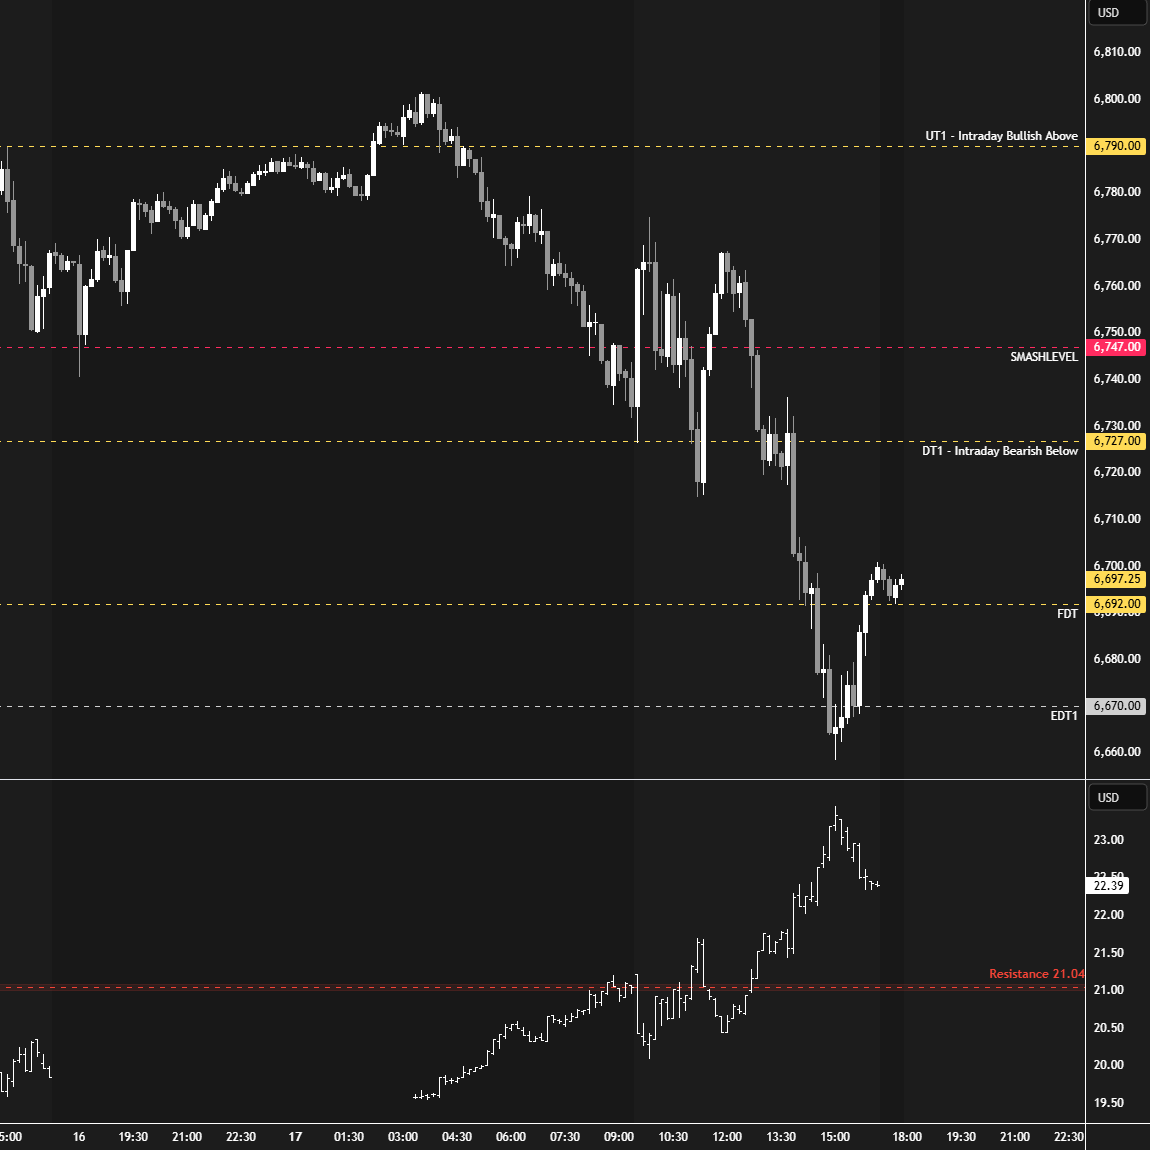
Friday’s main distribution was key heading into today’s session, and the overnight session offered great opportunities around it. A look-below-and-fail triggered a rotation higher, while a look-above-and-fail resulted in weakness (see Figure 1). Given the short-term trend in favor of sellers, it was not surprising that the look-above-and-fail was the more successful outcome. The Smashlevel at 6747 was breached and reoffered pre-open, offering another solid setup (see Figure 2).
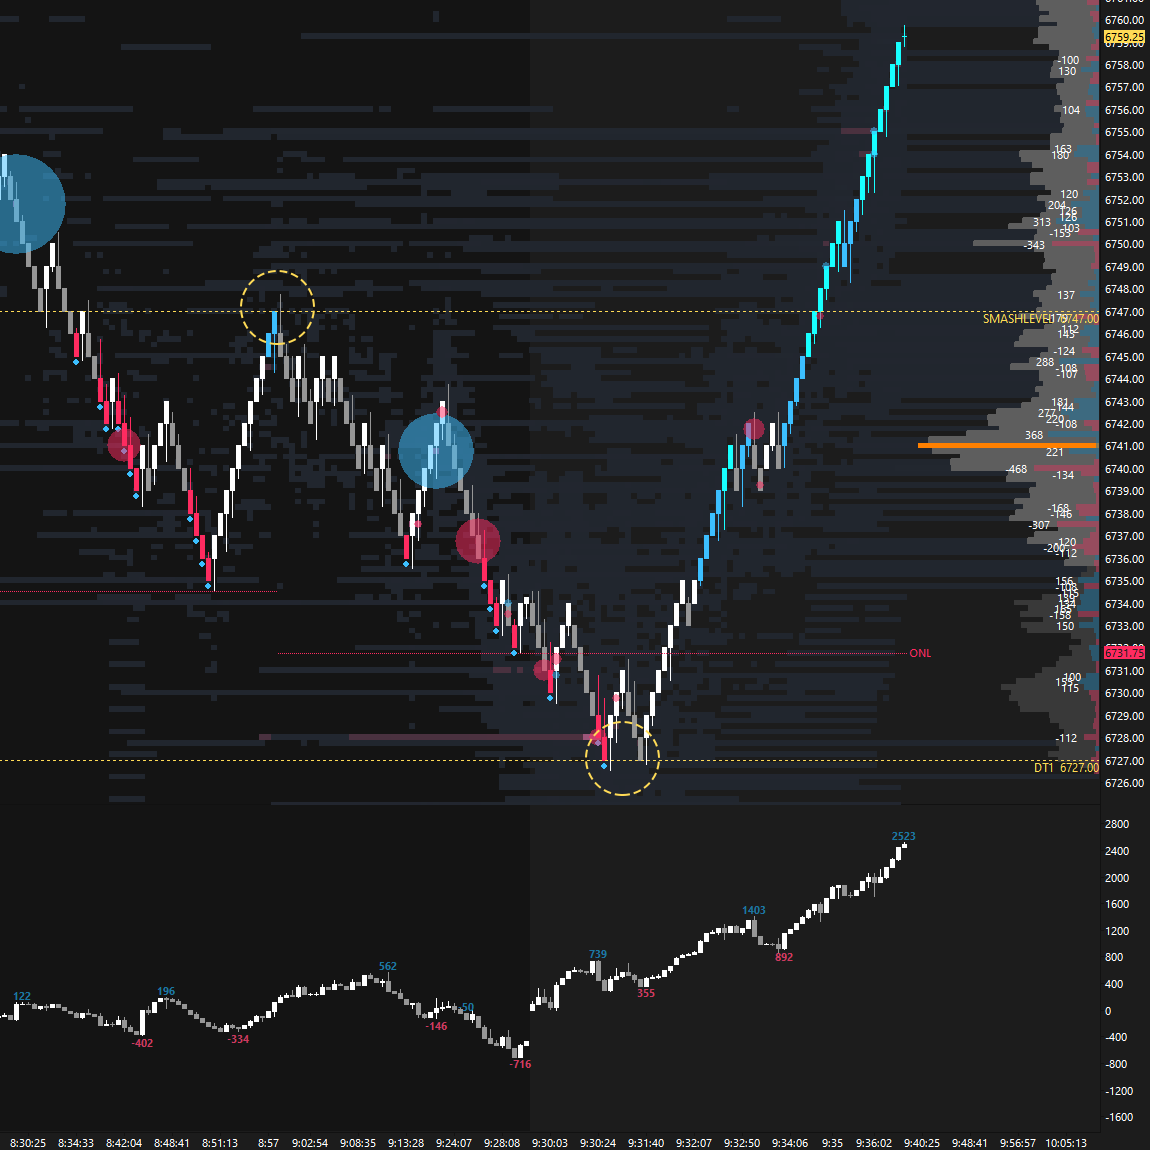
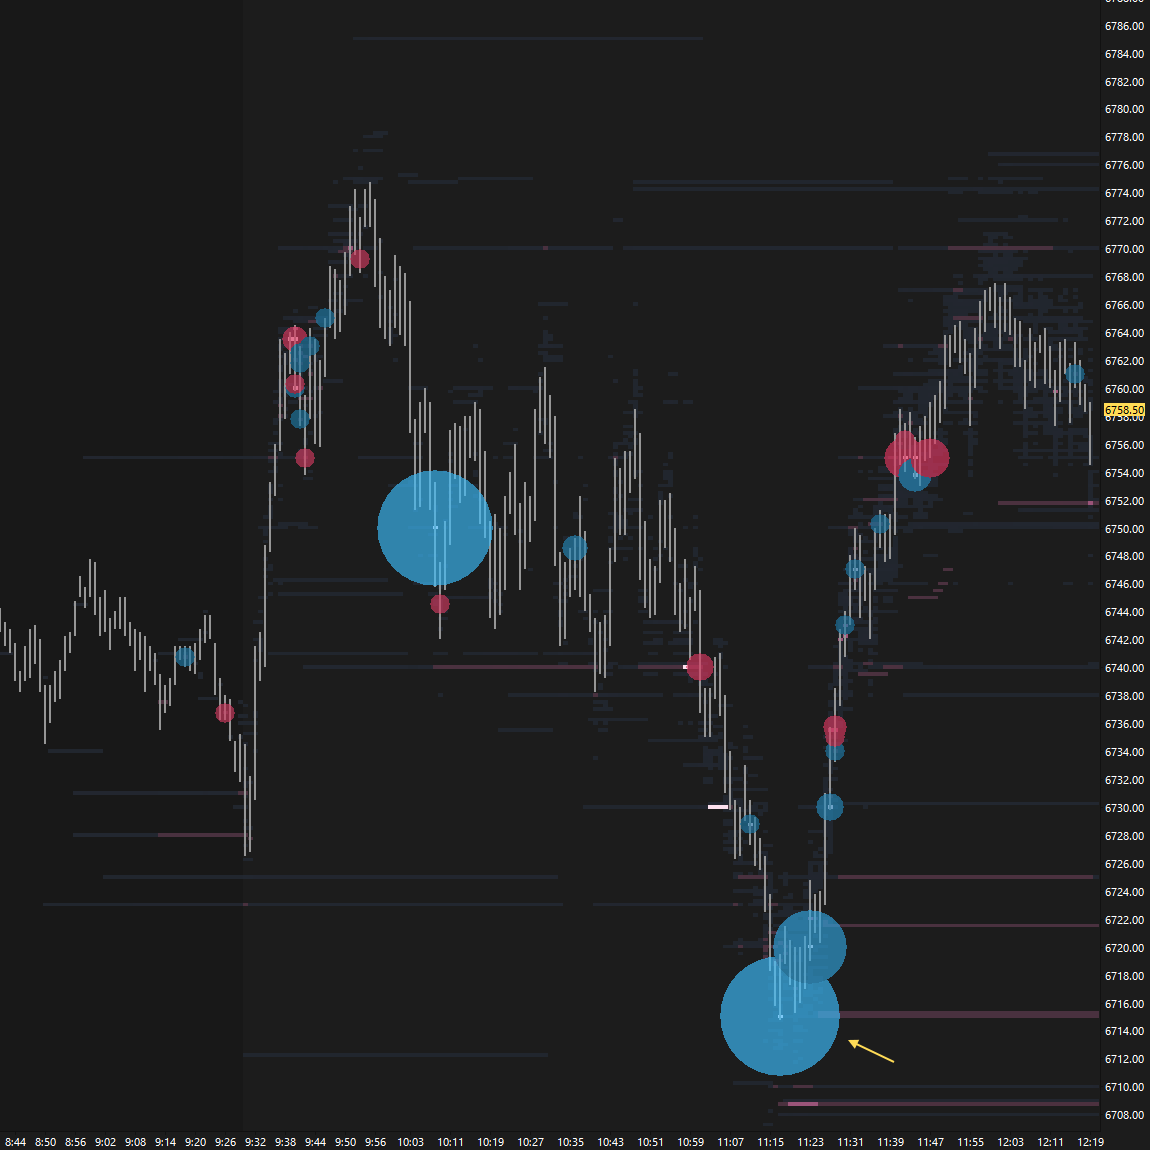
The RTH session opened within Friday’s lower distribution, immediately tagging the DT1 at 6727 and completing a level-to-level sequence from 6747 (see Figure 3). The failure to maintain within Friday’s lower distribution then triggered a vicious squeeze of nearly 50 handles. The key question was whether buyers could hold within Friday’s upper distribution—specifically, whether there was enough new buying interest following Friday’s short-covering rally, which may have weakened the market, as discussed. A second attempt lower in the D-period was rejected, triggering another squeeze after a large market buyer lifted the offer (see Figure 4). Similar to the first squeeze, no new buyers followed, leading to price rolling over. The VIX had been flirting with its resistance level at 21.04 since pre-open.
Two failed rallies ultimately provided enough fuel for a continuation lower in the I-period, forming a double distribution and tagging—then briefly exceeding—the FDT at 6692. During the closing session, price looked below last week’s low and failed, once again testing the HVN at 6670 before closing exactly at 6692. Keep in mind that 6655 is the weekly balance low, so we are at an inflection point. The session also closed below the MA50, likely drawing attention.
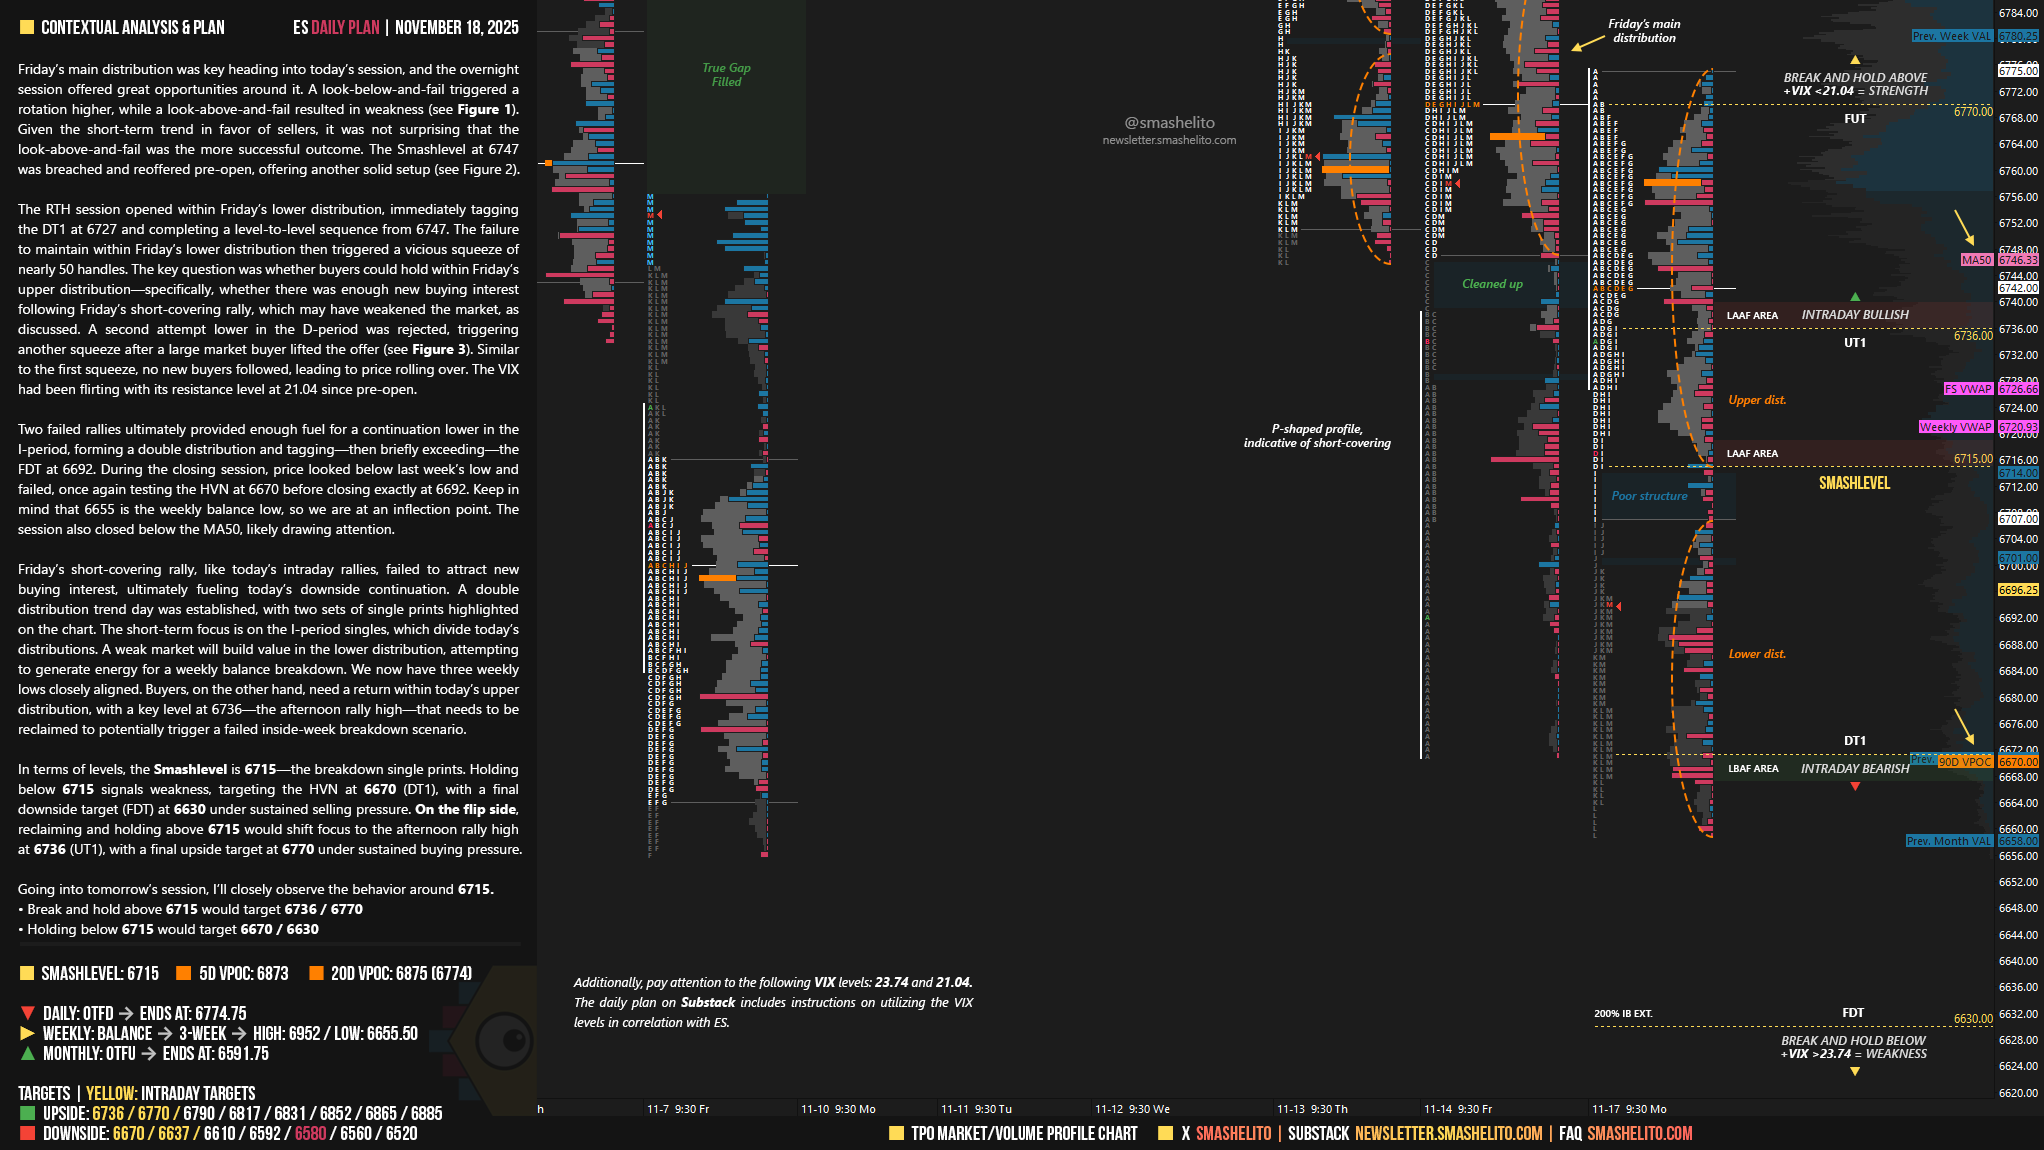
Friday’s short-covering rally, like today’s intraday rallies, failed to attract new buying interest, ultimately fueling today’s downside continuation. A double distribution trend day was established, with two sets of single prints highlighted on the chart.
The short-term focus is on the I-period singles, which divide today’s distributions. A weak market will build value in the lower distribution, attempting to generate energy for a weekly balance breakdown. We now have three weekly lows closely aligned.
Buyers, on the other hand, need a return within today’s upper distribution, with a key level at 6736—the afternoon rally high—that needs to be reclaimed to potentially trigger a failed inside-week breakdown scenario.
In terms of levels, the Smashlevel is 6715—the breakdown single prints. Holding below 6715 signals weakness, targeting the HVN at 6670 (DT1), with a final downside target (FDT) at 6630 under sustained selling pressure.
On the flip side, reclaiming and holding above 6715 would shift focus to the afternoon rally high at 6736 (UT1), with a final upside target at 6770 under sustained buying pressure.
Levels of Interest
Going into tomorrow’s session, I’ll closely observe the behavior around 6715.
Break and hold above 6715 would target 6736 / 6770
Holding below 6715 would target 6670 / 6630
Additionally, pay attention to the following VIX levels: 23.74 and 21.04. These levels can provide confirmation of strength or weakness.
Break and hold above 6770 with VIX below 21.04 would confirm strength.
Break and hold below 6630 with VIX above 23.74 would confirm weakness.
Overall, it's important to exercise caution when trading outside of the highlighted yellow levels. A non-cooperative VIX may suggest possible reversals i.e trade setups.
It's incredible how the VIX served as a map for me to know what to look for today. When it rose and made the LAAF, I thought, "I'll just look for buys," but then when it broke the resistance again, I knew that this second attempt indicated something bigger, which prevented me from joining any kind of buying. Thank you for what you do, you really are a great mentor
Thanks Smash! Fantastic stuff!