
ES Daily Plan | November 14, 2025
Market Context & Key Levels for the Day Ahead

— For new subscribers
The yellow levels highlighted at the bottom left of the chart are the primary intraday levels I focus on. To avoid impulsive decisions at poor trade locations, I follow a simple but effective rule: exercise caution when initiating trades outside of these yellow levels.
This means I’m cautious about chasing longs above the Final Upside Target (FUT) and shorts below the Final Downside Target (FDT). It’s important to understand that not chasing does not imply initiating a trade in the opposite direction — discipline over impulse.
Be sure to review the Weekly Plan for a broader perspective, key levels, and market expectations for the week ahead.

Contextual Analysis & Plan
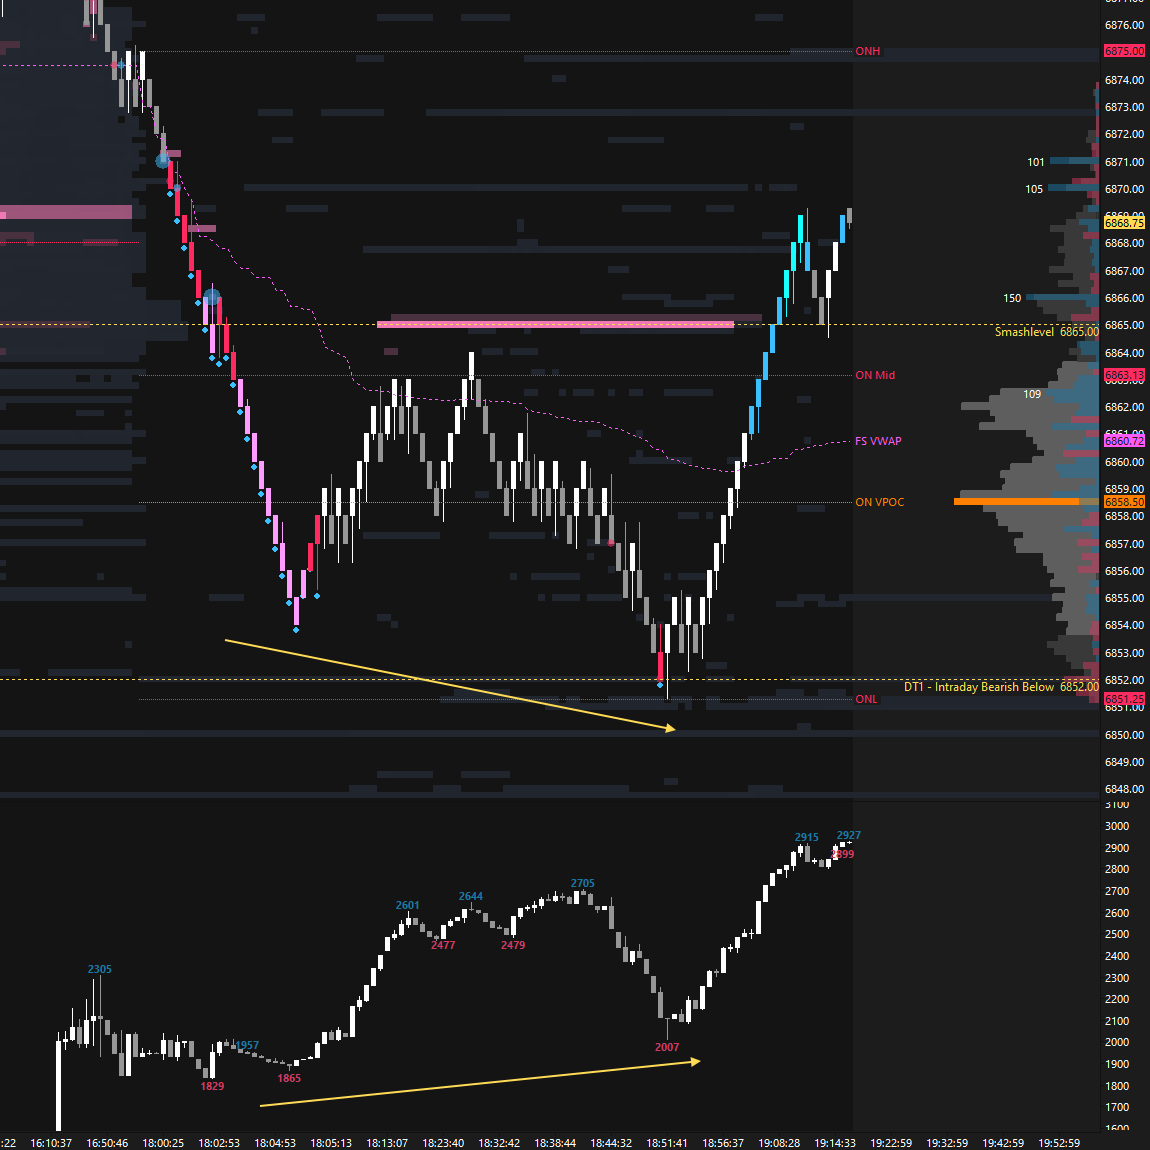
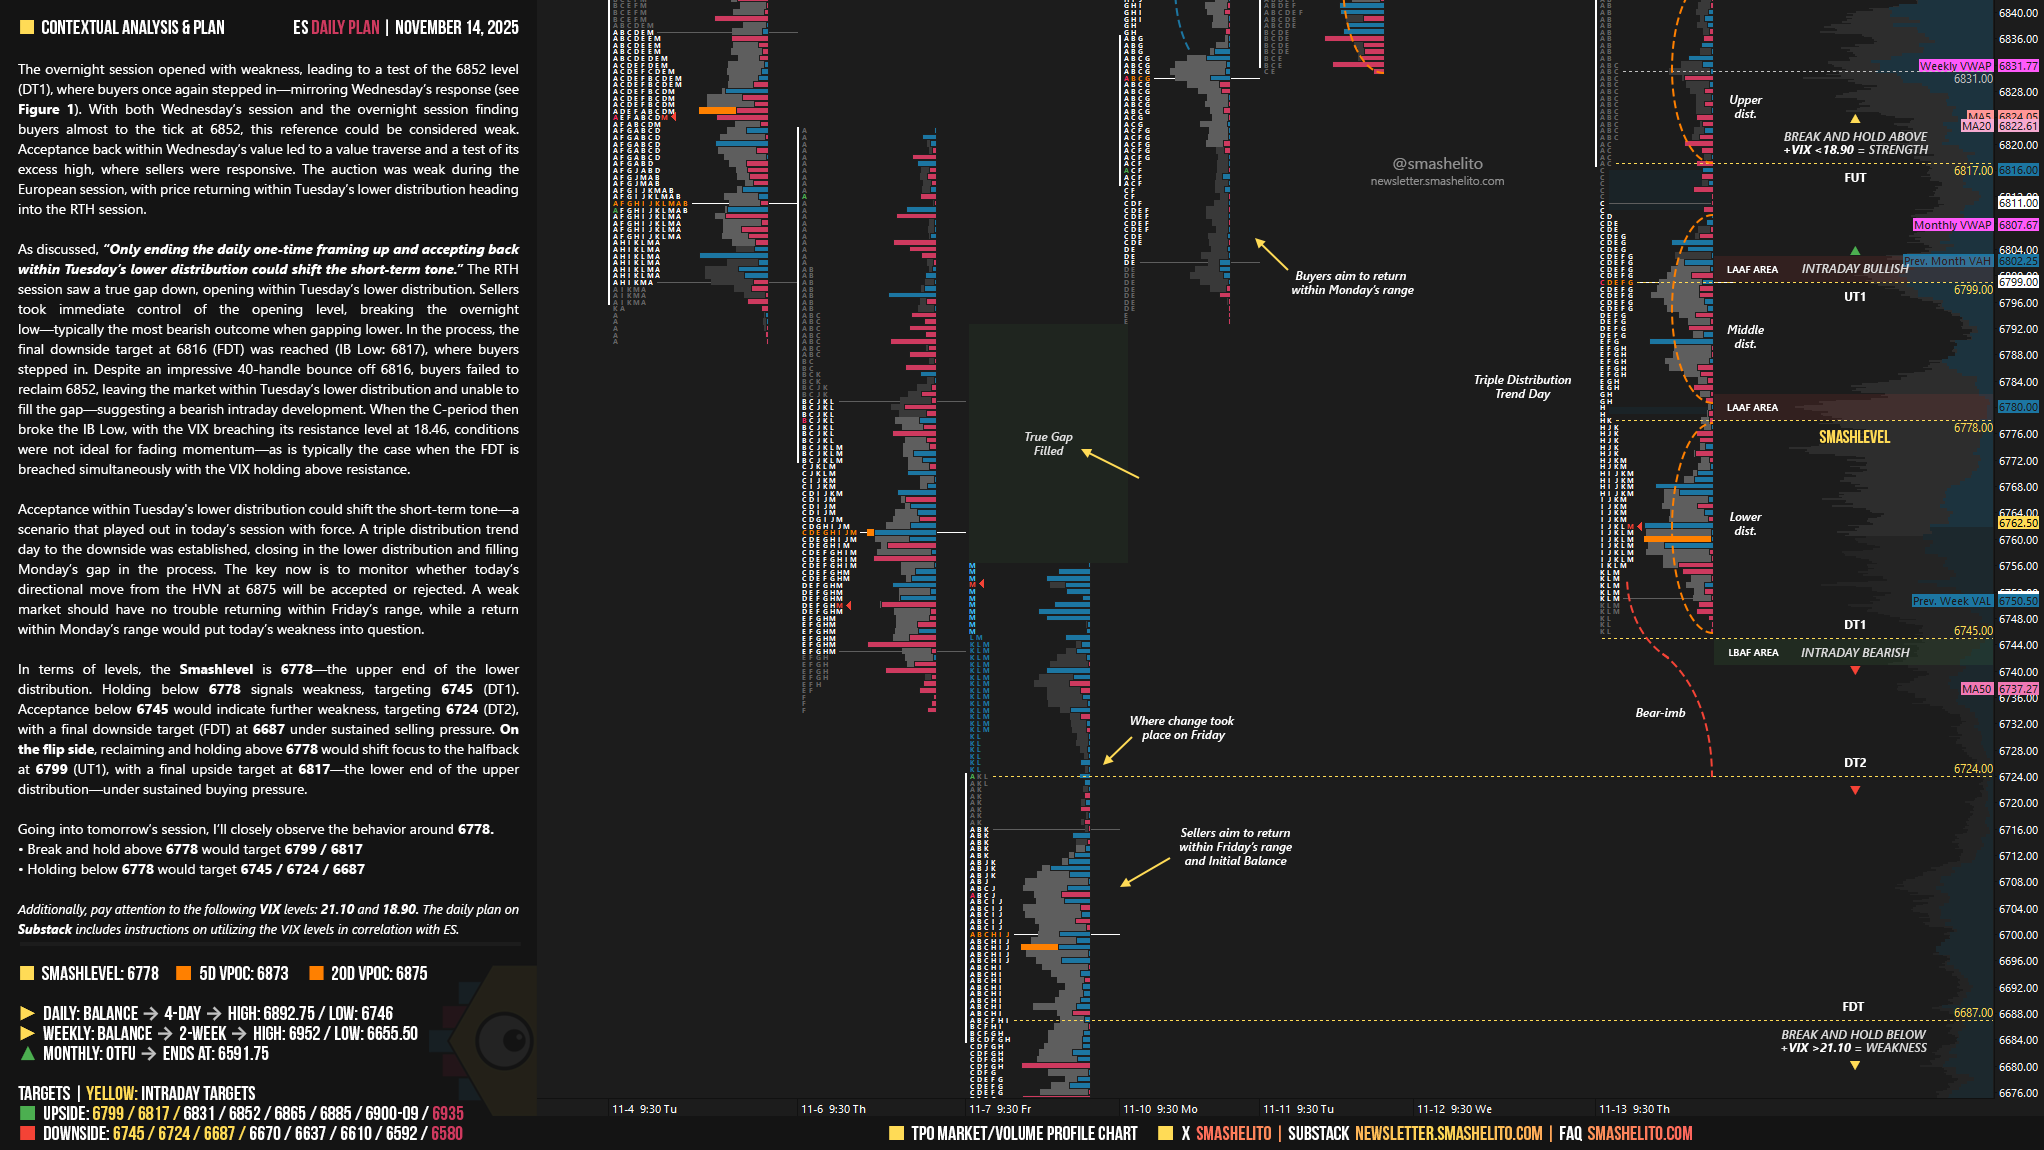
The overnight session opened with weakness, leading to a test of the 6852 level (DT1), where buyers once again stepped in—mirroring Wednesday’s response (see Figure 1). With both Wednesday’s session and the overnight session finding buyers almost to the tick at 6852, this reference could be considered weak. Acceptance back within Wednesday’s value led to a value traverse and a test of its excess high, where sellers were responsive. The auction was weak during the European session, with price returning within Tuesday’s lower distribution heading into the RTH session.
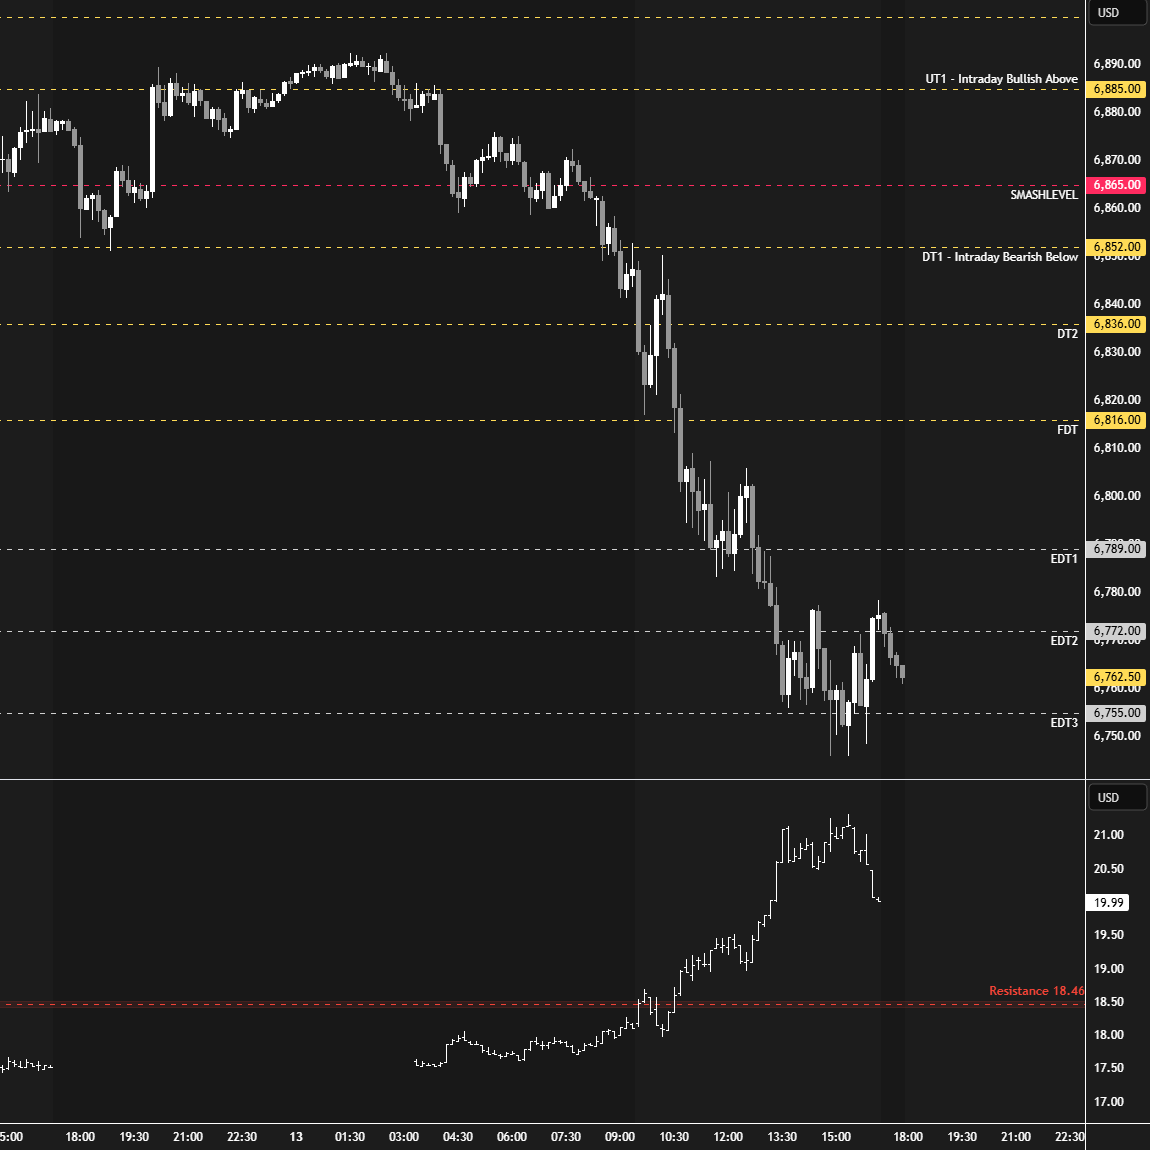
As discussed, “Only ending the daily one-time framing up and accepting back within Tuesday’s lower distribution could shift the short-term tone.” The RTH session saw a true gap down, opening within Tuesday’s lower distribution. Sellers took immediate control of the opening level, breaking the overnight low—typically the most bearish outcome when gapping lower. In the process, the final downside target at 6816 (FDT) was reached (IB Low: 6817), where buyers stepped in. Despite an impressive 40-handle bounce off 6816, buyers failed to reclaim 6852, leaving the market within Tuesday’s lower distribution and unable to fill the gap—suggesting a bearish intraday development. When the C-period then broke the IB Low, with the VIX breaching its resistance level at 18.46, conditions were not ideal for fading momentum—as is typically the case when the FDT is breached simultaneously with the VIX holding above resistance.
Acceptance within Tuesday’s lower distribution could shift the short-term tone—a scenario that played out in today’s session with force. A triple distribution trend day to the downside was established, closing in the lower distribution and filling Monday’s gap in the process. The key now is to monitor whether today’s directional move from the HVN at 6875 will be accepted or rejected. A weak market should have no trouble returning within Friday’s range, while a return within Monday’s range would put today’s weakness into question.
In terms of levels, the Smashlevel is 6778—the upper end of the lower distribution. Holding below 6778 signals weakness, targeting 6745 (DT1). Acceptance below 6745 would indicate further weakness, targeting 6724 (DT2), with a final downside target (FDT) at 6687 under sustained selling pressure.
On the flip side, reclaiming and holding above 6778 would shift focus to the halfback at 6799 (UT1), with a final upside target at 6817—the lower end of the upper distribution—under sustained buying pressure.
Levels of Interest
Going into tomorrow’s session, I’ll closely observe the behavior around 6778.
Break and hold above 6778 would target 6799 / 6817
Holding below 6778 would target 6745 / 6724 / 6687
Additionally, pay attention to the following VIX levels: 21.10 and 18.90. These levels can provide confirmation of strength or weakness.
Break and hold above 6817 with VIX below 18.90 would confirm strength.
Break and hold below 6687 with VIX above 21.10 would confirm weakness.
Overall, it's important to exercise caution when trading outside of the highlighted yellow levels. A non-cooperative VIX may suggest possible reversals i.e trade setups.
Stud! How was the trading day?
First of all, thank you as always for the unfailing analysis. I'm a better trader thanks to you. The VIX element has allowed me to know when to sit back and be patient; it has saved me on several occasions by preventing me from being the first to buy a dip. I have a question: According to Jim, a double distribution is treated as two separate profiles. In the case of a Trend Multi-Distribution Day Type, is the same principle used?