ES Daily Plan | November 12, 2025
Market Context & Key Levels for the Day Ahead
— For new subscribers
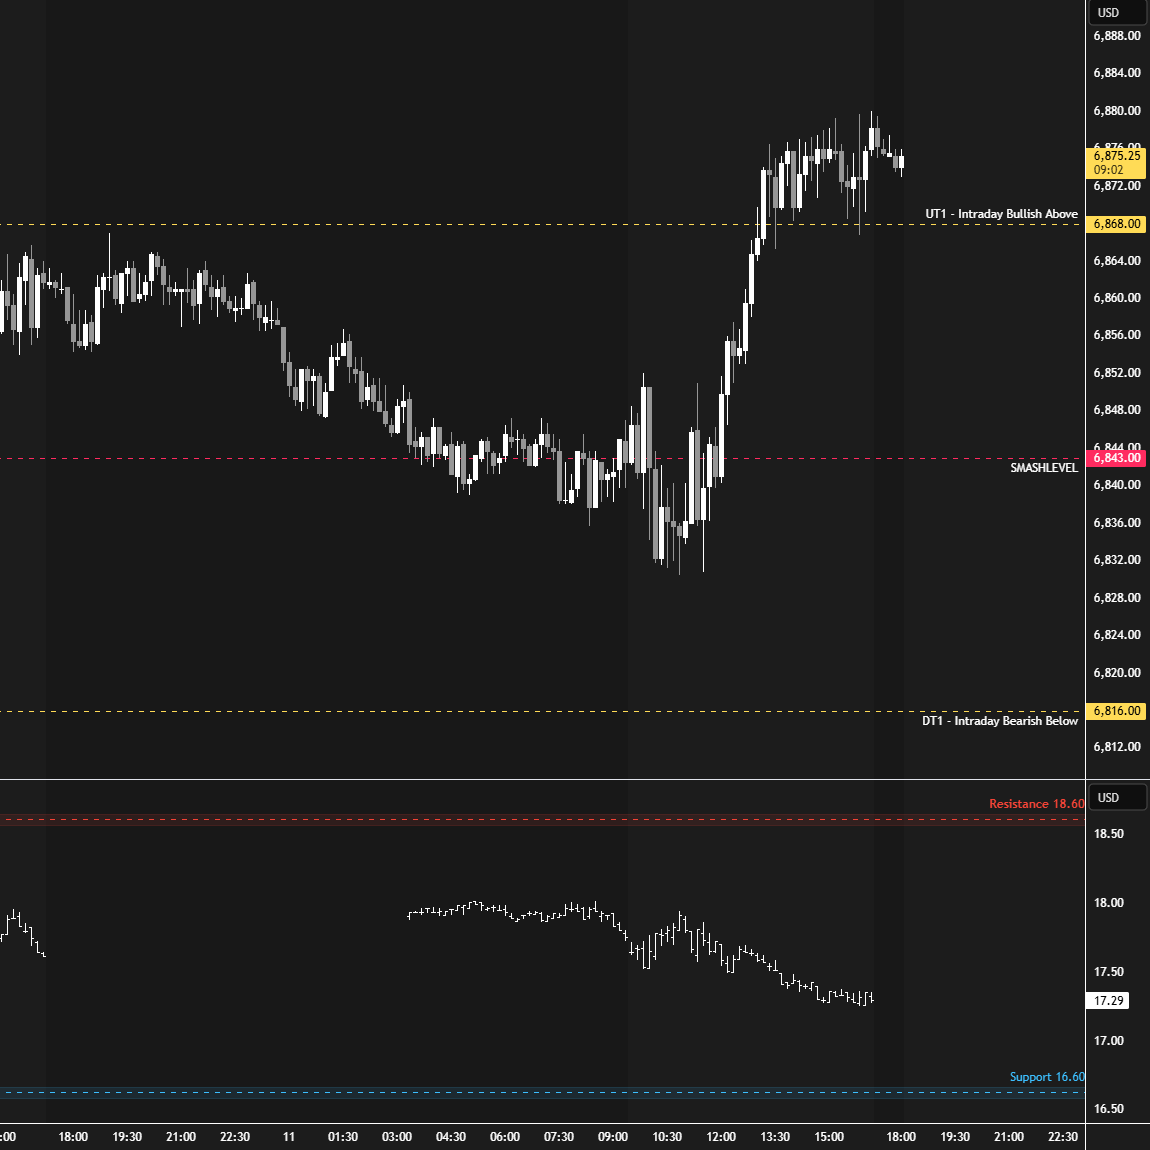
The yellow levels highlighted at the bottom left of the chart are the primary intraday levels I focus on. To avoid impulsive decisions at poor trade locations, I follow a simple but effective rule: exercise caution when initiating trades outside of these yellow levels.
This means I’m cautious about chasing longs above the Final Upside Target (FUT) and shorts below the Final Downside Target (FDT). It’s important to understand that not chasing does not imply initiating a trade in the opposite direction — discipline over impulse.
Be sure to review the Weekly Plan for a broader perspective, key levels, and market expectations for the week ahead.
Contextual Analysis & Plan
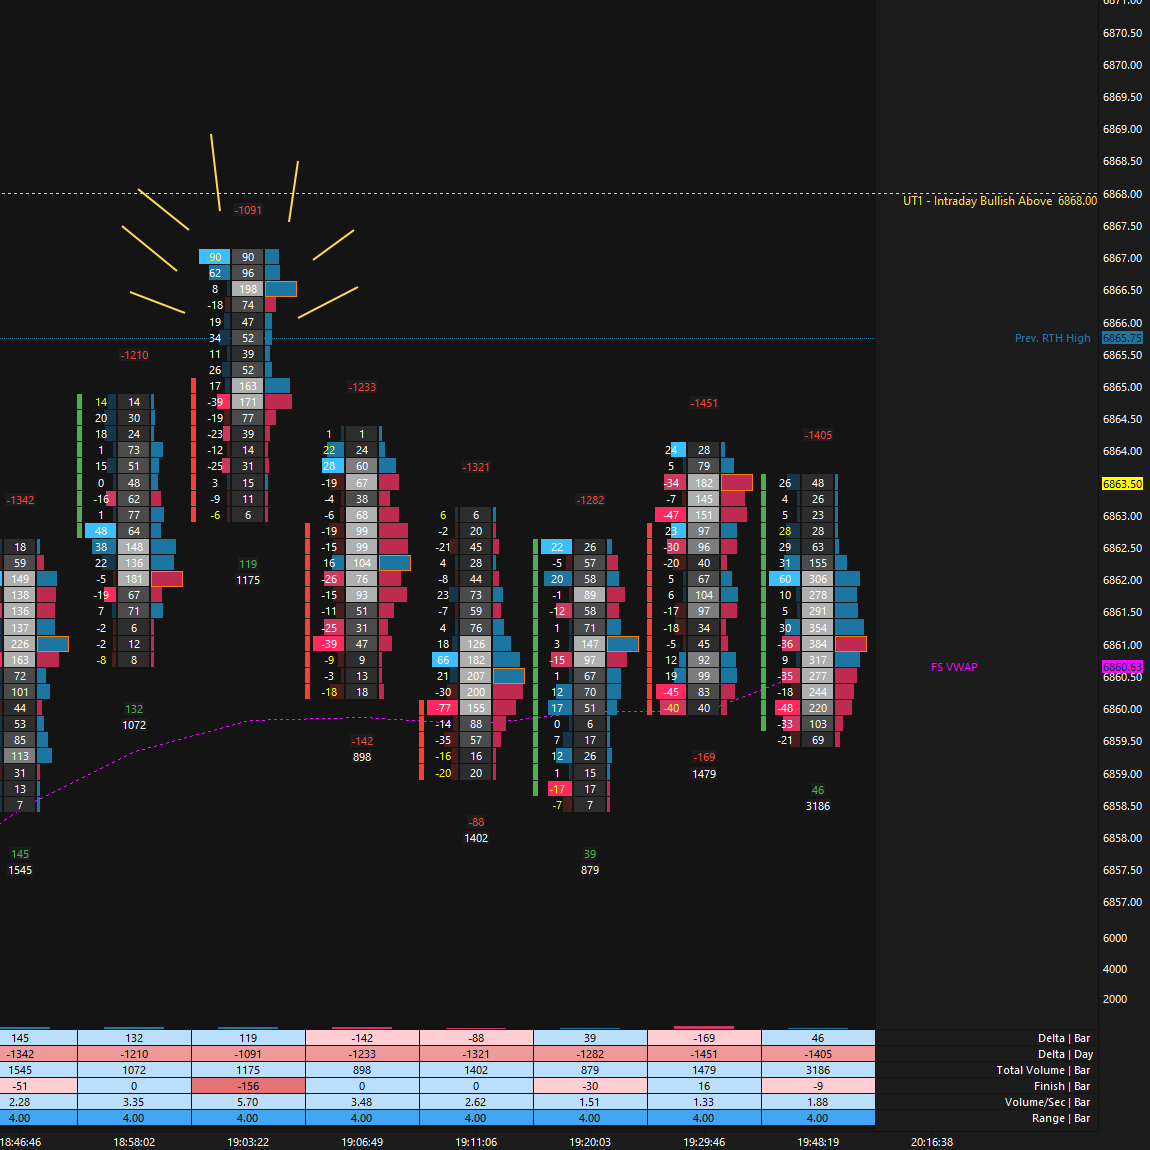
The overnight session kicked off with a sneaky look above and fail of Monday’s RTH high, trapping aggressive buyers just a couple of ticks shy of the UT1 at 6868 (see Figure 1). This triggered a reversal, leading to a return to the Smashlevel at 6843, where a distribution was established pre-open. The most traded price by volume (VPOC) overnight was at 6844, confirming that our pivot area was also important to other participants.
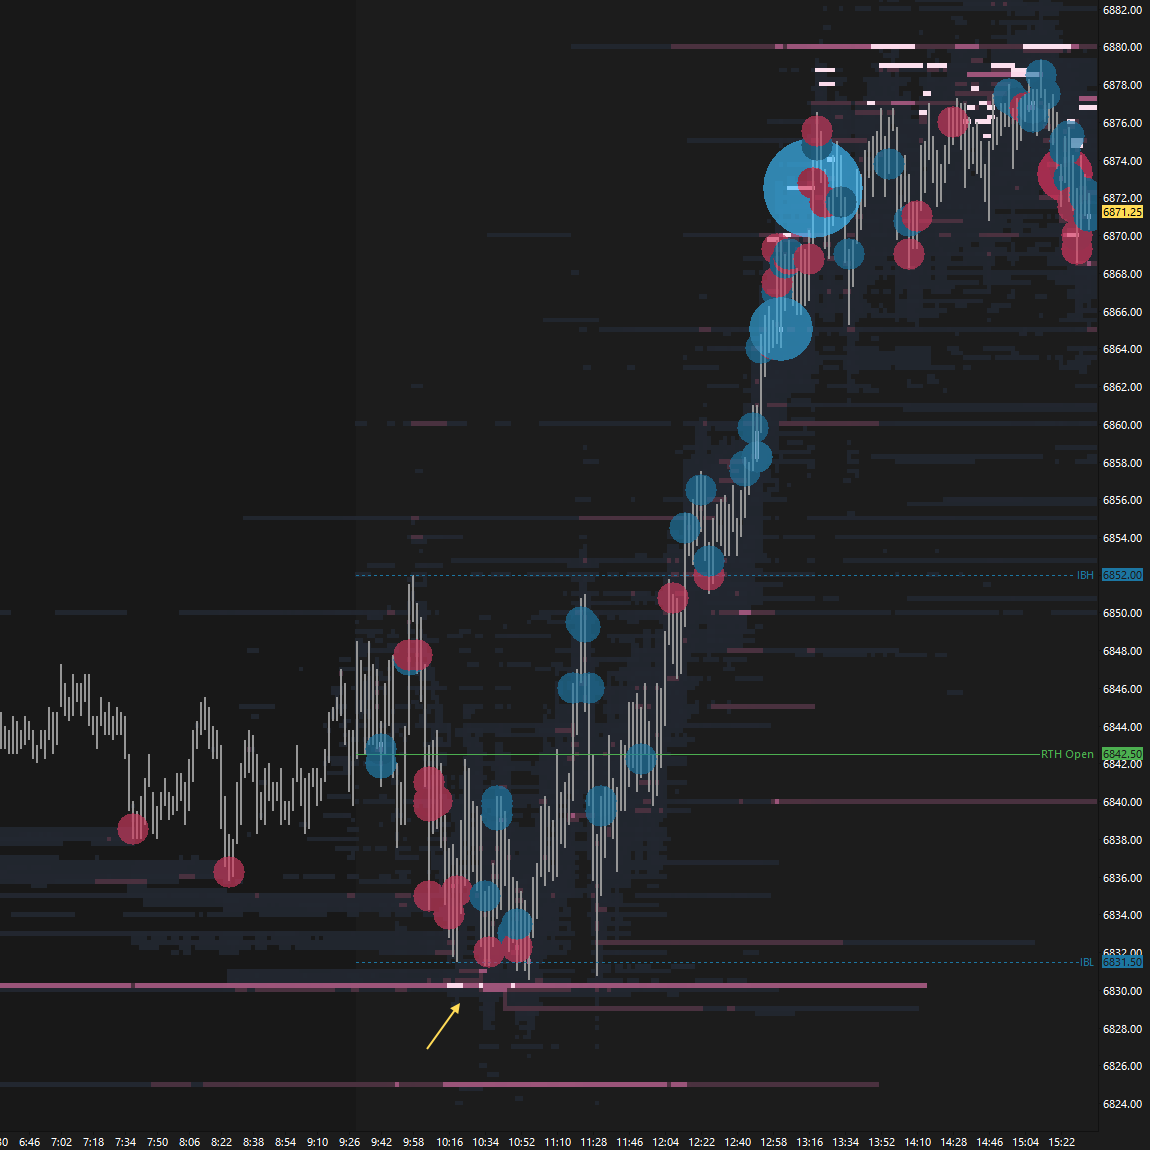
The RTH session opened at 6842.50, with the initial periods characterized by responsive two-sided activity and limited directional conviction, as the market worked to fill the highlighted low-volume area from Monday’s session. Attempts above 6843 were met by passive sellers, while sellers’ efforts to gain traction within Monday’s initial balance were absorbed by passive buyers, where notable resting liquidity was sitting (see Figure 2). Change took place during the F-period, as the initial balance was extended to the upside. As a result, a double distribution profile was established, tagging the UT1 at 6868 in the process.
Note where today’s upper distribution formed—within the value area from the prior 3-day balance. Price is attempting to find acceptance here, which could trigger a value traverse, as previously discussed. Keep in mind the HVN at 6885, which marks the 20D VPOC.
Today’s session was marked by two-sided activity early on, effectively filling Monday’s poor structure. The lack of meaningful downside traction ultimately led to a continuation higher, in line with short-term upside momentum. A double distribution profile was established, with its upper distribution located within a prior area of balance.
The strongest response would involve holding within the upper distribution, while acceptance back within the lower distribution would be the most favorable scenario for sellers attempting to stall the upside pressure.
In terms of levels, the Smashlevel is 6866—the lower end of the upper distribution. Holding above 6866 signals strength, targeting 6885 (UT1). Acceptance above 6885 would indicate further strength, targeting the resistance area between 6900 and 6909 (UT2), with a final upside target at 6935—the Weekly Extreme High—under sustained buying pressure.
On the flip side, failure to hold 6866 would shift focus to today’s initial balance high at 6852 (DT1). Acceptance below 6852 would signal weakness, targeting 6836 (DT2), with a final downside target (FDT) at 6816 under sustained selling pressure.
Levels of Interest
Going into tomorrow’s session, I’ll closely observe the behavior around 6866.
Holding above 6866 would target 6885 / 6900-09 / 6935
Break and hold below 6866 would target 6852 / 6836 / 6812
Additionally, pay attention to the following VIX levels: 18.22 and 16.34. These levels can provide confirmation of strength or weakness.
Break and hold above 6935 with VIX below 16.34 would confirm strength.
Break and hold below 6812 with VIX above 18.22 would confirm weakness.
Overall, it's important to exercise caution when trading outside of the highlighted yellow levels. A non-cooperative VIX may suggest possible reversals i.e trade setups.


Good review!
Midweek, let's go for it all, thanks!