ES Daily Plan | November 12, 2024
My preparations and expectations for the upcoming session.
For new followers: The yellow levels highlighted at the bottom left of the chart are the primary levels that I focus on intraday. My strategy for preventing impulsive decisions at unfavorable locations involves following a simple yet effective rule of exercising caution when initiating trades outside of the yellow levels. This implies that I am cautious chasing longs above the final yellow upside target and shorts below the final yellow downside target. It is crucial to understand that refraining from chasing a trade is not an automatic invitation to initiate a trade in the opposite direction.
Visual Representation
Contextual Analysis
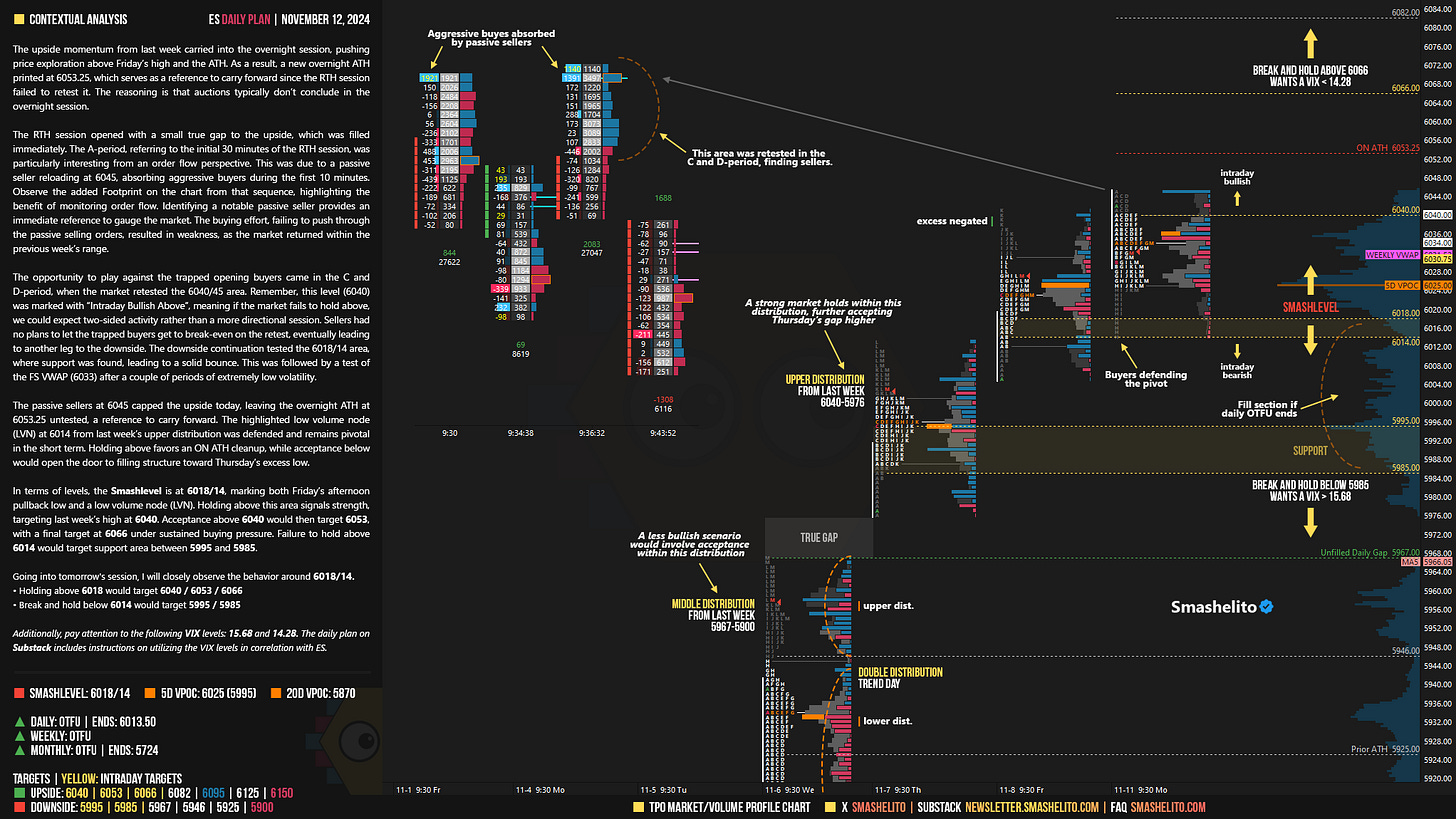
The upside momentum from last week carried into the overnight session, pushing price exploration above Friday’s high and the ATH. As a result, a new overnight ATH printed at 6053.25, which serves as a reference to carry forward since the RTH session failed to retest it. The reasoning is that auctions typically don’t conclude in the overnight session.
The RTH session opened with a small true gap to the upside, which was filled immediately. The A-period, referring to the initial 30 minutes of the RTH session, was particularly interesting from an order flow perspective. This was due to a passive seller reloading at 6045, absorbing aggressive buyers during the first 10 minutes. Observe the added Footprint on the chart from that sequence, highlighting the benefit of monitoring order flow. Identifying a notable passive seller provides an immediate reference to gauge the market. The buying effort, failing to push through the passive selling orders, resulted in weakness, as the market returned within the previous week’s range.
The opportunity to play against the trapped opening buyers came in the C and D-period, when the market retested the 6040/45 area. Remember, this level (6040) was marked with “Intraday Bullish Above”, meaning if the market fails to hold above, we could expect two-sided activity rather than a more directional session. Sellers had no plans to let the trapped buyers get to break-even on the retest, eventually leading to another leg to the downside. The downside continuation tested the 6018/14 area, where support was found, leading to a solid bounce. This was followed by a test of the FS VWAP (6033) after a couple of periods of extremely low volatility.
The passive sellers at 6045 capped the upside today, leaving the overnight ATH at 6053.25 untested, a reference to carry forward. The highlighted low volume node (LVN) at 6014 from last week’s upper distribution was defended and remains pivotal in the short term. Holding above favors an ON ATH cleanup, while acceptance below would open the door to filling structure toward Thursday’s excess low.
In terms of levels, the Smashlevel is at 6018/14, marking both Friday’s afternoon pullback low and a low volume node (LVN). Holding above this area signals strength, targeting last week’s high at 6040. Acceptance above 6040 would then target 6053, with a final target at 6066 under sustained buying pressure. Failure to hold above 6014 would target support area between 5995 and 5985.
Levels of Interest
Going into tomorrow's session, I will closely observe the behavior around 6018/14.
Holding above 6018 would target 6040 / 6053 / 6066
Break and hold below 6014 would target 5995 / 5985
Additionally, pay attention to the following VIX levels: 15.68 and 14.28. These levels can provide confirmation of strength or weakness.
Break and hold above 6066 with VIX below 14.28 would confirm strength.
Break and hold below 5985 with VIX above 15.68 would confirm weakness.
Overall, it's important to exercise caution when trading outside of the highlighted yellow levels. A non-cooperative VIX may suggest possible reversals i.e trade setups.
Weekly Plan
Make sure to review the Weekly Plan, which provides a broader perspective and highlights key levels of interest to observe in the upcoming week.


Thanks Mashelito! Your newsletter not only provides analysis but also educates readers.
Thanks, great as always.